DYDXUSDT

DYDX moving bullish after long timeDYDX seems to bottom out. It closed bullish in weekly chart after 11 weeks. It closed bullish on daily chart as well and even made a break from the smaller falling wedge (red dotted line). The price is now trading above 13 and 20 MA and closing the gap to larger falling wedge – break above would trigger very bullish move (yellow dotted line). DYDX has lots of potential on the upside. My targets; TP1 $11.5, TP2 $15, TP3 19.2, TP4 $23.6; SL under 7.1 - small chance.

DYDX - #DYDX $DYDXDear friend
I checked it in the multi-timeframe.
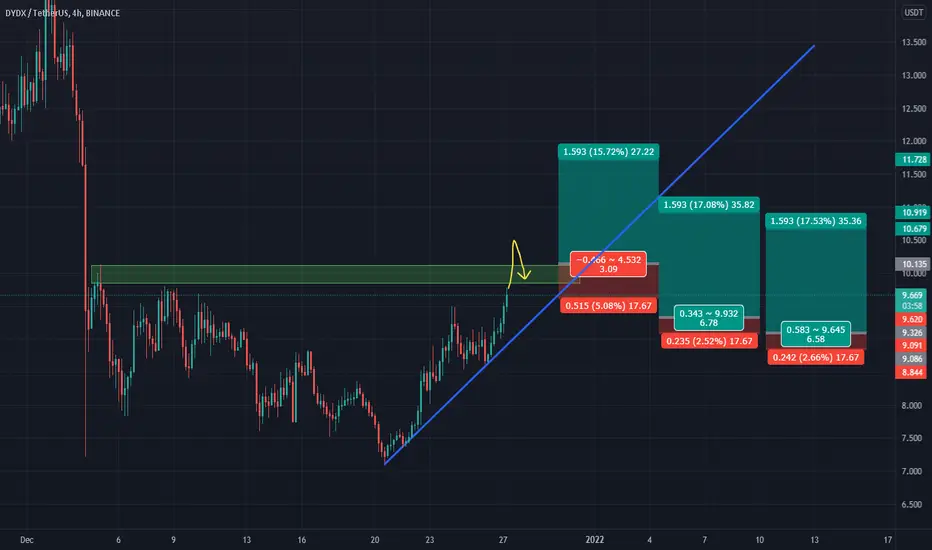
The price has in pullback and exists another support zone 8.1-8.3.
I think it can go up from these areas and could take 20-40% profit.
Resistances are clear.
Disclaimer: Information is provided only for educational and exchange purposes only.
Do your research before taking any action or decision in the real market.

A Clear view of $dYdX Token by means of volume and wyckoff termsan in-depth look at the topic of smart money circulation on $dydx tokens.

#DYDXBUSDDYDX after days going down now broken the down trend line and enter on a positive trend line.

DYDX has done a nice breakout, Next target is 10$!DYDX Short term Update
DYDX is a high potential coin in crypto environment as you know, This coin rejected perfectly from 7.211$ zone.
A breakout of descending trend line and static support zone was a good sign for end of this long correction.
This coin is out of its descending channel now, And this is perfect.
Some range movements above current support area(Blue area) is expected and then the first TP for this coin can be 10$.


DYDX-USDT trade setup Bullish divergence on RSI and price heavily retraced over the last few weeks.
It's time to see a bounce here.

DYDYUSDTIf movment of btc remain same then accourding to my calculation i we will see a goid pump in DYDXUSDT so keep an eye on this coin

DYDXIt comes down as a channel pattern
To climb, you have to break the dynamic and static roof at the same time at the price of $ 12
Given the small market value, the risk is high
You can enter in several steps
My SL is priced at $ 7
Do not use SL and reduce the average purchase at the bottom of the channel
.
I have identified the goals using three-point FIB
Of course, one can look at history and draw resistances ...
.
.
If you have any questions, you can write it in comments below, and I will answer them
And please don't forget to support this idea with your like and follow, thank you...


DYDX refueling for flight ...The DYDX is in a position to start a strong uptrend.
The compactness of this token is coming to an end, and these days it has to decide which way to go.
This movement is unlikely to be down. Because in this case there is no resistance below this position. (Visible resistance)
Strong fundamentals and good conditions The chart of this young token shows a sharp climb.
If ascending, the best point to enter after the pullback is on its trend line. $ 10
Good luck ...

depth seeker.dydx is a solid exchange, one of my favorites.
but because it is so new, market maker is going to try to do their best to get the best possible deal before they run this bad boy up into the heavens.
---
once btc completes this larger frame correction, dydx will be one of my top picks.
---
longer term target for this gem sits at around $100, but not before a deep dive to where it all began.
possible it even takes out the lows to invalidate the potential for this 1-2.
a break of the lows would be my ideal scenario tbh - to get it for the lowest possible price in an area most would absolutely fear buying.
---
how low this goes depends entirely up to what btc wants to do from here.
---
best of luck 💸

DYDX/USDT 300% Potential from here..? From $9 to $50 ..?#DYDXUSDT Update :-
$DYDX looking good for accumulate.
Big Bull flag in Big time frame.
But
For Bullish zone need to breakout $12
If break $12 then we can see $30 easily.
My entry is $8-$9
Stop Loss is $7.20
Targets :- $12/$17/$26/$36
Support :- $8.0
Resistance :- $12

DYDXUSDT , This route can be happen Hello everybody
According to the chart , the price made pattern price and we this this movement can be happen .
But the important things is the trend of the market in DYDX is downward in this time frame and its risky position for buying but it has nice R/r to buy .
Previous analysis :
If you have any question, send us messages
Good Luck
Abtin

DYDX/USDT two scenarios to playWell it can't be any simplier, if we manage to break out above that purple box then we can open long position to around 12.4 which is maximum range of this formation. If we will break out to the downside then we can short the ponzi til 6-8$ range :).
It is not a financial advice, I'm just sharing my personal view.

DYDX Swing longMonthly
Previous monthly candle closure at 12.554, so price must hold 12.50 to keep upside odds alive.
[b}Weekly
Potential double bottom forming in confluence with RSI. Neckline needs to be broken to confirm pattern though.
Invalidation will be a daily Daily closure under 12.5.
dca

💡Don't miss the great buy opportunity in DYDXUSDTTrading suggestion:
". There is a possibility of temporary retracement to the suggested support line (11.35).
. if so, traders can set orders based on Price Action and expect to reach short-term targets."
Technical analysis:
. DYDXUSDT is in an uptrend, and the continuation of the uptrend is expected.
. The price is above the 21-Day WEMA, which acts as a dynamic support.

DYDXUSDT , We are going to ...Hello everybody
According to the price that impact to the support trendline, we expect the price to be supported as the price approaches again and this support rise the price again.
Previous analysis :
Good Luck
Abtin

DYDXUSDT has rested support. It is showing two possible casesDYDXUSDT has rested support. It is showing two possible cases.
It may go down further but keep in mind it may retest here and bounce back again be ready and wait for the confirmation.
Thanks and happy trading.

A leading decentralized exchange (DYDXUSDT analysis)📉📈
Market Cap: $$937,409,071
Circulating Supply : 56,337,466.00 DYDX (6%) ❗❌
Max Supply:1,000,000,000
Holders Statistics:
Top 10 Holders 70.95% ❗❌
Top 20 Holders 80.33%
Top 50 Holders 90.97%
✅What Is DYDX ✴️?
dYdX is an exchange built by developers on a mission to build open, secure, and powerful financial products. dYdX runs on audited smart contracts on Ethereum, which eliminates the need to trust a central exchange while trading.
DYDX token is a governance token that allows the dYdX community to truly govern the dYdX Layer 2 Protocol.
Founded back in 2017 from ex-Coinbase and Uber engineer, Antonio Juliano, dYdX is a leading decentralized exchange offering Perpetual, Margin, & Spot trading, as well as borrow / lend pools on Ethereum. Users can earn interest or take loans for a nominal fee as well as trade on margin with custom leverage.
Trade your crypto, the safe and secure way, with dYdX
coinmarketcap- dydx.community
-----------------------------------------------------------------------------------------------------------------
📉📈TECHNICAL ANALYSIS
As you can see in the Daily time frame for DYDX/USDT, the price is trading around 17 $ right now.
since October after dydx reached its ATH ,it has entered in a retracement and consolidation phase, now I can imagine an expanding triangle pattern that ,the price can raise and play in this shape in the long term . but you probably know the market can form any kind of pattern. I think it wants to jump around from its recent consolidation zone .so if this candle closes above its near green support ,it is not so far to reach to red box resistance around 23$ , Well after that it can have a temporary rebounce on it previous supports and continue its upward rally ,or if it closes above resistance by a sharp candle it it hasn't any resistance in rising way .
--------------------------------------------------------------------------------------------------------------------
tips:
💥(Note that most of my analysis on the weekly timeframe basis is more for long-term investment rather than short-term trading.)
🔰(Anyway, I highly recommend novice investors and traders to consider risk management and buying in a few steps) .
✳️(also Following security measures is vital in cryptocurrency trading. Always remember that $100 worth of a token may become a fortune someday. So treat every penny with respect.)
--------------------------------------------------------------------------------------------------------------------
👉This analysis is my personal opinion ,not a financial advice ,so do your own research.
💜 if you're a fan of my analyses give a big thumbs 👍 OR drop a comment 🗯💭
🙏with Best Regards

DYDX/USDT Wait for a Valid BreakoutDYDX/USDT Wait for a Valid Breakout
IT'S NOT FINANCIAL ADVICE
Follow me for more ideas.
