Dydxusdt | Breakout Confirm Retesting In Process Also Formimg Bullish Flag in 4h time frame expecting 80%-100% bullish move incase of successful retest
Manage Your Trade Accordingly ,
Risk Management Must
Dydxusdtidea

DYDX USDT , DYDX the DEX Coin Will Touch Double Digits!?BINANCE:DYDXUSDT
DYDX was in MARK DOWN Phase from very long time and entered in an accumulation range and now moving for a MARK UP Phase.
Being A Pure Technical Analyst..Let's Move Straight To The Charts!
DYDX on Higher Timeframe was in accumulation(261 days) from long time and just broke out few weeks ago.
Right Now it tested on that range high in the form of a Bull flag which is meant to be bullish for its price action and should start a rally in next few days
If you are looking for Entries, then on lower time frame if DYDX retraces to 2.7-2.9$ can be good entry for you to hold for high time frame play
First Target Would be 3.9$
Second Target Would be 6.5$
Third Target Would be 10$
4$ has strong resistance..it can take multiple tries to break that
Okay so That's it for DYDX
Hoping you liked the analysis :)
Please like and comment your views on DYDX and also follow us for more setups as i am going to post detailed analysis for many Altcoins!
See you in next Altcoin Analysis

DYDXUSDT Elliott Waves AnalysisHello friends.
Please support my work by clicking the LIKE button👍(If you liked). Also i will appreciate for ur activity. Thank you!
Everything on the chart. (update)
im still in pos, targets is relevant
Entry: market and lower
Target: 3 - 4 - 5
after first target reached move ur stop to breakeven
Stop: under 1 (depending of ur risk). ALWAYS follow ur RM .
risk is justified
Good luck everyone!
Follow me on TRADINGView, if you don't want to miss my next analysis or signals.
It's not financial advice.
Dont Forget, always make your own research before to trade my ideas!
Open to any questions and suggestions.

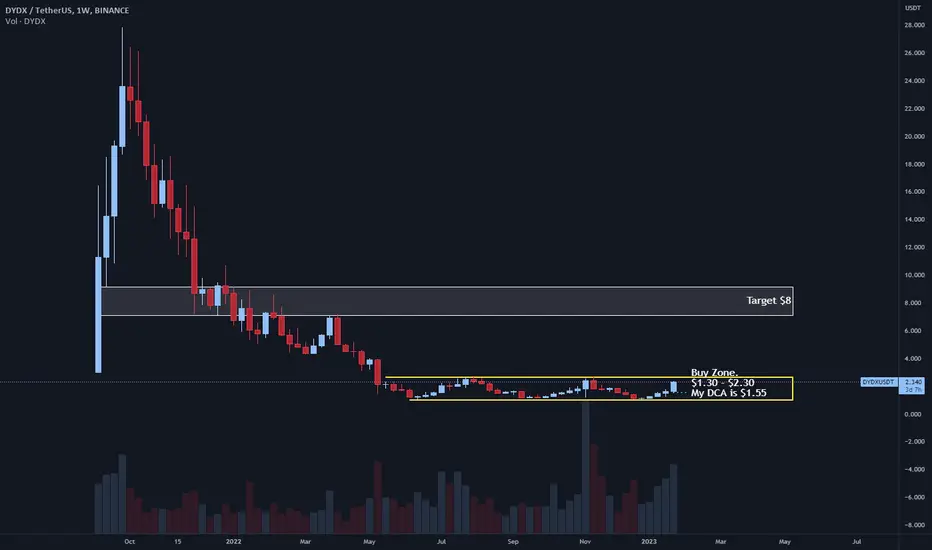
$DYDX will leave you behind scratching your head.FIFTH EXAMPLE!
I wasn't going to give more examples of what Altcoins to look for, but this one is a good one and I couldn't help but share it.
$DYDX
Looking for Targets of $8 within a few weeks/months.
KEEP AN EYE ON THIS ONE!
My DCA is $1.55
I have no SL, This is SPOT!
Try and buy before the Darvas Box accumulation breaks outs.
All this depends on $BTC and the continuation of the market. but select coins (Such as this) might not even care about the Bitcoin Market once they move big.
DYDXUSDT SHORT OPPORTUNITYHere we can see that "DYDXUSDT" in 1 day time frame has a trendline resistance at "1.981" and you can see a good short opportunity.
ENTRY - "1.981"
TARGET - "1.576"
STOPLOSS - "2.073"
ENJOY!!!!!

It's time to see correction on DYDX?I think here is the crucial price for DYDX that can be giving us a position I don't know which position ( long or short ) we will have, for opening position we must go a lower time frame and see what will happen!
The time frame I will make a decision is 15Min...

DYDXUSDT Elliott Waves AnalysisHello friends.
Please support my work by clicking the LIKE button👍(If you liked). Also i will appreciate for ur activity. Thank you!
Everything on the chart.
Nothing has changed from my last idea. Everything is relevant.
Entry: market and lower
Target: 3 - 4 - 5
after first target reached move ur stop to breakeven
Stop: ~1.15 (depending of ur risk). ALWAYS follow ur RM .
Risk/Reward: 1 to 6
risk is justified
Good luck everyone!
Follow me on TRADINGView, if you don't want to miss my next analysis or signals.
It's not financial advice.
Dont Forget, always make your own research before to trade my ideas!
Open to any questions and suggestions.

DYDXDYDX broke the structure on the 4H. On the weekly, is a strong downtrend. We are trading from a point of value on the daily( MA 20 and 50) notting that momentum is to the downside based on the STOCH.

DYDXUSDTPERP - Tool review.A trading range is formed on the chart with the boundaries 1.007 - 2.72.
When the price repeatedly approached the upper boundary, the breakout of the local maximum did not take place. For the given period of time accumulation is in the final phase. In this phase for the transition to the impulsive upward movement it is necessary that the price would break the local maximum and consolidate above it. In the presence of the SOS signal and BU/LPS will be a confirmation of a successful accumulation. In the absence of these signals we expect a further decline in price, to the middle of the range the second target is the lower boundary of support.
If you liked the idea, please like it. That's the best "Thank you!" for the author 😊
P.S. Always do your own analysis before a trade. Put a stop loss. Fix profits in installments. Withdraw profits in fiat and please yourself and your
your friends.

🔴 DYDXUSDT - 4H (14.11.2022)🔴 DYDX USDT
TF: 4H
Side: Short
Entry: $2.393
SL: $2.566
TP 1 - $2.240
TP 2 - $2.038
TP 3 - $1.874
DYDXUSDT is due for a correction on the 4 hour time frame.

DYDXUSDT Analysis (midterm vision)Hello friends.
Please support my work by clicking the LIKE button👍(If you liked). Also i will appreciate for ur activity. Thank you!
Everything on the chart.
Entry: market and lower
Target: 3 - 4 and maybe 5
after first target reached move ur stop to breakeven
Stop: under 1 (depending of ur risk). ALWAYS follow ur RM .
Risk/Reward: 1 to 5
risk is justified
Good luck everyone!
Follow me on TRADINGView, if you don't want to miss my next analysis or signals.
It's not financial advice.
Dont Forget, always make your own research before to trade my ideas!
Open to any questions and suggestions.

Trading opportunity for long position DYDXUSDTBased on technical factors there is a Long position in :
📊 DYDXUSDT
🔵 Long Now 0.00
🧯 Stop loss 1.678
🏹 Target 1 2.300
🏹 Target 2 3.100
🏹 Target 3 3.750
💸RISK : 1%
We hope it is profitable for you ❤️
Please support our activity with your likes👍 and comments📝

DYDX chance for double bottomDYDX /USDT
Price in downtrend since 1 year inside massive descending broadening wedge
We also notice a possible double bottom in the chart
Keep it simple :
1- If price could break and sustain above trendline resistance we can see strong bullish wave in next days
2- incase of breakdown of Local support it will continue in downward direction
What do you think about DYDX ?
Could this time be a different time or not ?

DYDXUSDT - Flag Pattern DYDXUSDT (4h Chart) Technical analysis
DYDXUSDT (4h Chart) Currently trading at $1.465
Buy level: Above $1.47
Stop loss: Below $1.4
TP1:$1.495
TP2: $1.57
TP3: $1.64
TP4: $1.75
Max Leverage 3x
Always keep Stop loss
Follow Our Tradingview Account for More Technical Analysis Updates, | Like, Share and Comment Your thoughts

DYDX - DYDXUSDT #DYDX $DYDX #BTC $BTC
- BAT Pattern 🦇
- Daily Frame
# 🎧
#This is my technical opinion and not a recommendation to buy or sell

dYdX (DYDX) formed bullish Shark | A good long opportunityHi dear friends, hope you are well and welcome to the new trade setup of dYdX (DYDX) token with Bitcoin pair.
On a 4-hr time frame, DYDX has formed a bullish Shark pattern. Right now the priceline is slightly moved up, therefore, we can wait for some price correction to catch it from the buying zone.

DYDX usdt forecast and ideaPlease write any advice or suggestions.
Dear friends, request any cryptocurrency pair, currencies pair for forex, and any index that you want to be analyzed and ask any questions.
Thanks for your attention

dYdX (DYDX) formed bullish BAT for another upto 13% pumpHi dear friends, hope you are well and welcome to the new trade setup of dYdX (DYDX) token with the US Dollar pair.
In the previous trade DYDX slightly move below than potential reversal zone, however, it then pumped well:
Now on a 4-hr time frame, DYDX has formed bullish BAT pattern.
Note: Above idea is for educational purpose only. It is advised to diversify and strictly follow the stop loss, and don't get stuck with trade

DYDXUSDT Analysis (LOCAL VISION)Hello friends.
Please support my work by clicking the LIKE button👍(If you liked). Also i will appreciate for ur activity. Thank you!
Everything on the chart.
Entry: market and lower
Target: 2.4 and 2.6
after first target reached move ur stop to breakeven
Stop: ~1.6 (depending of ur risk). ALWAYS follow ur RM .
Risk/Reward: 1 to 4
risk is justified
Good luck everyone!
Follow me on TRADINGView, if you don't want to miss my next analysis or signals.
It's not financial advice.
Dont Forget, always make your own research before to trade my ideas!
Open to any questions and suggestions.

DYDXUSDTPERP Possible Downward MoveUPDATED :
BINANCE:DYDXUSDTPERP Possible Downward Movement - RISKY TRADE Use Max 10x - 3%-5% Funds.
Entry 1 : 3.69
Entry 2 : 3.8
Entry 3 : 3.95
Targets: 3.5 - 3.4 - 3.3 - 3.2 - 3.18
Stop Loss : 4.0
IMPORTANT: Do Proper Risk Management

DYDX LONG SIGNALNice to meet you, everyone
I'm an alt trader
I'm analyzing and recommending things that are similar to my personality among many alt coins

DYDXUSDT AnalysisHello friends.
Please support my work by clicking the LIKE button👍(If you liked). Also i will appreciate for ur activity. Thank you!
Everything on the chart.
Entry: market and lower
Target: 5.2 - 6 - 7.5
after first target reached move ur stop to breakeven
Stop: ~3.8 (depending of ur risk). ALWAYS follow ur RM .
Risk/Reward: 1 to 4.5
risk is justified
Good luck everyone!
Follow me on TRADINGView, if you don't want to miss my next analysis or signals.
It's not financial advice.
Dont Forget, always make your own research before to trade my ideas!
Open to any questions and suggestions.

DYDXUSDT Analysis (LOCAL VISION)Hello friends.
Please support my work by clicking the LIKE button👍(If you liked). Also i will appreciate for ur activity. Thank you!
Everything on the chart.
Entry: market and lower
Target: 5.5
after first target reached move ur stop to breakeven
Stop: ~4.2 (depending of ur risk). ALWAYS follow ur RM .
Risk/Reward: 1 to 2
risk is justified
Good luck everyone!
Follow me on TRADINGView, if you don't want to miss my next analysis or signals.
It's not financial advice.
Dont Forget, always make your own research before to trade my ideas!
Open to any questions and suggestions.
