dYdX (DYDX) formed bullish Gartley for upto 21% pumpHi dear friends, hope you are well and welcome to the new trade setup of dYdX (DYDX) token with US Dollar pair.
Previously we caught a nice trade of DYDX:
On a 4-hr time frame, AR has formed a bullish Gartley move for a bullish reversal move soon.
Note: Above idea is for educational purpose only. It is advised to diversify and strictly follow the stop loss, and don't get stuck with trade
Dydxusdtlong

DYDX USDT , DYDX the DEX Coin Will Touch Double Digits!?BINANCE:DYDXUSDT
DYDX was in MARK DOWN Phase from very long time and entered in an accumulation range and now moving for a MARK UP Phase.
Being A Pure Technical Analyst..Let's Move Straight To The Charts!
DYDX on Higher Timeframe was in accumulation(261 days) from long time and just broke out few weeks ago.
Right Now it tested on that range high in the form of a Bull flag which is meant to be bullish for its price action and should start a rally in next few days
If you are looking for Entries, then on lower time frame if DYDX retraces to 2.7-2.9$ can be good entry for you to hold for high time frame play
First Target Would be 3.9$
Second Target Would be 6.5$
Third Target Would be 10$
4$ has strong resistance..it can take multiple tries to break that
Okay so That's it for DYDX
Hoping you liked the analysis :)
Please like and comment your views on DYDX and also follow us for more setups as i am going to post detailed analysis for many Altcoins!
See you in next Altcoin Analysis

DYDXUSDT Flag Pattern!DYDXUSDT Technical analysis update
Buy zone: Below $2.90
Stop loss : $2.65
Take Profit 1 : $3.10
Take Profit 2: $3.30
Take Profit 3 : $3.65
Always keep stop loss
Thanks
Hexa

DYDX/USD, Triple bottom formed? Buy Sign for me!Greetings, and welcome back to my analysis! I've been keeping a close eye on DYDX/USD since November of last year, and my analysis suggests that it has already formed a bottom. Currently, the price is at a key level of resistance on the weekly chart, specifically a supply level. As traders and investors, it's important for us to pay attention to these levels as they can indicate potential changes in market sentiment.
A breakout from this level, where the price moves above the supply level, could signal a bullish trend and may present an opportunity to enter a long position. This is because a breakout from a supply level indicates that the bears have lost control and the bulls are starting to take control.
Additionally, if the price does break out from this level, we should also be aware of retest and consolidation. Retest refers to the price coming back to the breakout level, to confirm that the level is indeed broken, and consolidation refers to the price moving in a tight range after the breakout. Both of these factors can indicate that the market is gathering momentum before continuing in the direction of the breakout.
However, it's also important to note that we should also have an exit plan in case of invalidation, which means that the price falls below the supply level. This would indicate that the breakout was false and the bears are still in control of the market. This would lead us to close our long positions and wait for a new setup to form.
Overall, DYDX/USD is currently at a key level of resistance, and a breakout from this level, along with confirmation through retest and consolidation, could present a bullish opportunity. However, we must always be prepared for the possibility of invalidation and have a clear exit plan in place.


DYDXUSDT Elliott Waves AnalysisHello friends.
Please support my work by clicking the LIKE button👍(If you liked). Also i will appreciate for ur activity. Thank you!
Everything on the chart. (update)
im still in pos, targets is relevant
Entry: market and lower
Target: 3 - 4 - 5
after first target reached move ur stop to breakeven
Stop: under 1 (depending of ur risk). ALWAYS follow ur RM .
risk is justified
Good luck everyone!
Follow me on TRADINGView, if you don't want to miss my next analysis or signals.
It's not financial advice.
Dont Forget, always make your own research before to trade my ideas!
Open to any questions and suggestions.

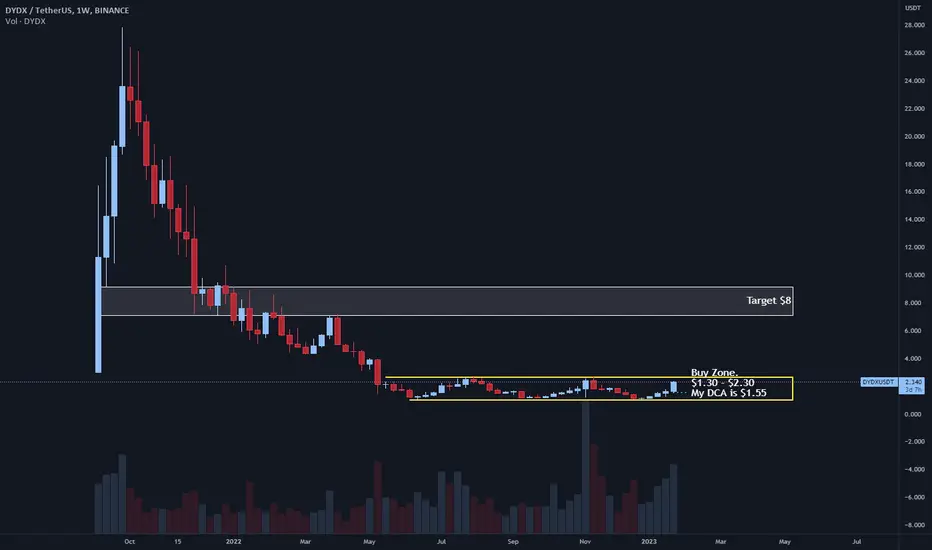
$DYDX will leave you behind scratching your head.FIFTH EXAMPLE!
I wasn't going to give more examples of what Altcoins to look for, but this one is a good one and I couldn't help but share it.
$DYDX
Looking for Targets of $8 within a few weeks/months.
KEEP AN EYE ON THIS ONE!
My DCA is $1.55
I have no SL, This is SPOT!
Try and buy before the Darvas Box accumulation breaks outs.
All this depends on $BTC and the continuation of the market. but select coins (Such as this) might not even care about the Bitcoin Market once they move big.
$DYDX #DYDX | LTF LONGGreen box and EQ might be worked as a support level .
The bottom of the red box, liquidity zone and around 1.93 will be the points I will observe as resistance.
With the loss of 1.53 (1H) , the first bounce of the price will be around 1.38 .
I wish everyone a good week.

Dydx price targets before unlock BINANCE:DYDXUSDTPERP
✅Before we start to discuss, I would be glad if you share your opinion on this post's comment section and hit the like button if you enjoyed it.
Thank you.
Watch this potential plan before unlock coins at the beginning of February
Possible Targets and explanation idea
➡️We trade over 230 days in an accumulation range.
➡️Before massive unlock coins at the beginning of February whales can pump #DYDX because they need liquidity to sell
➡️On weekly chart we formed 2 bottom and targets is 0.5 lvl and 0.78 lvl
➡️ After this level and unlock we can see pull back down again to main support level 2.70 - 2 $ per DYDX
➡️ Most hyped price when we can see FOMO on DYDX is 10-11$
➡️ Its just local picture for middle term targets
Hope you enjoyed the content I created, You can support with your likes and comments this idea so more people can watch!
✅Disclaimer: Please be aware of the risks involved in trading. This idea was made for educational purposes only not for financial Investment Purposes.
* Look at my ideas about interesting altcoins in the related section down below ↓
* For more ideas please hit "Like" and "Follow"!

DYDXUSDT Elliott Waves AnalysisHello friends.
Please support my work by clicking the LIKE button👍(If you liked). Also i will appreciate for ur activity. Thank you!
Everything on the chart.
Nothing has changed from my last idea. Everything is relevant.
Entry: market and lower
Target: 3 - 4 - 5
after first target reached move ur stop to breakeven
Stop: ~1.15 (depending of ur risk). ALWAYS follow ur RM .
Risk/Reward: 1 to 6
risk is justified
Good luck everyone!
Follow me on TRADINGView, if you don't want to miss my next analysis or signals.
It's not financial advice.
Dont Forget, always make your own research before to trade my ideas!
Open to any questions and suggestions.

DYDX swing trade setupBINANCE:DYDXUSDT
Local Swing Trade setup before FED hike rate in 14 Dec
✅Before we start to discuss, I would be glad if you share your opinion on this post's comment section and hit the like button if you enjoyed it.
Thank you.
Possible Targets and explanation idea
➡️Local fib since top Higher High and double bottom on Weekly timeframe
➡️Correction to 0.78 level (there under this level people add stop losses) 1.60$ there we got signal to buy on TradeOn indicator
➡️We can keep this impulse and test 0.38 lvl to 2.12$ and trade in upper part of downside channel
➡️Than we can grab liquidity at 0.86 lvl and bounced from this level around 7-10 December before FED decision
➡️Or earlier going out of channel after break out 0.5 lvl
➡️Middle term target 5-6$ for DYDX still relevant
Hope you enjoyed the content I created, You can support with your likes and comments this idea so more people can watch!
✅Disclaimer: Please be aware of the risks involved in trading. This idea was made for educational purposes only not for financial Investment Purposes.
* Look at my ideas about interesting altcoins in the related section down below ↓
* For more ideas please hit "Like" and "Follow"!


DYDXUSDTPERP - Tool review.A trading range is formed on the chart with the boundaries 1.007 - 2.72.
When the price repeatedly approached the upper boundary, the breakout of the local maximum did not take place. For the given period of time accumulation is in the final phase. In this phase for the transition to the impulsive upward movement it is necessary that the price would break the local maximum and consolidate above it. In the presence of the SOS signal and BU/LPS will be a confirmation of a successful accumulation. In the absence of these signals we expect a further decline in price, to the middle of the range the second target is the lower boundary of support.
If you liked the idea, please like it. That's the best "Thank you!" for the author 😊
P.S. Always do your own analysis before a trade. Put a stop loss. Fix profits in installments. Withdraw profits in fiat and please yourself and your
your friends.

DYDX Prepares for the Next RiseWith the break of 2.72 usd price, the price may reach a target between 5.60 - 9 usd. The price is likely to rest here for a short while. This movement could begin tomorrow or the next day. Good luck.

We will retouch $2.5 to 3 ZONE soonSimple as always
LONG DYDX
STOP LOSS : 2.1
ENTER: 2.2 ZONE
~ do not do over leverge in this red market ~

DYDXUSDT Analysis (midterm vision)Hello friends.
Please support my work by clicking the LIKE button👍(If you liked). Also i will appreciate for ur activity. Thank you!
Everything on the chart.
Entry: market and lower
Target: 3 - 4 and maybe 5
after first target reached move ur stop to breakeven
Stop: under 1 (depending of ur risk). ALWAYS follow ur RM .
Risk/Reward: 1 to 5
risk is justified
Good luck everyone!
Follow me on TRADINGView, if you don't want to miss my next analysis or signals.
It's not financial advice.
Dont Forget, always make your own research before to trade my ideas!
Open to any questions and suggestions.

Trading opportunity for long position DYDXUSDTBased on technical factors there is a Long position in :
📊 DYDXUSDT
🔵 Long Now 0.00
🧯 Stop loss 1.678
🏹 Target 1 2.300
🏹 Target 2 3.100
🏹 Target 3 3.750
💸RISK : 1%
We hope it is profitable for you ❤️
Please support our activity with your likes👍 and comments📝

DYDX longDYDX is experiencing a pullback after a strong move that happened yesterday. It is bouncing off the support zone and the Fibonacci 0.5 level. Bullish movement to resistance level at 1.915 is possible.

DYDXUSDT - Flag Pattern DYDXUSDT (4h Chart) Technical analysis
DYDXUSDT (4h Chart) Currently trading at $1.465
Buy level: Above $1.47
Stop loss: Below $1.4
TP1:$1.495
TP2: $1.57
TP3: $1.64
TP4: $1.75
Max Leverage 3x
Always keep Stop loss
Follow Our Tradingview Account for More Technical Analysis Updates, | Like, Share and Comment Your thoughts

DYDX LONGPrice has completed AB=CD pattern
If it doesn't miss the current price floor, it looks like the beginning of an uptrend has started .
Stay tuned for more updates.

400% growth DYDX price is real, but there are several conditionsThe DYDXUSDT price is starting to show "signs" that buyers are trying to push it off the bottom.
The downtrend has been going on for exactly a year, at the beginning of last October the price high was set around $28 for DYDX, and the low was $1 on June 22.
At the moment, the medium-term target for the growth of the DYDX price is in the range of 6-7 dollars.
- But before that, DYDX buyers need to break through the red downtrend line and fix the price above $1.70
- The next important stage that buyers and enthusiasts of DYDX will need to overcome is to break through and consolidate the price above $3. It will be difficult and at the same time very important, because $3 was the starting point of DYDX trading and this is a kind of psychological breakthrough and belief that the price can grow again.
- Only after these two conditions are met, it will be easier and more encouraging to think and believe in growth to $6-7 for DYDXUSD.
_____________________
Did you like our analysis? Leave a comment, like, and follow to get more

DYDX - DYDXUSDT #DYDX $DYDX #BTC $BTC
- BAT Pattern 🦇
- Daily Frame
# 🎧
#This is my technical opinion and not a recommendation to buy or sell

$DYDX - Bulls breaking FALLING WEDGEHello my Fellow TraderZ,
Few days ago I made an analysis on $DYDX ranging inside Descending Channel Pattern on 4 HTF.
Although price gave a Fakeout and create a Double Bottom and again came back inside the channel and breaking upward of the channel.
BULLISH DIVERGENCE is still valid + Price is trying to come above the EMA 55 on 4 HTF + Breakout Volume is Pretty good enough.
Also look on DTF, #DYDX is forming a FALLING WEDGE Pattern which is generally Bullish in nature. For strong confirmation look for the daily close above the Wedge and the Resistance area of $1.30.
TP 1 : $1.41
TP2 : $1.52
SL : according to your own R:R
Note : never underestimate #BITCOIN which could ruin the Party.
Happy Trading Fam. CHEERS!!!
