#DYM/USDT#DYM
The price is moving within a descending channel on the 1-hour frame and is expected to continue lower.
We have a trend to stabilize below the 100 moving average once again.
We have a downtrend on the RSI indicator, supporting the upward trend with a break above it.
We have a support area at the upper limit of the channel at 0.330.
Entry price: 0.328
First target: 0.325
Second target: 0.317
Third target: 0.310
DYMUSD

#DYM/USDT#DYM
The price is moving within a descending channel on the 1-hour frame, adhering well to it, and is on its way to breaking it strongly upwards and retesting it.
We are seeing a bounce from the lower boundary of the descending channel, which is support at 0.350.
We have a downtrend on the RSI indicator that is about to break and retest, which supports the upward trend.
We are looking for stability above the 100 moving average.
Entry price: 0.365
First target: 0.376
Second target: 0.385
Third target: 0.397

#DYM/USDT#DYM
The price is moving within a descending channel on the 1-hour frame, adhering well to it, and is on its way to breaking it strongly upwards and retesting it.
We are seeing a bounce from the lower boundary of the descending channel, this support at 0.380.
We have a downtrend on the RSI indicator that is about to break and retest, supporting the upward trend.
We are looking for stability above the 100 moving average.
Entry price: 0.400
First target: 0.422
Second target: 0.450
Third target: 0.493

#DYM/USDT#DYM
The price is moving in a descending channel on the 1-hour frame and is adhering to it well and is heading to break it strongly upwards and retest it
We have a bounce from the lower limit of the descending channel, this support is at a price of 0.330
We have a downtrend on the RSI indicator that is about to break and retest, which supports the rise
We have a trend to stabilize above the moving average 100
Entry price 0.343
First target 0.369
Second target 0.392
Third target 0.418

looks DYM is bearish in the medium term (12H)We had a downward move, followed by a pause, and then the price is continuing to decline. When the bottom of the green box at $0.963 is broken with a daily candle, we will have further confirmation.
These fractals can be labeled as ABC waves.
However, for those looking for sell/short positions, the red box can be a potential zone to consider. The closing of a daily candle above the invalidation level will invalidate this analysis.
For risk management, please don't forget stop loss and capital management
Comment if you have any questions
Thank You

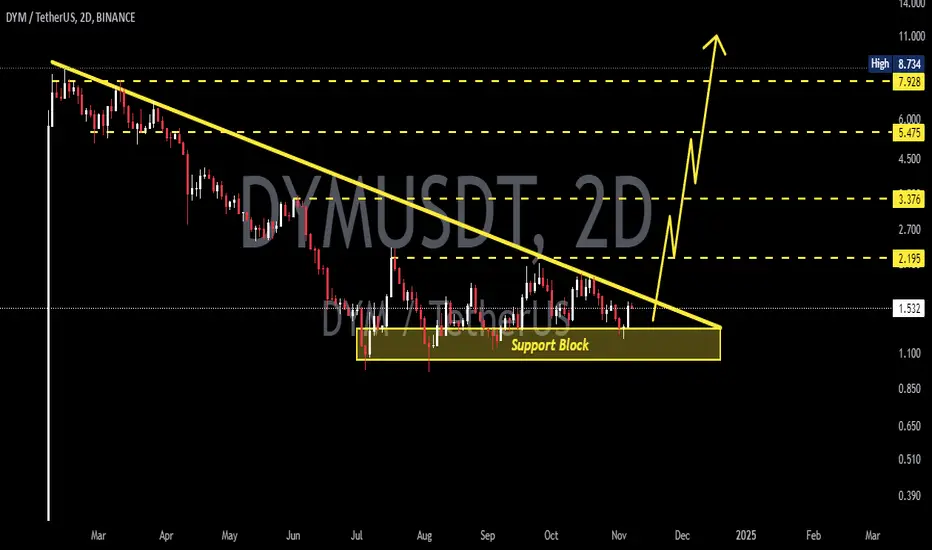
DYMUSDT 2DDYM ~ 2D
#DYM retest this support block,. This is an important support block on this coin. If you still have Conviction on the coin,. Buy in stages from here with a minimum target of 20%+

#DYM (SPOT) IN ( 1.250- 1.450) T. (4.600) SL(1.215)BINANCE:DYMUSDT
#DYM / USDT
Entry ( 1.250- 1.450)
SL 1D close below 1.215
T1 1.900
T2 2.480
T3 3.100
T4 3.800
T5 4.600
2 Extra Targets(optional) in chart, if you like to continue in the trade with making stoploss very high.
______________________________________________________________
Golden Advices.
********************
* collect the coin slowly in the entry range.
* Please calculate your losses before the entry.
* Do not enter any trade you find it not suitable for you.
* No FOMO - No Rush , it is a long journey.
Useful Tags.
****************
My total posts
www.tradingview.com
1Million Journey
www.tradingview.com
www.tradingview.com
Related trades
**********************************************************************************************
#Manta #OMNI #DYM #AI #IO #XAI #ACE #NFP #RAD #WLD #ORDI #BLUR #SUI #VOXEL #AEVO #VITE #APE #RDNT #FLUX #NMR #VANRY #TRB #HBAR #DGB #XEC #ERN #ALT #IO #ACA #HIVE #ASTR #ARDR #PIXEL #LTO #AERGO #SCRT #ATA #HOOK #FLOW #KSM #HFT #MINA #DATA #SC #JOE #RDNT #IQ #CFX #BICO #CTSI #KMD #FXS #DEGO #FORTH #AST #PORTAL #CYBER #RIF #ENJ #ZIL #APT #GALA #STEEM #ONE #LINK #NTRN #COTI #RENDER #ICX #IMX #ALICE #PYR #PORTAL #GRT #GMT #IDEX #NEAR #ICP #ETH #QTUM #VET #QNT #API3 #BURGER #MOVR #SKL #BAND #ETHFI #SAND #IOTX #T #GTC #PDA #GMX #REZ #DUSK #BNX #SPELL #POWR #JOE #TIA #TFUEL

#DYM/USDT#DYM
The price is moving in a descending channel on the 1-hour frame and is expected to continue upwards
We have a trend to stabilize above the moving average 100 again
We have a descending trend on the RSI indicator that supports the rise by breaking it upwards
We have a support area at the lower limit of the channel at a price of 1.38
Entry price 1.38
First target 1.42
Second target 1.45
Third target 1.49

#DYM/USDT#DYM
The price is moving in a descending channel on a 1-day frame and is sticking to it to a large extent and is expected to break it upwards
We have a bounce from the lower limit of the channel at a price of 1.00
We have an upward trend on the RSI indicator, which supports the rise
We have a trend to stabilize above the moving average 100
Entry price 1.40
First target 1.87
Second target 2.52
Third target 3.00

DYMUSDT Forms Triangle Pattern!DYMUSDT Technical analysis update
DYMUSDT has been trading within a triangle formation for the past 165 days. The price is now moving towards the triangle's resistance level, potentially signaling a breakout. The profile volume indicates strong support at $1.40, and the price has crossed above the 100 EMA on the daily chart. A strong bullish move can be expected from the current level.
Buy zone : Below $1.70
Stop loss : $1.37
Take Profit 1: $1.97
Take Profit 2: $2.47
Take Profit 3: $3.45

DYMUSDTDYM ~ 2D
#DYM Entering the accumulation zone. selling pressure began to weaken and showed indications of accumulation by large players.
If you have Conviction on the coin. Make buy from here, with a minimum target of 20%++
#DYM , $DYM , #DYMUSDT , #DYMUSD#DYM ...... is in a very nice entry point and near stop loss to get high profit
#DYM
ASX:DYM
#DYMUSDT
#DYMUSD
#swingtrade
#shortterminvestment
#ALTCOIN
#Cryptotading
#cryptoinvesting
#investment
##trading
#cryptocurrencytrading
#bitcoininvestments
#Investing_Coins
#Investingcoins
#Crypto_investing
#Cryptoinvesting
#bitcoin
#BTC
#BTCUSDT
BINANCE:DYMUSDT

DYM - A Strong reversal is in-progress#INJ/USDT #Analysis
Description
---------------------------------------------------------------
+ After recent downtrend price has formed a strong double bottom pattern
+ We are seeing a strong reversal and price is expected to breakout from the resistance
---------------------------------------------------------------
VectorAlgo Trade Details
------------------------------
Entry Price: 1.656
Stop Loss: 1.129
------------------------------
Target 1: 2.035
Target 2: 2.568
Target 3: 3.240
Target 4: 4.175
Target 5: 5.997
------------------------------
Timeframe: 1D
Capital Risk: 1-2% of trading amount
Leverage: 5-10x
---------------------------------------------------------------
Enhance, Trade, Grow
---------------------------------------------------------------
Feel free to share your thoughts and insights.
Don't forget to like and follow us for more trading ideas and discussions.
Best Regards,
VectorAlgo

DYMUSDT Broadening Wedge!DYMUSDT (Day Chart) Technical analysis update
ASX:DYM price has been trading within a broadening wedge pattern for the last 180 days and is now moving towards the wedge's resistance for a potential breakout. If the price breaks this resistance, we can expect a strong bullish move in DYM.
Entry: After breakout confirmation on the daily chart.

DYMUSDT 4HDYM ~ 4H
#DYM Make purchases gradually within this support block, with a short-term target of at least 10%++

#DYM/USDT#DYM
The price is moving within a bearish trend channel that was broken to the upside on a 12-hour frame
We have a support area at 2.50 and we bounced from it at the lower border of the channel
We have a tendency to stabilize above the Moving Average 100
We have an upward trend on the RSI indicator that supports the rise and gives greater momentum
Entry price 2.72
First target 3.74
The second goal is 4.30
Third goal 4.92

Trade Idea for Dymension (DYM) - Accumulation Strategy Dymension (DYM) is currently trading around $3.07. The token has seen a 6.67% increase in the last 24 hours, with a market cap of approximately $448.06 million and a circulating supply of 146 million DYM tokens.
Start building a position at the current price of around $3.07. This provides a strategic entry point given the recent price appreciation and trading volume.
Plan to accumulate additional DYM tokens if the price drops to $1.60 and further to $2.20. This approach allows for averaging down the entry price and taking advantage of potential market corrections.
Set take-profit targets at $5.50, $7.00, and $8.00. These levels are based on potential resistance points and historical price movements, aiming to capture significant gains as the market appreciates.
Dymension is designed to support Layer 2 networks known as rollups, which enhance scalability and efficiency. The platform leverages the Inter-Blockchain Communication (IBC) protocol for secure communication between different chains, making it a significant player in the modular blockchain space.
The recent price increase and substantial trading volume suggest growing investor interest. Monitoring ongoing developments and updates within the Dymension ecosystem will be crucial for adjusting the investment strategy.
Accumulating DYM at strategic price points leverages market volatility and the project's innovative approach to blockchain scalability. The phased profit-taking strategy aims to optimize returns while managing risk.
This trade idea is based on current market data and Dymension’s strategic positioning as of May 2024. Cryptocurrency investments carry inherent risks, including the loss of principal. Investors should conduct their own research and consider their financial circumstances and risk appetite before engaging in cryptocurrency trading. This analysis is not financial advice.

[DYMUSDT] - looks like a bottom!in 12h chart there is a descending channel pattern
price now reach the lower side of descending channel
targets is 10$ keep it in ur watch list👀
thanks and for more ideas like that hit "like" and "follow"🎯

DYMUSD 12HDYM ~ 12H 📈
#DYM Make purchases gradually after successfully breaking through this resistance line, with a minimum target of 15%+ 📈


DYM target 7.54h time frame
-
DYM broke the downtrend line with a double bottom structure. Currently, DYM is retesting the neckline of this double bottom, this support works well so far. Furthermore, there are two ways to set up targets, the first one is set from double bottom, that is 7.5, the second one could be estimated through Fibonacci Extension, which is around 8.3~8.7.
-
TP: 7.5 / 8.5
SL: 5.9

DYM BREAKING OUT DESCENDING PENNANT CHANNELDYM is silently on the verge of breakout in 4h timeframe and might soon catch the momentum.
BUY ZONE 5.80 - 6.30
TARGETS 7, 7.50, 8.00, 10.00
STOPLOSS 5.00
(THIS IS SPOT CALL & MAY BE USED IN LEVERAGED TRADING WHEN LOW LEVERAGE IS USED)

DYM CRAB PATTERN ( BULLISH )I've identified a compelling bullish Crab pattern forming in the DYM USDT coin. This pattern suggests a potential short-term target of 22%, indicating a promising opportunity for traders.
The precision of this pattern offers a clear entry point and a defined target, making it an attractive proposition for short-term gains. As the market evolves, monitoring the price action closely will be key to capitalizing on this opportunity.
Stay vigilant and prepared to act as the pattern unfolds. With disciplined execution, we aim to leverage this bullish formation to achieve our target gains efficiently.
