#DYM/USDT#DYM
The price is moving within a descending channel on the 1-hour frame, adhering well to it, and is on its way to breaking it strongly upwards and retesting it.
We are seeing a rebound from the lower boundary of the descending channel, which is support at 1.76.
We have a downtrend on the RSI indicator that is about to break and retest, supporting the upward trend.
We are looking for stability above the 100 moving average.
Entry price: 0.276
First target: 0.288
Second target: 0.303
Third target: 0.318
Dymusdtsignal

DYMUSDT 1D AnalysisDYM ~ 1D Analysis
#DYM Buy back when testing this support with a short -term target of at least 10%+ from here.

#DYMUSDT is showing signs of growth📉 Long BYBIT:DYMUSDT.P от $0,4575
🛡 Stop loss $0,4350
🕒 1H Timeframe
⚡️ Overview:
➡️ The main POC (Point of Control) is at 0,4149, indicating the area with the highest trading volume.
➡️ The 0,4572 level acts as a local support, as the price previously bounced from this zone.
🎯 TP Targets:
💎 TP 1: $0,4720
💎 TP 2: $0,4850
💎 TP 2: $0,4970
📢 Monitor key levels before entering the trade!
📢 If 0,4572 is broken downward, the trade may be invalidated.
BYBIT:DYMUSDT.P is showing signs of growth — expecting further upside movement!

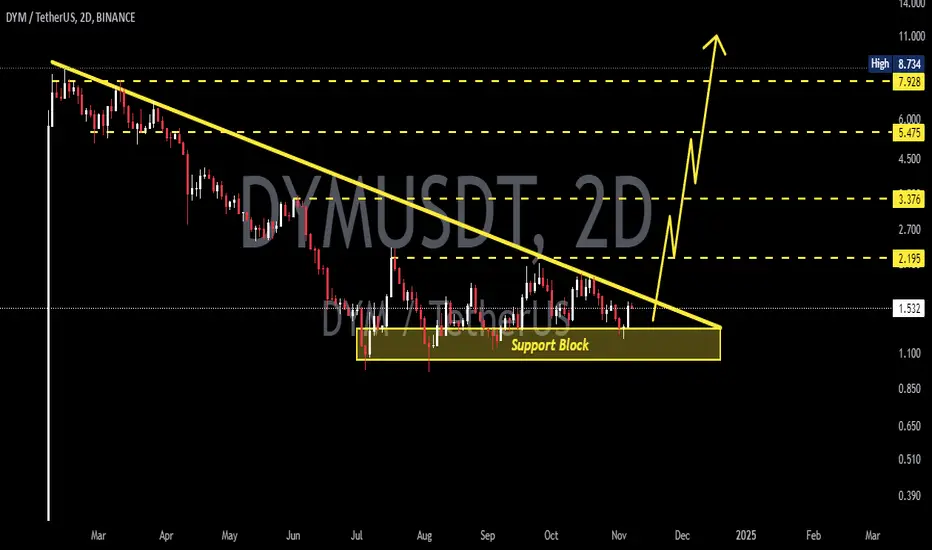
DYMUSDT 2DDYM ~ 2D
#DYM retest this support block,. This is an important support block on this coin. If you still have Conviction on the coin,. Buy in stages from here with a minimum target of 20%+

DYMUSDT A Bearish Shift in Play? Key Level to Watch.Yello, Paradisers! Is #DYMUSDT gearing up for a bigger move, or could we see a deeper dip? Here's what we need to watch closely:
💎#DYM has confirmed a bearish reversal after breaking below the support trendline and losing its previous higher low structure. This shift signals potential bearish momentum, especially as the price gears up to test the supply zone between $1.38 - $1.50. If the price faces rejection here, it strengthens the case for a continuation of the downward movement, aiming for the first target at the demand zone.
💎Should we see a rebound in this area, it might indicate a temporary pause. However, if the price manages to reclaim and hold above the supply zone, there's a higher probability of reaching the final take-profit target at the major support level.
💎If DYM closes above the resistance, it would signal a potential return to bullish momentum, rendering any short positions invalid.
Trade smart, stay vigilant, and remember – patience and discipline always win the day.
MyCryptoParadise
iFeel the success🌴

DYMUSDT Forms Triangle Pattern!DYMUSDT Technical analysis update
DYMUSDT has been trading within a triangle formation for the past 165 days. The price is now moving towards the triangle's resistance level, potentially signaling a breakout. The profile volume indicates strong support at $1.40, and the price has crossed above the 100 EMA on the daily chart. A strong bullish move can be expected from the current level.
Buy zone : Below $1.70
Stop loss : $1.37
Take Profit 1: $1.97
Take Profit 2: $2.47
Take Profit 3: $3.45

DYMUSDTDYM ~ 2D
#DYM Entering the accumulation zone. selling pressure began to weaken and showed indications of accumulation by large players.
If you have Conviction on the coin. Make buy from here, with a minimum target of 20%++
DYMUSDT Broadening Wedge!DYMUSDT (Day Chart) Technical analysis update
ASX:DYM price has been trading within a broadening wedge pattern for the last 180 days and is now moving towards the wedge's resistance for a potential breakout. If the price breaks this resistance, we can expect a strong bullish move in DYM.
Entry: After breakout confirmation on the daily chart.

DYMUSDT 4HDYM ~ 4H
#DYM Make purchases gradually within this support block, with a short-term target of at least 10%++

#DYM/USDT TREAD SETUP#DYM / USDT TREAD SETUP
In the 4-hour time frame, DYM has broken out of this falling wedge pattern and is currently bouncing after retesting this pattern. we can also see bullish divergences in the RSI.
Entry: Current Market Price (CMP) and add more up to $3.22
Target: According to the pattern, we can expect up to a 70% to 100% bounce in the price.
SL- $2.9
Remember to do your own research.
NFA
#Crypto

DYM/USDT It need to bounce to continue upward movement!💎 Paradisers, #DYM has recently experienced notable market dynamics. Currently resting on the support area, #DYM requires a bounce to potentially resume its upward trajectory and retest the resistance trendline area.
💎 Previously, #DYM faced rejection at the resistance area, underscoring its significance. However, if #DYM manages to successfully break above the resistance trendline, it could signal a bullish momentum shift, paving the way for further upward movement towards our target.
💎 Conversely, if #DYM fails to bounce and breaks down below the key support level, it could indicate weakness and a bearish sentiment. In such a scenario, the price may continue to decline further.
