CVS breached channel top; buy the pullbackCVS has been on a monster run, and today it breached the top of its long-term downward trending parallel channel. CVS is overbought, so it will probably pull back before moving higher, but the channel breach is a bullish signal that strongly suggests the downtrend is over. I expect CVS to see 100 within a year or two.
E-retail

Foot Locker an undervalued stock with earnings growthFoot Locker's earnings outlook has been improving in the last six months. Analysts have gone from expecting earnings to decline year-over-year to now expecting substantial earnings growth in 2020 and 2021. That means that Foot Locker's low valuation, with a P/E of just 8.3, should start to head back north toward the 10-20 range. Unless the earnings outlook turns negative again, I think FL's share price should hit $55 in the next year or two. Plus, with a 4% dividend, you get a nice yield on your investment.

VIPS run should continue after pullback from overboughtChinese retailer VIPS has been on a massive run lately, and is now pulling back from overbought on the weekly. The stock has formed two upward trend lines, one steeper than the other. We may break the steepest trend line and bounce from the secondary one. VIPS started 2019 at a low valuation, and over the course of the year has seen a roughly 100% increase in its earnings forecast. The share price has risen accordingly, but the stock remains significantly undervalued according to S&P Global Intelligence, with a valuation rating of 86/100.
VIPS has posted huge earnings beats on its last five earnings reports. The company next reports earnings on February 18, 2020. Judging from the current earnings forecast, I judge that the share price is likely to hit $30 per share by 2021. The stock has a 9.5/10 analyst summary score and fairly bullish options volume even after the huge run it's been on.

XRT - Ascending Triangle BreakoutThe SPDR S&P Retail ETF closed above the resistance line yesterday but is seeing continuation of that breakout early in today's session. A close above the previous resistance line would confirm the breakout but a price above $45.70 would be better as price has rejected from there a couple of times prior.

Likely continued upside in Matas during next weeks (and years)Matas might be about to break its down trend if it can move up through the top of the down trend channel at 63 DKK during the next few weeks. If it can, the next price target would be the top of the trading range 76 DKK. A further break through 76 DKK would indicate a new strong up trend.

High Basing Pattern as Wal-Mart Takes Market ShareIt's hard to say which traditional big-box is doing a better job adapting to the digital age: Wal-Mart Stores or Target . Both have successfully used online strategies to keep shoppers in their brick-and-mortar locations. That's helped avoid the kind of painful downsizing sweeping other retailers.
It's paid off recently for WMT, which beat profit estimates all four quarters in 2019. The shares got a little ahead of themselves the last time it reported on November 14, resulting in five weeks of consolidation.
During that time WMT formed a high basing pattern, or a very tight cup-and-handle. The December low of $117.42 was just slightly higher than the late-October low of $116.83. Plus, it held the 50-day SMA.
Fundamentals in WMT also remain healthy, with observers seeing the potential for its online grocery push to keep driving market share.
In conclusion, few people view WMT as a "growth" stock. But it's starting to act like one. And now it has a cup-and-handle, the classic growth-stock pattern from William O'Neill's classic How to Make Money in Stocks .
NASDAQ:AMZN

Amazon in a long level, up to $1850 then $2000?Amazon drops into a key support level where it rotated a few times right at $1745 now its showing signs of strength and volume is starting to increase. It's been in a strong range for 4 months now and it looks like its about to break above. As long as retail numbers don't disappoint in the next few months we'll hit the first target at $1845-1850 and then into $1900. We need to see price break above the year to date POC and hold it as support. Volume on the move higher is really important as well.
Disclaimer: This idea is for educational purposes only, this does not constitute trading or investment advice. TRADEPRO Academy is not responsible for any market activity.

Possible bounce levels on ZumiezZumiez reported better-than-expected earnings, and as a result, analysts have been revising the earnings outlook upward. I'm targeting about $37 per share for my exit based on the current earnings forecast. Zumiez rocketed after the earnings announcement, but has been dropping since. I've identified four possible bounce levels; we're already at the first. Scale in at the support lines or watch for a trend line breach to confirm a bounce.

LONG BBBY 13.85 - 13.00 - 12.50Looking for a drop on BBBY to take it long. Trending up and entering on the different support levels combined with fib retracements.
The stock has a potential fundamental upside with mayor company turnaround in play. Looking for a good entry point because seeing this stock
at 20.00 in the next 2-4 months is not a long shot. Maybe sooner. If it goes below 12.50 I will be out and re-enter at a better level.
Safe trading.

Kroger Bull Flag Wedge BreakoutPretty simple pattern and meta-pattern. Bull flag should break to 34, and the wedge breakout should carry it to the 40's.
T1: 34
T2: 40

Possible Pre ER Gapfill on KSS/KohlsKohls has earning pre market Tuesdays,
We are currently sitting at resistance,I think if the market drops a little bit on Mondays, I would buy KSS up play it for a quick run up and sell before ER.
I think it has potential to gap-fill to $62.5.
However if it drops after ER, i would buy the dip around $52 for a run up again.

Long AudJpy (11/18) Liquidity gaps "Liquidity gaps" have been proving themselves over and over. Everytime there is a decent sized movement, price always seems to "fill in" or trade through those spots again. I've highlighted two spots in light yellow. (A third was a maybe).
It looks like price is likely going to trade in to these "gaps" , I've highlighted. These are concepts learned from ICT.
Also, I watched price fill the Weekly open last night and have noted this for a possible trading opp in the future. Any tips on Weekly opening gaps welcomed.
In a small position long with a short term target and a longer term target.

The Secrets to Forex & Why You're the Wrong Type of Loser (pt.1)This is a 'many-part' educational series to help turn smooth brains into folded brains. The series reveals the true power of the social and psychological factors shaping markets. This is abstracted from 7,000 hours of research in markets and finance and is a synthesized thesis between my research, John Boyd's work on strategy and adaptability, and David Bohm's theories on emergent behavior. The endstate for the reader will be vastly improved risk management, and novel methods for reducing uncertainty.
Part 1: Why 85%+ of Retail Traders are the Wrong Type of Loser
The true holy grail of markets.. the risk-free rate of return asset, doesn't exist (even perpetuity coupons aren't risk-free). Risk or uncertainty permeates all aspects of our reality. Managing risk is a fundamental component of all business, law, politics, military affairs, sports, etc. It is essential to any form of competition (which markets are). Virtually every element of any strategy employed anywhere involves risk management. It's more than just money... its everything; your relationships, your happiness, your experiences. Your ability to manage risk and uncertainty will positively correlate to your future quality of life.
Why?
Because we can't see the future, but we live into the future. Thus, no matter your wealth or political power, uncertainty is still your master. Fear of uncertainty drives your psychology, the psychology of other individuals, organizations, and even nations. And what these entities do, affect you. Even at subconscious levels. Those that fight uncertainty, do so at varying levels of competence. In the world of derivatives, and for our interests its sub-class: forex, speculation against uncertainty shapes most of the price discovery experience visualized on your favorite candlebar chart. What happens on your chart on higher timeframes is the result of speculation; even those with carry trade positions are still speculating about rates and central bank decisions. The only people who aren't speculating are insider trading, which is illegal. It's illegal to not speculate...
Make no mistake, in the world of speculation, those that fight the best battles, are the ones who fear uncertainty the most and go to the greatest lengths to conquer it. But we already determined that you can't conquer it, you can't see the future. So what does a 'best battle' or 'meeting halfway' even look like in trading?
What do you call a loser that doesn't always lose?
Let me stop for a second.
You're probably thinking: 'this is obvious, no one wants to lose money, everyone is afraid of what they don't know, the future is unknowable, etc'
'How does this help me make money?'
First, you need to understand what you are in this game called Markets.
In this oddly balanced game, those with the most to lose often have the biggest say. And vice versa. You are the vice versa, the retail trader. Retail traders comprise 4 categories that often overlap, ie: people who usually do not have a professional background in investing/trading, or a professionally relevant education, or professional connections as a major client or data access, or a high networth. Your competitors are the opposite (they are all those things and more): the winners, the market makers, the whales, the money printers, the ones with the biggest say, the old money, the 'smart' money, whatever cringy title you want to give them. Commercials/institutions/fund managers/portfolio managers/pension managers/etc.. These guys are speculating about the future, just like you. But their speculation is what shapes price discovery and market movement, YOURS DOES NOT.
This means that whatever you think the market does or should be, DOES NOT MATTER.
Your fibonacci, does not matter.
Your head and shoulders shampoo/pattern, does not matter.
Your sup/res lines, do not matter.
Your moon cycles, do not matter.
Your RSI/MACD cross, does not matter.
The only thing that matters, is what these commercials/institutions think. That's it. If they think that this head and shoulder on the 4h EURUSD matters, then it matters. If they think the moon cycle this month matters, then it matters. If they think communism is good for business, then it matters... etc. It's exactly as irrational as you might think. Now, with their fiduciary responsibilities, they do have to justify their picks. So moon rune interpretation is usually off the table. But guess what. These guys, despite their immense wealth, their research teams stocked with specialists with PhDs, and all the instant access to prime data in the world.. they still lose. They lose all the time, and they lose big. Eye wateringly big. The vast majority are barely winning 60% of the time, if even that... That's why many are offloading into 'less competitive' money-making opportunities; like underwriting, checking accounts, or alternative investments. Competition itself is too much of a risk for their uncertainty appetite. You have to applaud their level of greed.
But to stay on target. Whether your technical system is profitable or not is often a factor of the fitness of your indicators with whatever strategy the commercial is using to execute entry implementation (or combination of models or commercial strategies). And when a few of their models/strategies are losing, it makes it even harder to win at this game (or in those instances, your system might win, whilst you rejoice at the amazing ability of your moon cycles to predict the future).
But let's back this up, did some of you notice something off? 60%~ ... That's actually not bad. A trader who's experienced at losing (and yet making a profit in the long run) would kill for an average position win rate like that. Instead of thinking, "how do I avoid losers entirely" Stop wasting whatever brainpower you have. Start thinking, "how do I minimize my losers?" The losing positions are always going to happen, no matter your system. All edges fade, and even a mythical system that won 90% of the time will weaken over months or years. But if you learn to master the art of 'losing,' the overall win rate of your positions can AFFORD to be low. In many cases, it could even be less than 50%, and you could still make a living as a trader/investor. The best and brightest, the commercials and institutions, are barely going 60%. What makes you think you can do better?
Does it mean all hope is lost?
Not even close. It simply means that you need to focus less on your directional/positional bias strategy (the winrate), and more on your risk management strategy. You have to become the right type of retail trading loser, the 15%~ or so that retail brokers survey as profitable. These guys are losing 40%, 50%, 60%, even 70% of the time, and some of the them are still making big money. It's counter-intuitive but they are the guys winning at losing, and turning that into a living. Your ability to survive losers.. to adapt to uncertainty , is the first secret and the most important step into the weird world of profitable derivative trading.
Okay, so you might be thinking: "Again, obvious. Isn't that just 2%? Isn't that just low margin? Only trade Majors? 100 pip SL?"
If those were the first things you thought, then we still have a very long way to go. Fortunately, this is just the introduction.
See you next week for part 2: 'time as the dominant parameter, fair value, and the 'center of gravity.

Party City - Stop, He's Already Dead!Party City has become a perfect example of going quietly into the night. Despite the immense amount of trouble the company is in, and their constant and predictable death spiral, the lack of volume goes to show that the market hasn't noticed Party City on death's doorstep.
- Helium supplies being limited means that medical tech companies receive first dibs, leaving retailers like Party City scrambling to find a way to stay afloat (pun intended).
- Financial stress from the retail apocalypse and having Amazon as a competitor left the company far too weak to incur a financial trip-up such as the helium shortage.
- Short interest of 39% made stock buyback attempts laughable and gave little leeway against the consistent downward spiral.
- Irregular price boosts leave short sellers with plenty of opportunity to swing trade, with just enough volume on the options chain to make a consistent profit.
- Long term bears will flourish on the upcoming earnings report in November, which will only further reiterate what the market has seemed to ignore among trade war fears and index volatility trades.
Current price? $5.00 a share. My personal price target? $2.00 by Halloween.

Moving averages, levels, reversal candles: Nike has them allCheck out the pullback in Nike (NKE)! The DJIA member broke out to new highs in September on a strong earnings report. It ran to the high 90s and then stalled and retraced almost the entire move. NKE shares are now back to their $90 breakout zone, which was also resistance in April and July.
On top of that NKE is holding its 50-day moving average and has had several interesting candlesticks recently:
-Oct. 30: Inside day
-Oct. 31: Outside day
-Nov. 5: Inside day
-Nov. 6: Outside day
Those are all potential reversal patterns. When you consider that the short-term trend was bearish after a slide in late October, that would suggest stabilization. Not hugely compelling in isolation, but throw in the $90 support line and 50-day moving average and you have some serious confluence on the chart.
The macro backdrop is also interesting, with the positive Chinese news today. (Remember China is a key growth market for NKE.) Retail sales are next week and company earnings are shortly before Christmas.
Black Friday is still three weeks away. Will the holiday shopping start early in NKE?
NKE

CVS moment of truth is comingCVS has been headed toward the top of its parallel channel. It's currently overbought, so its first test of the channel top may get rejected. However, expect a breakout soon after. CVS is my favorite investment thesis in the entire market right now. The company is opening 1500 HealthHub stores by the end of 2021 and is also completing a merger with Aetna. Its earnings are expected to grow, and the stock is absurdly undervalued. Fair value based on forward P/E for 2021 is something like $95 per share. Even based on this year's P/E, it should be at least $79.
(I base these numbers on the Zack's "Price and Consensus" chart, which is one of my favorite tools for fundamental analysis. We'll do an educational episode on this on the "Wall Street Petting Zoo" Youtube channel next week.)

WMT will break to resistance level; hit new holiday highs!!Looking like Walmart is going to break down to the second resistance into earnings then if it can support at those levels will likely get squeezed to new highs heading into the holiday season.

~10% 3 weeks or less. GPS Earnings run up.After a recent reversal and a history of higher low support GPS is poised to have a 10% run up into earnings. RSI and Stochastic give additional support.
With a very solid P/E of 6.67, it's one of the lowest in the retail clothes sector. With minimal Debt/Equity of 0.34 and a Current Ratio of 1.50
We can even choose to hold through earnings for additional gains and with an attractive dividend of 5.73%.
GPS is more than just Gap. Their Lulu Lemon-esque brand Athleta is expected to have a record year. Old Navy revenue has also been on the rise.

WH Smiths - Travelling towards 2600p?Buy WH Smiths (SMWH.L)
WH Smith PLC is a United Kingdom-based retailer in convenience, books and news for travelling customers. The Company is a high street stationer, bookseller and newsagent. The Company operates through two segments: High Street and Travel. The Company's Travel business sells its products to cater for people on the move or in need of a convenience offer.
Market Cap: £895Million
WH Smith's share price appears to have completed a triple bottom on the move above resistance at 2164p. In recent days the shares have corrected lower to find support at the neckline of the pattern. The projected upside target is at 2436p and beyond that 2604p. The momentum continues to be positive following upbeat results posted on the 17th of October. Higher prices are expected.
Stop: 2130p
Target 1: 2324p
Target 2: 2436p
Target 3: 2600p
Interested in UK Stocks?
Join our free Telegram channel for up to date analysis on the best main market opportunities in the UK right now - t.me

Markets took a break, pound tested 1.30"Markets took a break" the lack of high-profile news and frankly difficult weeks contributed to that yesterday.
GBP has tested 1.30 against the dollar. As we expected unsuccessfully since a successful test requires positive news from Britain. Johnson’s attempt to accelerate the negotiation process did not bring home the bacon. Parliament refused to re-vote on the approval of the agreement. Motivation: the decision was already made on Saturday and it makes no sense to discuss the same thing again.
However, Johnson does not give up trying to take the UK out of the EU on 31 October. We are rather sceptical about this and are waiting for a delay for another 2-3 months. Nevertheless, the general feeling of further leaving hangs in the air, so buying pounds in the daily lows area still seems to us to be a good trading idea. In the end, the growth potential has not yet been exhausted.
Another promising idea, in our opinion, is the sale of the dollar. But recently, we see more and more reasons to start a downward dollar rally: rates in the US are falling, economic indicators are deteriorating, US exporters continue to suffer due to a strong dollar (in the current reporting season, at least 16 leading companies have complained about problems with profit due to for a strong dollar), in addition and do not forget about the structural problems of the US economy (public debt, chronic trade deficit and trillion budget deficit). So we will continue to look for points for selling the dollar in the foreign exchange market.
Canadian retail sales figures are what we are waiting to come out. Especially because the Canadian dollar has recently strengthened in the foreign exchange market. On the one hand, the Canadian dollar may still grow. On the other hand, weak data on the background of a rather strong overbought Canadian dollar may well give a signal for fixing profits and starting correction in pairs with the Canadian dollar. We are closely watching the news.

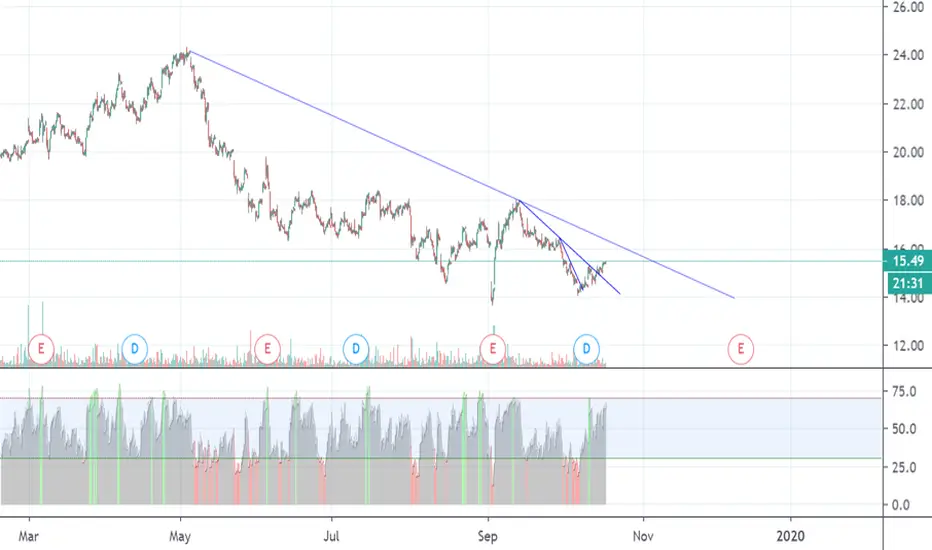
Momentum is changing in American EagleAEO has been in a long-term downtrend. After last earnings it got a nice spike, but then it came back down. Lately its momentum has been changing after two bullish trend line breaks. It's cheap with a current P/E of about 10, and it's had several recent analyst upgrades. I am holding AEO until it gets close to the next trend line. Then I will sell and wait for the trend line break as a signal to re-enter.
Alibaba: Potential rise to the 2019 High.Alibaba is trading inside a very standard 1W Channel Up since June (RSI = 52.639, MACD = 1.760, Highs/Lows = 0.0000) with the Low to High legs symmetrical at +21%. If the current leg is completed on equal strength then the peak (+21%) will reach 195.50 which is the 2019 High. So if the Higher High trend line of the Channel Up breaks, be ready to extend your long positions to 195.50.
** If you like our free content follow our profile (www.tradingview.com) to get more daily ideas. **
Comments and likes are greatly appreciated.

Ebay: Long term Buy Signal.Ebay is coming off a strong rebound last week on the 1D MA200. 1D is again gradually turning bullish (RSI = 50.474, ADX = 33.642, Highs/Lows = 0.3699, CCI = 102.4213) as it approaches the 1D MA50.
What is more interesting is that last time Ebay touched the 1D MA200 after a Golden Cross formation (took place last March) was in 2016/ 2017. The rebound was extended then to a new Higher High. Based on that we have turned bullish again on Ebay targeting 43.00.
** If you like our free content follow our profile (www.tradingview.com) to get more daily ideas. **
Comments and likes are greatly appreciated.
