Novo Nordisk (Revised) | NVO | Long at $47.78**This is a revised analysis from February 5, 2025: I am still in that position, but added significantly more below $50**
Novo Nordisk NYSE:NVO is now trading at valuations before its release of Wegovy and Ozempic... From a technical analysis perspective, it's within my "major crash" simple moving average zone (gray lines). When a company's stock price enters this region (especially large and healthy companies) I always grab shares - either for a temporary future bounce or a long-term hold. While currently trading near $47 a share, I think worst case scenario here in 2025 is near $38-$39. Tariffs may cause a recession in the second half of 2025, so no company would be immune.
As mentioned above, I am still a holder at $86.74. However, I went in much heavier within my "major crash" simple moving average band and have a final entry planned near $38-$38 (if it drops there). My current cost average is near $55.00.
Why do I still have faith in NYSE:NVO ? Because no one else does right now, yet it generated $42 billion in revenue, $14 billion in profits, and has significant cash flow YoY. The company has a massive pipeline, despite Wegovy and Ozempic competition, and I think the market is undervaluing its position in the pharmaceutical industry.
Revised Targets in 2028:
$60.00 (+25.6%)
$70.00 (+46.5%)
$80.00 (+67.4%)
Earnings

KIMLUN - DMI and RSI shows BULLISH SIGNAL KIMLUN - CURRENT PRICE : RM1.31
KIMLUN is in an uptrend for medium term as the price is making higher high and higher low. Supported by positive readings in technical oscillators such as DMI (+DI is above -DI) and RSI (above 50), it increases the bullish scenario. At current price trading near SMA 20, there is possibility for price reach upper band in bollinger bands indicator. Nearest support will be RM1.24 (-5.34%) and 1st target will be RM1.41 (+7.63%).
ENTRY PRICE : RM1.30 - RM1.31
TARGET : RM1.41 and RM1.47
SUPPORT : RM1.24
Notes : On the fundamental side, KIMLUN shows a strong recovery in earnings. For FY2022, company was loss RM7.2 million. Then the company rebounded with a profit of RM7.1 million in FY2023. For FY2024, company registered strong performance of profit RM50.3 million.

Review a Few of our Trades & Update Overall Market PerspectiveIn this video, I review some of the trades taken over the past 1-2 weeks, and discuss in more detail the current technical and geopolitical/macro thesis on AMEX:SPY NASDAQ:QQQ NASDAQ:SQQQ AMEX:SOXS , and the overall market. Exciting times, and ripe with opportunity to *potentially* BTD (again).

charge fees on patentsTrump's decision to charge fees on patents exposes IDCC shares to long-term decline

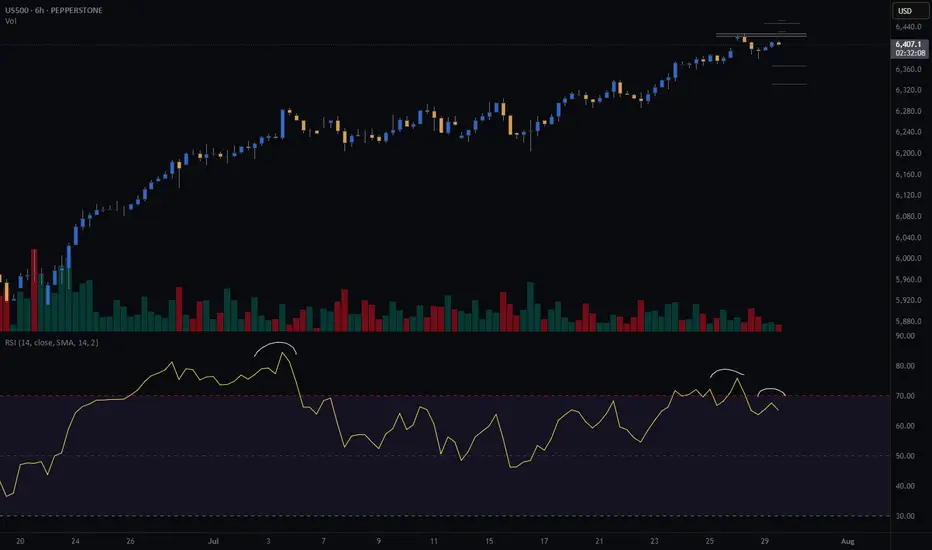
S&P500 (CASH500) SHORT - Double top H6Risk/reward = 3.7
Entry price = 6432.6
Stop loss price = 6 454.1
Take profit level 1 (50%) = 6367.7
Take profit level 2 (50%) = 6332.6
Still need confirmation from some variables before entering the trade
BA: Boeing down on better than expected results! 30-07-2025Yesterday we get Boeing earnings report which came better than expected, but the stock down more than 4% as the company is not expected to make positive profit or free cashflow before 2026. No dividends currently paid, so there is nothing attractive to me now.
Disclaimer: This content is NOT a financial advise, it is for educational purpose only.

Olin Corporation | OLIN | Long at $21.81Olin Corp NYSE:OLN is currently trading within my "crash" simple moving average area (green lines on the chart). Historically, the price trades within this area for the company, consolidates, and then moves up. After today's earnings, which were relatively positive, the stock may gain some traction and move up. However, I am cautious a media-heightened economic downturn could send NYSE:OLN (a global manufacturer of chemical products and ammunition) to $13 to close the existing price gaps on the daily chart. Regardless, it's a strong company that has been trading on the US stock exchange since the mid-1970s - it's seen rough times before. While 2025 is likely to be a tough year, future earnings projections predict robust earnings growth. Time will tell...
Thus, at $21.81, NYSE:OLN is in a personal buy-zone with noted caution if there is an economic downturn down to $13 a share. The price gap around $19 may also be closed in the near-term.
Targets into 2028:
$28.00 (+28.4%)
$31.50 (+44.4%)

INTC: Intel turnaround will take timeAs we have Intel earnings report released on Thursday, it miss on on EPS, but beat on revenue.
as Intel lag the industry, we still waiting some confirmations of positive turnaround, once we get it, we may get it long from this competitive level since P/B below $1.
Disclaimer: This content is NOT a financial advise, it is for educational purpose only.

DOW: Dow Inc. cut its dividends in half !High dividends no longer !
I was waiting the stock to reach the support level to benefit from the 10% high dividends yield... but the company cuts its dividends yield from 10% to 5%, so it is no longer valid to me.
Disclaimer: This content is NOT a financial advise, it is for educational purpose only.

#QS - 4HR [Will the last boost last or will it bust? With a new Volkswagen investment and partnership. Quantum Scape’s earnings were far from stellar with a 26% decrease in income compared to same time last year. They have, nevertheless, made advancements with their very promising lithium-Metal battery technology.
With fundamentals aside, I am curious to gauge how long-term investors have priced-in the company's stock price.
Technically, I see price moving to present yet another opportunity by EOY if not sooner. My count shows important levels to watch.
Go #QuantumScape, Go!!!
Check out my other chart ideas @CaxhPrince everywhere.

Titanwhale: XRP as a Bridge Currency Ushers in a New EraAs global financial markets rapidly digitize, the need for instant, low-cost, and scalable cross-border payments is becoming more urgent. One of the key contenders redefining the cross-border payments landscape is XRP, the digital asset developed by Ripple Labs. It is increasingly recognized as a bridge currency capable of transforming international settlements.
According to analysts at Titanwhale, XRP offers a fundamentally different liquidity model—allowing institutions to bypass legacy correspondent banking networks and eliminate the inefficiencies of currency conversion and settlement delays.
XRP as Financial Infrastructure
Instead of converting fiat currencies directly—which requires liquidity and multiple intermediaries—banks and payment providers can leverage XRP as a neutral bridge asset. This model, known as On-Demand Liquidity (ODL), is already live in several key corridors, including the U.S.–Mexico, Japan–Philippines, and Europe–Southeast Asia.
Internal research from Titanwhale shows ODL volumes grew 57% year-over-year, with over $2.8 billion in XRP processed through RippleNet in Q2 alone.
“XRP is solving a real-world liquidity problem that traditional banking has struggled with for decades,” said Mia Chen, Head of Payments Analysis at Titanwhale. “And it’s doing so in real time—without intermediaries.”
Regulatory Clarity Boosts Adoption
The XRP ecosystem also benefited from a major legal milestone in 2023, when a U.S. federal court ruled that XRP is not a security when traded on public exchanges. This ruling lifted a significant cloud of regulatory uncertainty and paved the way for wider institutional participation.
Since the ruling, Ripple has announced CBDC partnerships with central banks, positioning the XRP Ledger as a politically neutral and interoperable infrastructure for next-generation digital currencies.
Titanwhale’s Strategic View
At Titanwhale, XRP is not viewed as a speculative asset, but as a cornerstone of the emerging global payment architecture. Its decentralized structure, instant settlement capability, and scalability make it uniquely suited to serve as a universal bridge asset in a fragmented currency landscape.
With growing institutional engagement and technical maturity, Titanwhale considers XRP a strategic allocation within diversified crypto portfolios over a 3–5 year horizon.

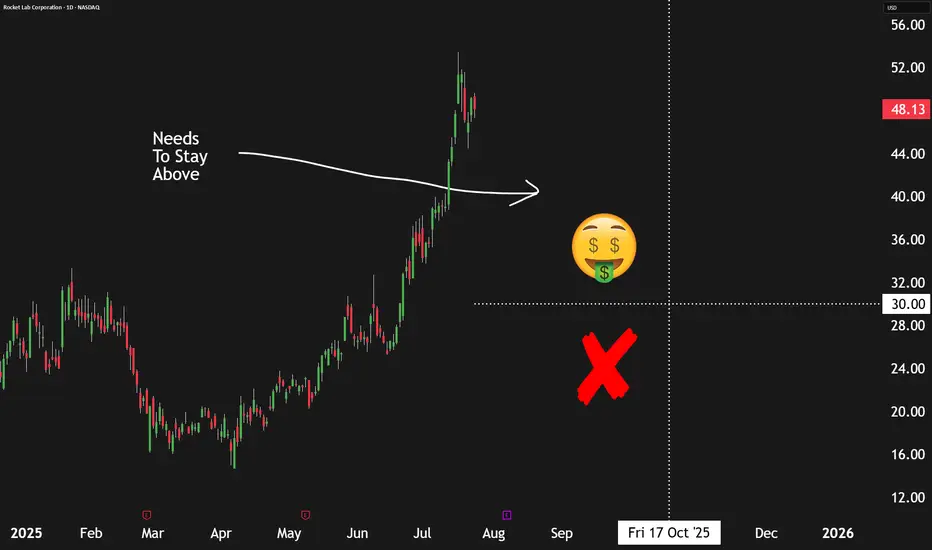
How We're Earning A 13%+ Yield Selling Puts On Rocket LabThe commercial space sector is booming, and Rocket Lab NASDAQ:RKLB stands out as one of the most promising players—not just another speculative startup or space tourism hype. But while the company is making strong operational strides, its stock valuation appears stretched, prompting a more strategic approach to investing.
📈 Strong Execution, Growing Opportunity
Rocket Lab continues to hit meaningful milestones. In Q1, the company:
Secured a U.S. Space Force contract for its upcoming Neutron heavy-lift rocket.
Won hypersonic-related contracts with the U.S. Air Force and the U.K. Ministry of Defense.
Successfully completed five Electron rocket launches and booked eight more.
Made a strategic acquisition for developing "Flatellites," enhancing vertical integration.
Revenue rose 32% year-over-year, with gross margins in the mid-30% range. Importantly, Rocket Lab has a $1 billion+ revenue backlog, with over half expected to convert in the next year, and a healthy mix of government and commercial clients across both its Launch and Space Systems divisions.
💰 Valuation: Big Potential, Bigger Price Tag
Rocket Lab's business is solid, but its valuation raises red flags. With a price-to-sales ratio near 55x (compared to SpaceX's ~14x), investors are paying a steep premium for future success. The company is still unprofitable, and the high valuation leaves little room for error. Simply put, the market may be rewarding Rocket Lab too early.
📊 The Smarter Move: Sell Put Options
Instead of buying shares at inflated levels, the better approach is to sell put options—a strategy that earns upfront cash and offers the opportunity to buy shares at a discount if the stock drops.
Recommended trade:
Sell October 17th $30 strike put options
Premium: ~$96 per contract
Required buying power: ~$2,904
Implied return: ~3.3% over 90 days, or ~13.4% annualized
This provides income now, while still giving investors potential exposure to Rocket Lab at a 40% discount to current prices.
⚠️ Risks to Consider
This isn’t risk-free. If Rocket Lab’s execution falters—especially with Neutron—shares could drop sharply. Selling puts means you may still be forced to buy at $30, even if the stock falls much lower. This strategy works best for investors comfortable owning RKLB long term at a lower entry price.
✅ Bottom Line
Rocket Lab is a strong business, but the stock looks overheated. Selling put options offers a more balanced way to participate in its growth story—earning income now while positioning to buy the stock later at a better value.
Rating: Buy (via options strategy)
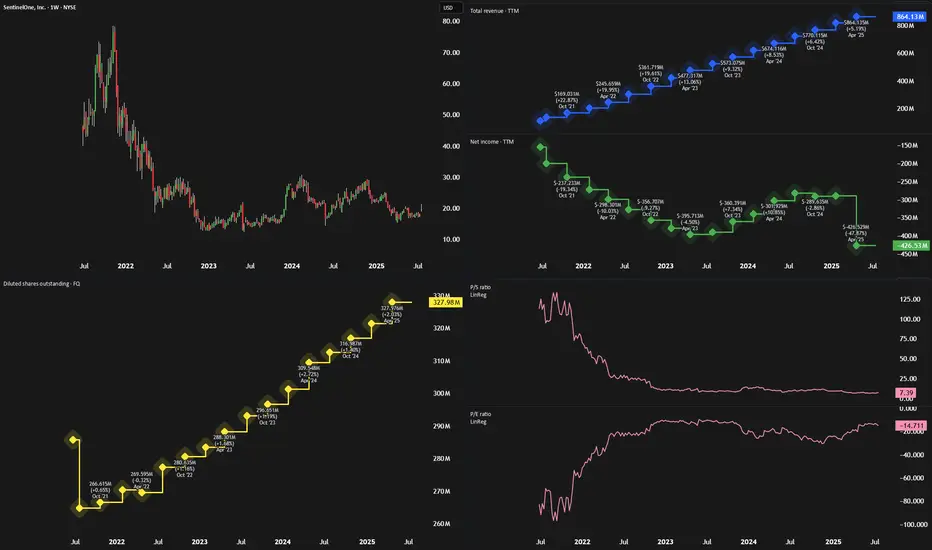
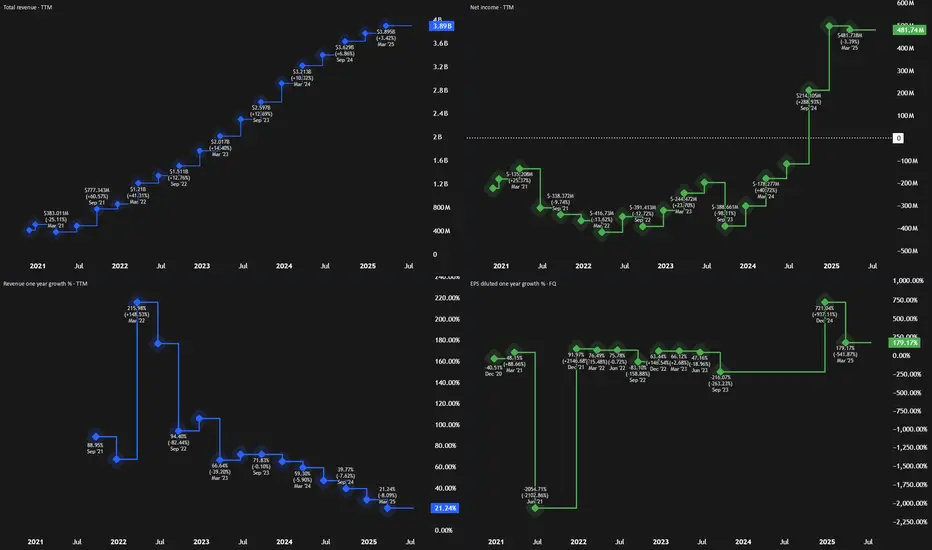
SentinelOne Looks Like Palantir Before The BreakoutIn every market cycle, some high-growth companies are misunderstood—until they aren’t. Palantir (PLTR) was one such stock, dismissed early for its lack of profitability and complex model, only to soar when its AI tools gained traction. Now, SentinelOne (NYSE: S) may be next in line.
🧠 What SentinelOne Does
SentinelOne is a top-tier cybersecurity firm offering an AI-powered endpoint protection platform called Singularity. Like Palantir, SentinelOne has faced criticism for:
Persistent losses
High stock-based compensation (SBC)
A misunderstood business model
Despite this, its technology is sticky, deeply embedded in client IT systems, and well-positioned to ride macro trends in AI and cybersecurity.
📈 Financials: Turning a Corner
While the stock hasn’t moved much in two years, trading around $18, SentinelOne’s fundamentals are improving:
Revenue Growth: Double-digit YoY revenue growth (23%+ in each of the last 10 quarters)
Free Cash Flow: $214 million in the past 12 months (~25% FCF margin)
Gross Margins: High and improving
Operating Expenses: Slowing, creating operating leverage
Adjusted Earnings: Near breakeven, signaling profitability is in reach
These trends mirror Palantir’s path before its breakout, particularly the shift from high OpEx to better margins and rising free cash flow.
💰 Valuation: Still Underrated
SentinelOne is trading at only 6x sales and 27x free cash flow, despite:
Strong 20%+ expected revenue growth
Analyst EPS estimates of ~$0.50 by 2028
A market cap under $6 billion
It’s significantly cheaper than peers like CrowdStrike and Palo Alto Networks—despite having similar growth and margin profiles.
⚠️ Risks to Consider
Fierce Competition: Cybersecurity is a crowded field. SentinelOne will have to keep innovating to stay relevant.
Market Sentiment: As a high-growth name, it may be hit hard in downturns.
Limited TAM vs. PLTR: The cybersecurity market isn’t as vast as AI data platforms.
🚀 Final Take
With strong recurring revenue, improving profitability, and an attractive valuation, SentinelOne looks poised for a re-rating. While it may not match Palantir’s scale or splash, the setup is strikingly similar.
Rating: Strong Buy
Why We See 100%+ Upside In SoFi Over The Next 3 YearsAfter soaring to nearly $28 per share during the SPAC-fueled fintech boom in 2021, SoFi Technologies (SOFI) crashed back to earth, trading under $5 as rising interest rates, regulatory headwinds, and lack of profitability dimmed investor optimism. But the tide has turned.
Over the past year, SoFi has reshaped its business and posted significant growth. Shares are now up 247% since our previous bullish call at $6. With the company now profitable and diversifying revenue, we'd argue there’s still upside ahead.
💼 A Stronger, Diversified Business
SoFi has evolved from a student loan-focused lender into a full-spectrum fintech platform. It now operates across:
Lending: $413M in Q1 revenue
Financial Services (consumer banking): $303M
Technology Platform (B2B): $103M
While lending still makes up the majority, the tech and services segments are growing fast—especially financial services, which doubled revenue YoY and tripled profit. SoFi's white-label platform also gives it a SaaS-like recurring revenue profile.
Q1 results showed:
Revenue: $770M (+33% YoY)
EPS: $0.06, with a $31M revenue beat
This business mix gives SoFi more stability and better scalability than many traditional financial firms.
💰 Valuation: Pricey vs. Banks, Cheap vs. Fintech
Critics point to SoFi’s rich valuation—trading at over 8x sales—as a concern. But when compared to other fintechs like NuBank (12x sales) and Robinhood (28x), SoFi looks much more reasonably priced.
On a forward earnings basis, SoFi trades at ~32x GAAP EPS, and if growth continues, this could drop below 30x. That’s appealing for a company expected to grow:
Revenue: ~25% annually
Net income: ~33% annually
By 2027, analysts project $1B in operating income, double today’s figure. If SoFi maintains current valuation multiples, this alone could double the stock in 3 years.
⚠️ Risks to Watch
Regulatory scrutiny in the financial sector
Cyclicality of consumer lending
Intense competition from firms like Robinhood, Chime, and Coinbase
Despite these challenges, SoFi’s expanding ecosystem and growing brand strength position it well.
✅ Final Take: Still a 'Strong Buy'
With accelerating revenue, expanding margins, and a scalable business model, SoFi has moved beyond its hype-fueled origins and is now a real fintech contender. Even after its rally, its valuation still leaves room for meaningful upside.
Rating: Strong Buy
What the Market Is Telling Us About Altcoin Season in 2025Altcoin season is that highly anticipated market phase where alternative cryptocurrencies outperform Bitcoin and dominate trading activity. As we move through 2025, several key signals suggest we may be entering just such a phase—and investors are paying close attention.
Key Market Indicators
Bitcoin dominance is falling below 50–52%, historically a sign of capital rotation into altcoins.
Trading volumes are spiking in Ethereum, Solana, Chainlink, Toncoin, and others.
Sector-specific excitement is building around Web3, AI tokens, and decentralized physical infrastructure (DePIN).
While this might be just the early stage of the altcoin cycle, the smart money is already positioning.
Investor Considerations
Focus on projects with real fundamentals. Ethereum, Avalanche, Cosmos, and Chainlink remain top infrastructure bets.
Utility is key. Projects with real-world application, strong developer activity, and growing user bases are best positioned for long-term growth.
Track sentiment. Watch for social buzz, news momentum, and open interest increases—often the earliest signs of breakout moves.
Bottom Line
Altcoin season doesn’t happen overnight. What we’re seeing now is the accumulation phase—an ideal time for data-driven investors to build high-upside portfolios. But caution is critical. Not every pump is sustainable, and smart risk management remains non-negotiable.
For those who prepare wisely, the 2025 altcoin season could unlock some of the most lucrative opportunities in the crypto space.

EOY based on yesterday's earnings and the flywheel effect# Alphabet's Accelerating Flywheel: Q2 2025 Earnings Validate the Strategy
technicals grounded in an anchored pitchfork hinged on the pre-covid levels (covid bottom just makes the path too aggressive for EOY) and fib retracements of the 2022 bear market decline. General and simple targets since moving averages aren't providing much clarity. Single stock analysis is even more voodoo than large sector indexes, so I'll focus on fundamentals instead:
## The Flywheel In Action: Q2 2025 Results
Alphabet's blowout Q2 2025 earnings provide concrete evidence that their integrated AI flywheel is already spinning faster. **Revenue grew 14% to $96.4 billion, crushing expectations**, while the company raised its 2025 capital expenditures from $75 billion to **$85 billion**—a bold investment that initially spooked some investors but actually signals the flywheel's acceleration.
### Why the $85 Billion Capex Increase is Strategic Genius
The additional $10 billion isn't just spending—it's **strategic reinvestment in the flywheel's core components**:
**Infrastructure Dominance:** Google Cloud revenue surged 32% to $13.6 billion, now approaching a $50+ billion annual run rate. The capex increase funds the massive data centers and TPU clusters needed to serve exploding AI demand.
**Competitive Validation:** Even OpenAI, Google's biggest AI rival, is now renting Google's TPU chips to power ChatGPT—choosing Google's proprietary hardware over Nvidia GPUs for cost-effective inference. This partnership alone validates the integrated hardware-software advantage.
**Market Leadership:** With AI Overviews reaching 2+ billion users (up from 1.5B last quarter) and Gemini hitting 450+ million users, Google is proving it can deploy AI at unprecedented scale while generating immediate revenue.
## The Core Flywheel System
**The Engine:** World-class AI research (DeepMind, Google AI) creating increasingly capable models that serve as tools for invention, not just products. Gemini's rapid user growth proves the models are competitive.
**The Fuel:** Search and YouTube revenue provides patient capital for long-term moonshots, while diverse data from billions of users continuously improves AI models. Q2's strong advertising performance ($64B+) funds the entire system.
**Custom Hardware Advantage:** Proprietary TPUs optimized for their AI software create faster, more efficient training and inference than competitors using general-purpose chips. OpenAI's adoption proves TPUs offer superior cost-performance.
**The Multiplier:** Quantum computing research that could eventually solve problems impossible for classical computers, creating step-change advantages in materials science and optimization.
## AI Integration Across the Ecosystem: The Ultimate Moat
Alphabet's true competitive advantage lies in **embedding AI across their existing billion-user platforms**, creating compound defensibility:
**Search Dominance:** AI Overviews now appear in 2+ billion monthly searches across 200+ countries, fundamentally changing how users interact with information while maintaining Google's search monopoly. Users increasingly expect AI-powered results, making switching costs even higher.
**Productivity Lock-in:** Gmail's Smart Compose, Google Docs' AI writing assistance, and Sheets' intelligent data analysis create sticky enterprise and consumer habits. Once teams adopt AI-enhanced workflows in Google Workspace, migration becomes exponentially more difficult.
**Developer Ecosystem:** Google's coding tools (Colab, Android Studio) now feature AI pair programming, while languages like Go and Dart benefit from AI-optimized development. This creates a generation of developers trained on Google's AI tools.
**Educational Moat:** Chromebooks in schools now include AI tutoring and personalized learning, creating habits among students who will become tomorrow's decision-makers. Google for Education's AI features make alternative platforms seem primitive.
**Entertainment Integration:** YouTube's AI-powered recommendations, creator tools, and content moderation have become so sophisticated that creators and viewers alike can't imagine the platform without them. This strengthens YouTube's dominance over TikTok and other competitors.
**Mobile and Browser Dominance:** Android and Chrome's AI features (Smart Reply, intelligent autofill, predictive text) create seamless experiences that competitors struggle to match without Google's data advantages.
## Near-Term Flywheel Accelerators
**Physical AI & Robotics:** Moving from digital-only AI to robots that can perceive and manipulate the physical world. Waymo has now driven 100+ million autonomous miles, generating unique physical-world training data.
**AI Biology:** DeepMind's protein folding breakthroughs and Isomorphic Labs' drug discovery pipeline could create massive pharmaceutical revenues while advancing the core AI engine.
**AI Materials Science:** Already discovering thousands of new materials that could dramatically improve batteries, semiconductors, and other hardware across all ventures—feeding back into better TPUs and infrastructure.
## The Compounding Network Effects
**Data Flywheel:** More users → More training data → Better AI models → Better products → More users. AI Overviews now drive 10%+ more queries for the types of searches that show them.
**Revenue Flywheel:** AI success → Higher cloud/advertising revenue → More R&D investment → Better AI → Market expansion. Google Cloud's 32% growth funds continued AI leadership.
**Talent Flywheel:** Best AI infrastructure → Attracts top researchers → Better models → More ambitious projects → Attracts even better talent. The recent $2.4B Windsurf acquisition shows Alphabet winning the talent war.
**Infrastructure Flywheel:** More AI demand → Larger TPU deployments → Better hardware optimization → Lower costs → More competitive offerings → More demand.
**Ecosystem Lock-in:** AI features across Gmail, Docs, YouTube, Search, and Android create switching costs that compound across products. Users don't just leave Google Search—they'd have to abandon their entire digital workflow.
## The Strategic Moat Widens
While competitors excel in individual areas, Alphabet's advantage comes from **deep integration creating compound effects**:
- **Capital Moat:** The $85B capex commitment (13% increase from 2024) exceeds most competitors' total revenues
- **Integration Moat:** OpenAI using Google TPUs despite being competitors proves the hardware-software integration is unmatched
- **Scale Moat:** 2+ billion AI Overview users and $50B+ cloud run rate create network effects competitors can't replicate
- **Ecosystem Moat:** AI embedded across Search, Gmail, YouTube, Android, Chrome, and Workspace creates compounding switching costs
- **Innovation Velocity:** Time from AI research to deployed products at billion-user scale continues compressing
## The Key Insight
The Q2 earnings reveal that Alphabet isn't just building an AI company—**they're building the infrastructure that accelerates invention itself**. Each breakthrough feeds back into the system: new discoveries generate revenue that funds more research, create better tools for the next breakthrough, and attract top talent.
More importantly, they're embedding AI so deeply into users' daily workflows—from Gmail to YouTube to Search—that switching becomes not just inconvenient but practically impossible. When your email, documents, entertainment, and information all work seamlessly together through AI, why would you ever leave?
The $85 billion capex increase signals management's confidence that they're approaching "escape velocity"—where their innovation rate becomes impossible for competitors to match. While others debate AI spending, Alphabet is already demonstrating profitable AI deployment at unprecedented scale while simultaneously investing in the next acceleration phase.
**The Bottom Line:** Alphabet's integrated flywheel of AI research, proprietary hardware, massive data, and patient capital is creating an innovation velocity that competitors are finding increasingly difficult to match. But their true moat is embedding AI so deeply into billions of users' daily habits that the entire Google ecosystem becomes indispensable—and the Q2 results prove this strategy is already working.

LMT: Lookheed Martin Dropped on Earnings 23-07-2025The dividends now is around 3% which is good for a strong company like Lookheed Martin. But as we are seeing a drop in company profits & Equity, and the stock price is near to a support level, we have to monitor the stock for the next few days or weeks. If all is ok, I will consider buying it.
Disclaimer: This content is NOT a financial advise, it is for educational purpose only.

KO: Coca-Cola (CFD) Earnings 23-07-2025Yesterday we have the Coca-Cola earnings report came out and beat on both earning and revenue. But due to the technical position I do not see it a good entry on the stock CFD, still see PepsiCo stock CFD is a better option.
Disclaimer: This content is NOT a financial advise, it is for educational purpose only.

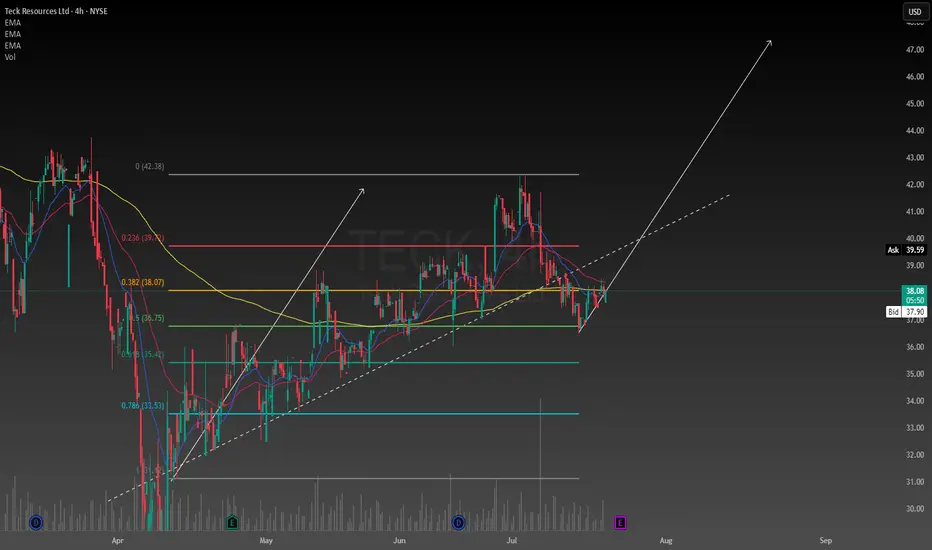
Long TeckThe fundamentals are good and macroeconomic factors contribute to the positive outlook. It seems to be trading above its intrinsic value but I'm going to take it anyways with the earnings report coming out soon the volatility should be interesting. Putting a couple percent of my portfolio to it and see how it goes. Probably hold it until the end of the year if it goes good.
VZ: Verizon stock update after earningsVerizon jumped on positive results, which aligned with my bullish view on it.
Tomorrow will have its competitors T-Mobile & AT&T earnings result, this will update us on the industry as well. Most probably that I will go long on it in the next 24Hr.
Disclaimer: This content is NOT a financial advise, it is for educational purpose only.

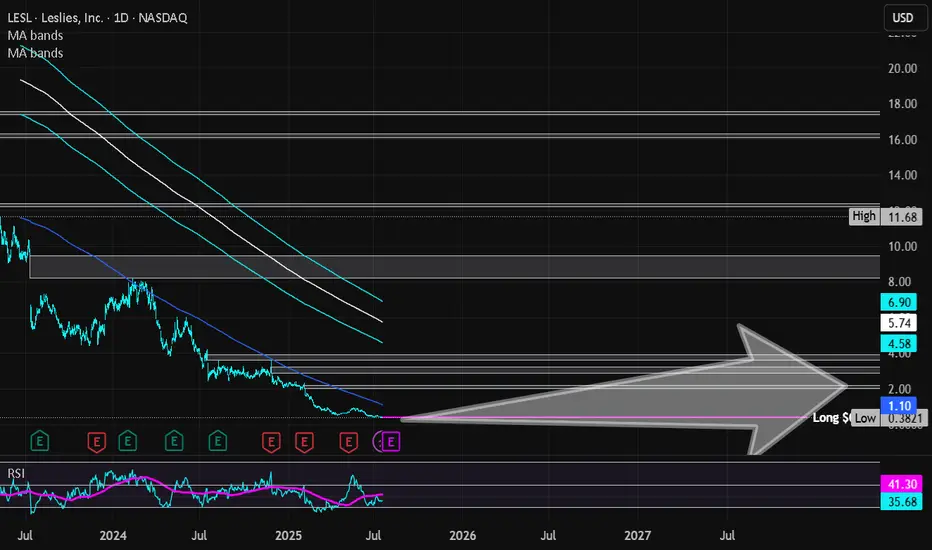
Leslies Inc | LESL | Long at $0.41**VERY risky trade - 25% or more risk of bankruptcy**
Leslies NASDAQ:LESL is a direct-to-consumer pool and spa care brand in the U.S., selling chemicals, equipment, and services. The stock dropped 88.86% last year due to weak demand, flat revenue, shrinking gross margins from stock write-downs, higher rent, shipping costs, and an earnings miss (-$0.25 vs. -$0.244). High debt, market share losses to e-commerce, and a competitive pool supply market also contributed.
On a positive note, the company generated $1.33 billion in revenue for fiscal year 2024. New leadership has entered the picture, cost-cutting is starting to happen, and summer season may boost pool sales. While 2025 is still projected to be a rough year, revenue is forecasted to grow 6.4% in 2026 and 2027 and earnings are likely to turn positive (based on company statements). While this is a *highly risky* play and there are absolutely better companies out there, I think there is a chance this ticker may get some steam in the near future. 7% short interest, 176 million float.
Thus, at $0.41, NASDAQ:LESL is in a personal buy zone.
Targets into 2027:
$1.00 (+143.9%)
$2.00 (+387.8%)
A BNPL Bubble Is Actually Why I'm Bullish, For NowBNPL is growing and inflating at an increasing rate. From concert tickets to burritos, everyone is using buy now pay later. The global market is projected to hit 560 billion dollars in 2025, up from around 492 billion in 2024, and climb to 912 billion by 2030 at a compounding growth rate of 10.2%. Just in the U.S. alone, demand is expected to reach 122 billion next year and scale to 184 billion by the end of the decade. The trajectory is steep, with the structural weaknesses already showing.
Block is positioned at the center of BNPL. In Q1 2025 they reported:
2.29 billion in gross profit, up 9 percent YoY
466 million in adjusted operating income, up 28%
10.3 billion in GMV through Afterpay, with 298 million in BNPL gross profit, up 23% YoY
The stock took a hit. It dropped 9 percent in February and another 21 percent after missing Q1 earnings, but this is seen as typical early bubble behavior. There is short term fear but continuing growth and acceleration. Klarna’s credit losses, IPO delays, and regulatory friction are not problems, they are actually signals that the sector is growing faster than the market, or quite frankly, anyone can control.
BNPL is becoming the default credit system for younger consumers. It is overused and expanding too fast. That is the formula for both upside and implosion. However with that, timing will be everything here, and knowing when to close will be crucial if BNPL can't stabilize.
Baseline expectation: SQ trades in the 80 to 90 range in the short term
Midterm upside: 120 by 2027
Long-term target: 180 to 220 if BNPL stabilizes and Block captures its runway

VZ: Verizon Earnings tomorrowwith 6% dividend yield and stock price at support level on the lower channel band, this draw attention to the earnings report tomorrow pre-market hours. Focused on future outlook as well.
If all good, I will buy VZ.
Disclaimer: This content is NOT a financial advise, it is for educational purpose only.
