whats the future for $NYSE:PM NYSE:PM has earnings coming up and we can expect to see a large profit after the recent acquisition of Zyns a massive product witch has boosted there earnings along with there smoke free tabaco I can see a long position but wait to the day before earnings for analysis.
Earnings

DJT stock: Dead cat rebound or wave of support?Trump Media & Technology Group Corp's stock surged following news of an attempted assassination on major shareholder Donald Trump at a political rally on Sunday.
Given the fervent nature of Trump's supporters, it's plausible that voters could turn to their wallets before casting ballots in November as the presidential race heats up. Drawing parallels to the recent activity surrounding the GameStop stock, a meme rally cannot be entirely ruled out, potentially presenting a lucrative opportunity for speculators.
For this scenario to materialize, high trading volumes in the stock need to persist. The average trading volume over the past two weeks is around 10 million shares. If today's activity surpasses this figure, it could indicate sustained interest in the stock following yesterday's massive gap up and record trading volume.
Although DJT stock closed $6 lower than its opening price, it currently hovers around the crucial $40 level. If the bulls can maintain the price above this level before today's close, it could signal a further bullish trend. Conversely, if the price were to fall below the $40 mark, we might see the stock trading at its early July levels of $30.
This trade is highly speculative, and while the current political climate could easily add more fuel to the fire, it's crucial to monitor the fundamentals. DJT reported a loss for Q1, but with Q2 earnings around the corner, investors should stay vigilant. Call spreads with 30-40 DTE (shortly before Q2 earnings report) might be an interesting play here regardless of the direction you're betting on.

I think Netflix is going to take a hit on this Month EarningsPersonally don't like Netflix business model focus right now.
Too many voice overs foreign movies, Producing too many low quality shows and movies.
NFLX falling behind the competition this Year only reason I have it now is because T Mobile offers Netflix for free.
I Could Be Wrong but Do not see netflix as a buy right now.

Apple. Bull Call Aug 230/250Buy a Bull Call 230/250 for 16th August after earnings
Buy Call 230, Sell Call 250 for premium around $8.30 with potential profit of $11.70
That is a max profit of 140%

SMCI is about to "break out" of the ascending triangle.SMCI is about to "break out" of the ascending triangle.
We Should Buy SMCI Stock Now.

Quess A Swing CandidateQuess: This is a relatively good setup. Accumulated by big hands. A great swing trading script in this overheated Marketplace.
Good Contraction, Base on Base Formation, Volume accumulation tower and a good quarterly growth
PS: Not a trading advice

$TSLA not done going higher. $320-$330 by July 24. GET LONGSo we already know that Tesla deliveries came in 9000 more than what was expected, 438,000 expected verse 447,000 that Elon Musk posted on Twitter a couple weeks ago. Last quarter earnings per share of $.47 was slightly missed, and on July 23 they’re expected $.60 per share earnings. So IMO, That could indicate that even a slight earnings beat on revenue and earnings, would propel the stock to complete wave three at 2.618 Fibonacci level.
never mind, the whole Robo-taxi delay, which caused an 8% decline on Thursday along with the rest of the Big tech Nasdaq. I don’t think robotaxi is realistically a factor in their valuation just yet.

Long $ENPH till day after earnings report July 24.There’s is a huge lift for all battery and renewable energy companies right.
For example, META hired Evercore EVR, to the tune of $54B to build out 11 square mile solar powered data storage facilities for its push into A.I., which requires a lot of energy to run AI.So there’s a ton of money from the large cap MAG 7 companies going into this industry right now.
Based on the volume profile and the fib levels already breached, i would easily believe if ENPH just slightly beats rev & earnings, and has decent guidance.

ETF Developers Buying Ahead of Q2 Earnings Reports: HDThis Dow component was the highest gainer for the average with a modest 2.10% gain yesterday. NYSE:HD price action was very controlled. Volume was slightly below average indicating it was likely ETF developers buying ahead of the earnings report.
Accumulation/Distribution indicator confirms this price range is a buy zone.
This is a technical setup to watch for pre-earnings runs for swing trading.

The First Trillion Dollar Healthcare Company - Eli LillyI recently wrote about Eli Lilly and why it has caught my attention, what it may mean for markets, but more specifically the most expensive and elaborate industry on Earth, that none of us can understand... HEALTHCARE.
Insurance is wildly expensive.
Many people are focused on health.
Scientists around the planet are trying to solve health.
And now, Eli Lilly, is on the very of becoming the first trillion dollar company in healthcare. Eli Lilly is nearing $900 billion market cap and is on pace to become the first trillion dollar healthcare company.
I have long followed healthcare stocks because I do believe they bring a lot of insight into health, innovation, and the natural sciences. After all, they are tasked with curing challenging diseases, sicknesses, and other aspects to help humans. Most recently, a certain stock has caught my attention.
I find this to be a noteworthy development for the industry, especially while stocks like Pfizer and others, such as NASDAQ:MRNA are dropping. NYSE:PFE
Place your bets accordingly. This move and alert has been added to my watchlist.


BTC is going back to 15k , yes no sh*t BTC volumes are all at 15 k meaning institutional money flow will use tomorrow cpi to send it to the ground and to boostr a dollar a bit, but btc seloff will turn into a rally

Bear Put Tesla 200/220In order to create an opportunity, after Tesla significant rise and upcoming earning announcements, end ofJuly, to make up for the current loss in the previous Bear Call 120/140, I am setting up this Bear Put for Aug (buy Put 220, sell Put 200)

Visualize $TSLA CALL pricing skew due to the upcoming earningsLet’s take a look at our new tradingview options screener indicator to see what we observe, as the options chain data has recently been updated.
When we look at the screener, we can immediately see that NASDAQ:TSLA has an exceptional Implied Volatility Rank value of over 100, which is extremely high. This is clearly due to the upcoming earnings report on July 23rd.
As we proceed, we notice that Tesla's Implied Volatility Index is also high, over 70. This means that not only the relative but also the absolute implied volatility of Tesla is high. Because the IVX value is above 30, Tesla’s IV Rank is displayed with a distinguishable black background. This favors credit strategies such as iron condors, broken wing butterflies, strangles, or simple short options.
Next, let’s examine how this IV index value has changed over the past five days. We can see it has increased by more than 6%, indicating an upward trend as we approach the earnings report.
In the next cell, we see a significant vertical price skew. Specifically, at 39 days to expiration, call options are 84% more expensive than put options at the same distance. This indicates that market participants are pricing in a significant upward movement in the options chain.
The call skew is so pronounced that at 39 days to expiration, the 16 delta call value exits the expected range. This signifies a substantial delta skew twist, which I will show you visually.
We see a horizontal IV index skew between the third and fourth weeks in the options chain. This means the front weekly IVX is lower than the IVX for the following week, which may favor calendar or diagonal strategies. Hovering over this with the mouse reveals it’s around the third and fourth week.
In the last cell, we observe that there’s a horizontal IVX skew not just in weekly expirations but also between the second and third monthly expirations.
Now, let’s see how these values appear visually on Tesla’s chart using our Options Overlay Indicator. On the right panel, the previously mentioned values are displayed in more detail when you hover over them with the mouse. The really exciting part is setting the 16 delta curve and seeing the extent of the upward shift in options pricing. This significant skew is also visible at closer delta values.
When we enable the expected move and standard deviation curves, it immediately becomes clear what this severe vertical pricing skew in favor of call options means. Practically, market participants are significantly pricing in upward movement right after the earnings report.
Hovering over the colored labels associated with the expirations displays all data precisely, showing the number of days until expiration and the high implied volatility index value for that expiration. Additionally, a green curve indicating overpricing due to extra interest is displayed. Weekly expiration horizontal IVX skew values appear in purple, and those affected by monthly skew are shown in turquoise blue.
The 'Lite' version of our indicators is available for free to everyone, where you can also view Tesla as demonstrated. Pro indicators are available more than 150 US market symbols like SPY, S&P500, Nvidia, bonds, etfs and many others.
Trade options like a pro with TanukiTrade Option Indicators for TradingView.
Thank you for your attention.

AUDUSD 15M ProjectionHello Billionaires!!
It looks like a good time to buy AUDUSD because the trend is going up. Just remember to keep an eye on the market in case things change.
Also, make sure to protect yourself by setting stop-loss orders below the support zone to avoid big losses if the market suddenly goes down. Its a Fibo Golden Technique FX:AUDUSD

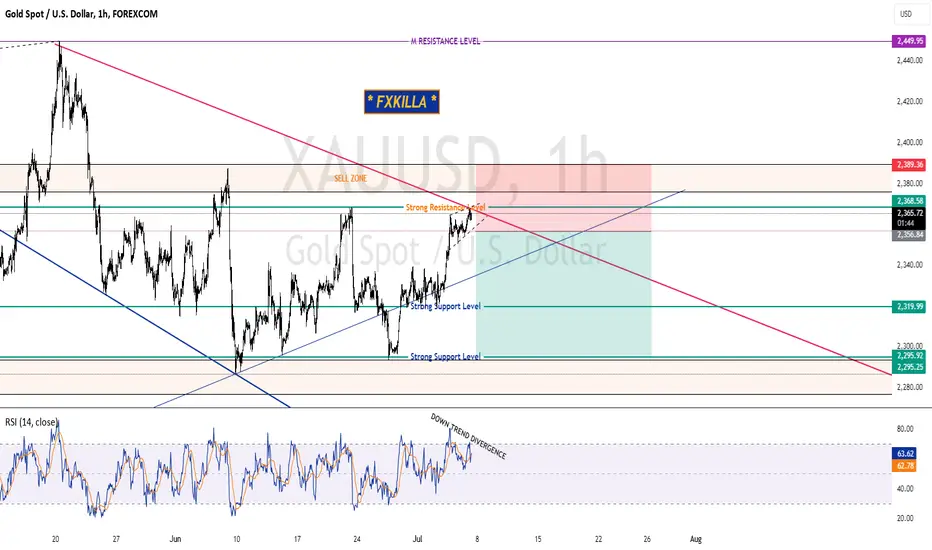
XAUUSD GOLD HIGH PROBABLITY SELL SETUP SOON 🚨XAUUSD HIGH PROBABILITY SELL SETUP SOON🚨
* Here We Can See Clearly The Next Potential Move For XAUUSD In Coming Hours.
* Gold Is Inside Rising Wedge Pattern.
* Down Trend Divergence On The RSI Indicator.
* NFP Is Due In Today.
* Keep Your Eyes Close On your Trading Positions.
* Happy PIP Hunting Traders.
* FXKILLA *
Planning for Next Earnings Season: DFSNYSE:DFS has a platform trend since the highs and lows are very consistent, suggesting controlled buying over time. It had a compression pattern before the pop out of the box white candle and a small gap up candle as the first attempt to break out to the upside. The stock may drop back into the platform range but if it holds, it's a good indication that earnings have improved. This is an example of a good pattern to watch for a pre-earnings run setup with potential to swing trade to earnings. Discover reports July 17th.

Talaat Mostafa Group Stock, only higher.
For those interested in the Egyptian Stock Exchange market, here's a technical analysis of Talaat Mostafa Group's stock. I recommend placing two buy limit orders and two sell limit orders for quick profits. In the long run, the stock is expected to reach higher levels. The fundamentals also support an upward move due to the inauguration of the new Southeast project next Sunday.

IndiaMART InterMESH Limited: A Fortune-Friendly Investment OpporI am excited to share my analysis of IndiaMART InterMESH Limited's (BSE: 542726, NSE: INDIAMART). The company's business model, financial performance, and future prospects make it an attractive investment opportunity.
Business Model:
IndiaMART InterMESH Limited is a leading e-commerce company in India, operating a business-to-business (B2B) e-commerce platform that connects buyers and suppliers. The company's platform enables businesses to source products and services from a vast network of suppliers, thereby reducing costs and increasing efficiency.
Financial Performance:
The company's financial performance for FY 2023-24 is impressive, with a revenue growth of 15.6% year-on-year (YoY) and a net profit growth of 21.4% YoY. The company's revenue from operations has increased from ₹1,434.4 crore in FY 2022-23 to ₹1,655.6 crore in FY 2023-24, driven by the growth in its B2B e-commerce platform.
Ratios to Consider:
Return on Equity (ROE): 23.4% (FY 2023-24)
Return on Assets (ROA): 14.5% (FY 2023-24)
Price-to-Earnings (P/E) Ratio: 35.6 (FY 2023-24)
Dividend Yield: 1.2% (FY 2023-24)
These ratios indicate that IndiaMART InterMESH Limited is a profitable company with a strong financial position. The ROE and ROA ratios suggest that the company is generating significant returns from its equity and assets, respectively. The PEG ratio indicates that the company's stock is trading at a premium, reflecting its growth potential. The dividend yield is relatively low, indicating that the company is retaining its earnings to invest in future growth.
Technical Analysis: Support, Resistance, and Predicting Prices
Technical analysis is a method used by many traders to analyze price charts and identify potential trading opportunities. It involves studying historical price movements, trading volume, and various technical indicators to make predictions about future price movements.
Support and Resistance Lines
Support and resistance lines are two of the most basic and widely used technical indicators. A support line is a horizontal line drawn at a highly moved mid price level where the price has bounced back up from several times in the past. This suggests that there may be buying pressure at this level, as investors see it as an attractive price to buy the asset.
A resistance line is a horizontal line drawn at a highly moved mid price level where the price has been rejected several times in the past. This suggests that there may be selling pressure at this level, as investors see it as a good price to sell the asset.
Linear Regression
Linear regression is a statistical technique that can be used to fit a straight line to a set of data points. In technical analysis, linear regression can be used to identify the trend of a price chart and to predict future prices. The slope of the regression line indicates the direction of the trend. A positive slope suggests an uptrend, while a negative slope suggests a downtrend.
Using Support, Resistance, and Linear Regression Together
Traders can use support, resistance, and linear regression together to develop a trading strategy. For example, a trader might look for opportunities to buy an asset when the price is near a support line and the linear regression line is sloping upwards. Conversely, a trader might look for opportunities to sell an asset when the price is near a resistance line and the linear regression line is sloping downwards.
Other Criteria:
Management Team: The company has a strong management team with a proven track record of driving growth and profitability.
Industry Trends: The B2B e-commerce industry in India is growing rapidly, driven by the increasing adoption of digital technologies and the need for businesses to optimize their supply chain operations.
Competitive Advantage: IndiaMART InterMESH Limited has a strong competitive advantage due to its large network of suppliers, robust technology platform, and extensive market reach.
Valuation: The company's stock is trading at a reasonable valuation, considering its growth potential and financial performance.
Conclusion: IndiaMART InterMESH Limited is a fortune-friendly investment opportunity that offers a unique combination of growth, profitability, and dividend yield. The company's strong financial performance, robust business model, and competitive advantage make it an attractive investment opportunity for long-term investors. I recommend that investors consider IndiaMART InterMESH Limited for their portfolio, especially those looking for exposure to the growing B2B e-commerce industry in India.

ASX:OFX – A Rare Gem with Perfect Piotroski Score and Breakout PFundamentals :
OFX Group, listed on the ASX under the ticker OFX, presents a compelling investment opportunity this week. The company boasts a perfect Piotroski F-Score of 9, an exceptionally rare achievement that underscores its financial strength and operational efficiency. Currently trading at its fair value, OFX has turned profitable over the last 12 months and is poised for continued profitability this year. ASX:OFX ASX:OFX
Technicals :
From a technical standpoint, OFX has achieved a significant 52-week breakout, further enhancing its investment appeal. The stock has formed a rounding bottom pattern, a classic technical signal indicating the potential for a strong upward movement. Analysts project a potential upside of 30%, making this a promising candidate for growth.
A potential Setup:
• Entry: Current Market Price
• Stop Loss: $2.00
• Potential Upside: $2.90F

$AEO Tilted Cup and HandleI am seeing a not so perfect cup and handle for $AEO. Rationale that is a bullish stock is because fundamentals says so as their EPS diluted growth rate is more than 100%. Let's observe.
Ka-ching!

Dixon Technologies (India) LtdKeep it on your radar. A correction on way after a huge rally
RSI & MACD are in over brought zone possible we could see some selling pressure as PE IS 188
Stock is trading at 40.7 times its book value
Note*- Based on personal opinions/observations. Please do your own research/analysis before making any trading/investing decisions.
I am not a sebi registered investment advisor

Found a HIDDEN BULLISH DIVERGANCE: Here is a hidden bullish divergence that is still in process. Show to complete by today at 5 PM PT.
MY custom RSI has not completed its lower low yet and will by today at 5 PM PT. This means the bullish reversal from a LL will start making its way up.
Then hopefully the BULL gets released.
J symbol for the month of JUNE and numerics for the day of the month. Days are separated by each tick of 5 days.
This is a thorough detailed idea that shows in my opinion to come next with very little to say.
