PEP: PepsiCo Earnings resultsIts looks like PEP is a buy now. Just want to double check on future sales growth as it is stable for a while. Lower stock price made the dividend very attractive since PEP is a defensive stock.
Disclaimer: This content is NOT a financial advise, it is for educational purpose only.
Earnings

Braxons Group: How Cryptocurrency Became Part of Everyday SpendiOver the past five years, cryptocurrency has gradually moved beyond the narrow confines of a speculative asset toward what it was meant to be from the start — a fully functional means of payment. In July 2025, a study by Bitget Wallet confirmed a significant shift in consumer behavior: millions of users worldwide now use digital assets to pay for goods, games, and travel.
Braxons Group analysts see this not just as a trend, but as a clear sign that crypto is entering a mass-adoption maturity phase.
Crypto in Shopping: From Enthusiasts to Households
According to the study, 35% of users now use cryptocurrency for everyday purchases — not only for digital goods, but also for paying for food, services, and essential products.
Braxons Group notes a sharp rise in crypto payment integration with POS terminals and online marketplaces, especially in Southeast Asia, where digital wallets often replace bank cards. The growth is driven by low fees, lack of bank control, and instant settlements — particularly via USDT and BUSD.
Gaming: The Key Engagement Driver
36% of users regularly use cryptocurrency for in-game purchases and Web3 applications. This comes as no surprise: NFT items, premium memberships, and tokenized game assets are now core components of most gaming economies.
Braxons Group highlights that Gen Z and millennials form the backbone of this new crypto audience. Their willingness to spend tokens on in-game content demonstrates high adaptability and low entry barriers.
This is an important investment signal: companies operating at the intersection of crypto and gaming will likely become dominant growth drivers over the next 3–5 years.
✈ Travel: Crypto Crosses Borders
Around 35% of respondents use cryptocurrency for booking tickets, hotels, and travel services. For Braxons Group, this validates the hypothesis that crypto is the ideal tool for global users — eliminating currency restrictions, reducing banking fees, and enabling direct bookings without intermediaries.
Among older demographics (Gen X), trust in crypto for high-value transactions is increasing. This marks a shift in the market: a sector once dominated by speculation is now becoming practically useful for everyday needs.
Regional Differences
The Bitget study revealed notable geographic patterns:
Southeast Asia — leader in everyday crypto payments (up to 41%)
Africa — active use for education payments
Latin America — strong e-commerce adoption (up to 38%)
Middle East — growing interest in high-ticket purchases (cars, tech, luxury goods)
For Braxons Group, this means the decentralized payments market is becoming multi-layered and globally fragmented, requiring region-specific solutions.
Braxons Group’s Conclusion
Our team concludes that cryptocurrency is evolving from an investment class into a transactional tool. It no longer makes sense to view digital assets solely as a store of value or speculative vehicle.
What was once an experiment is now daily reality:
Gamers buy NFTs and passes with tokens.
Households purchase groceries with stablecoins.
Travelers book accommodation with ETH.
The next step? Integrating cryptocurrency into banking and government systems. For businesses, this means embedding crypto infrastructure is now a must-have for digital competitiveness.


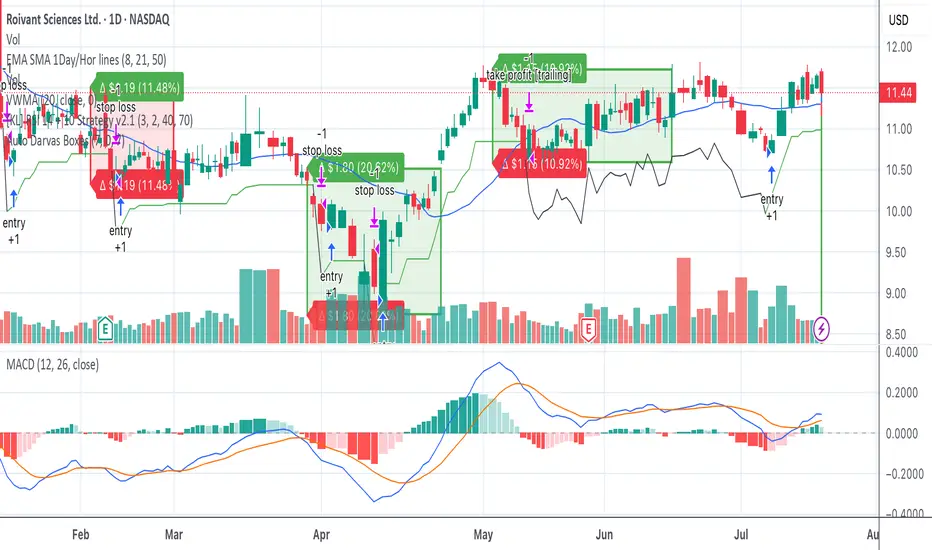
ROIV: A Speculative Biotech Play with Cash in the Bank and CatalRoivant Sciences (NASDAQ: NASDAQ:ROIV ) is one of the more intriguing speculative plays in the biotech sector right now. Trading around $11.45, the stock offers exposure to a deep pipeline of clinical-stage assets through its decentralized “Vant” model—subsidiaries focused on specific therapeutic areas like Immunovant (autoimmune), Pulmovant (pulmonary), and Priovant (inflammatory and dermatological conditions).
The company went public via SPAC in 2021 and has maintained a capital-efficient approach, acquiring and spinning off promising drug candidates. What sets Roivant apart is its incredibly strong balance sheet: nearly $5 billion in cash and equivalents with minimal debt. That translates to about $7 per share in net cash, giving it one of the strongest financial positions in the biotech sector and a long operational runway.
Roivant’s upcoming earnings call on August 7 (after market close) will be closely watched. Investors are particularly focused on late-stage clinical data expected in the second half of the year, including Phase III readouts for brepocitinib (Priovant) and updates from Immunovant’s FcRn inhibitor programs. These results could serve as major price catalysts.
Financially, Roivant is still burning cash, as expected at this stage. The most recent quarterly earnings showed an EPS loss of –$0.29, missing analyst expectations. Revenue came in at $7.6 million—above estimates but significantly below the prior year’s figure of $28.9 million. Free cash flow was –$844 million for the year, but with a current ratio over 30 and a healthy reserve, the company is in no danger of running out of capital in the near term.
Technical Outlook: Holding Range, Eyes on Breakout
The daily chart shows ROIV in a tight $10.80–$11.80 range, consolidating after a solid run. While the short-term 15-min chart showed a recent pullback, support held at $11.40 and triggered a fresh entry signal in our system. MACD is flattening and could curl bullish again soon. On the daily, MACD remains bullish with room to run if volume enters.
A break above $11.70–$11.80 could trigger the next leg toward $12+, and ultimately the psychological and options-heavy $13 level.
Options Activity: Big Bet on October $13 Calls
What’s catching serious attention is unusual options flow on the October $13 call contracts. Over 17,000 contracts are open, with recent trades in the $0.45–$0.55 range—showing real speculative interest in a move above $13 by Q4. That’s about a 13% move from current levels, well within range for biotech on a good catalyst.
I like the $12 August call for ROIV offers a more conservative upside play than the $13 strike, with less distance to break-even and still attractive risk/reward. Trading around $0.20–$0.25, it only requires an ~5% move to be in the money, making it a more realistic target if momentum builds post-earnings or on positive trial news. With less premium risk and higher probability, it’s a smart middle ground. And it's not a bad buy at $12 heading into Q4.
My Position
I’ve taken a very small position in near-term calls to test the setup and stay engaged. The combination of:
A strong cash runway
Upcoming catalysts
Technical setup near breakout
And rising options interest
makes ROIV a name to watch closely.
The Setup: Binary Risk, Asymmetrical Reward
For those considering the October contracts, this is a classic biotech setup:
Defined risk (premium paid)
Asymmetrical upside if catalysts hit
A clear breakout level to monitor ($13+)
And a high cash floor that provides downside cushion
This fits perfectly into a broader strategy of small speculative bets with high return potential.
Roivant isn’t without risk—trial results and sentiment shifts matter—but it’s one of the better-positioned clinical-stage plays heading into the second half of 2025. Watch for updates on Priovant and Immunovant, track the $13 level, and monitor volume and MACD crossovers for clues. If this stock breaks out, October could be the window.
SLB: Schlumberger updateIt seems SLB is at good valuation now, but a risk in dropping international revenue still need to be figured out.
if this can be solved, then SLB is good to go.
Disclaimer: This content is NOT a financial advise, it is for educational purpose only.

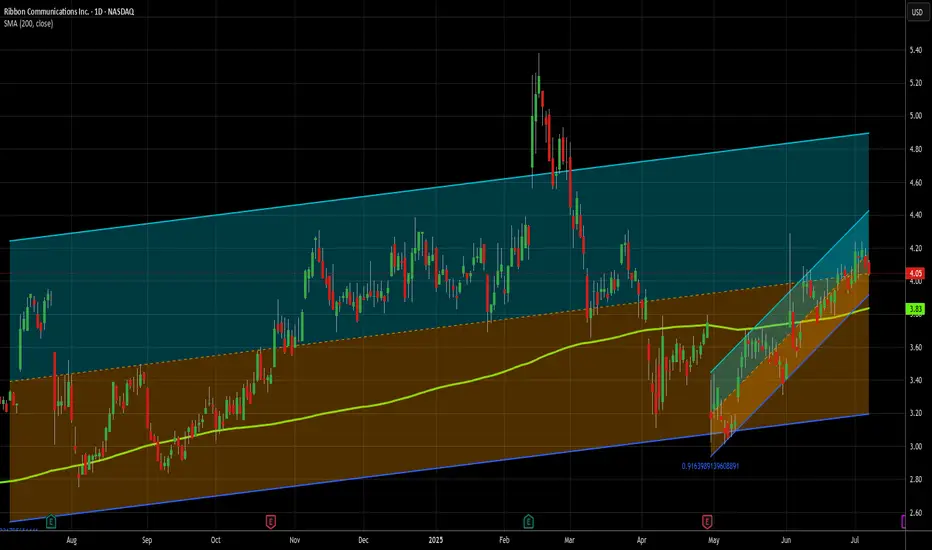
Small cap is the flavor of the day - Long at 4.05I decided to do a small cap stock today. I don't use too many of these as ideas, though I do trade them on my own. I don't usually publish about them because they are inherently more risky than large cap, established stocks. And to be fair, RBBN has a spotty history from a chart perspective.
Go ahead and zoom on out all the way. See that? That's what danger looks like. This stock has lost 80% of its value in the last 10 years, and 50% in the last 4. However, in its defense, it is profitable on a reported earnings basis over the last 12 months, and has held its own for several years now, and that's why I'm not AS nervous as I might otherwise be publishing this.
Additionally, it's solidly above its 200MA and in both a 1 year and 2 month uptrend, so its recent strength is good. I haven't dug down all the way back to its debut, but I suspect I'd have at the very least had a challenge making money on this one over its entire existence. But I am not trading its entire existence today. 75% of the trades in this stock in the last year would have closed in under 2 weeks, so the short term picture is what I'm mostly looking at here, and over the last month or so this has been a very solid stock. Could that change tomorrow? Yup. But I don't have that crystal ball. All I can do is rely on the system that has of late produced excellent results here.
In the last 12 months, there have been 27 buy signals here. 25 closed profitably and 2 are still open and down 18% and 9%, respectively. INCLUDING the losers, however, the median daily return on those trades has been .48% (>10x the market avg) and the average daily return is 1.02% (> 23x the avg daily market return).
Trading is about balancing risks and rewards. This stock is riskier than most, but the rewards are a lot better, too. I don't put all my money into any one trade - that's a TERRIBLE idea. The vast majority of my open trades are relatively safe, large cap stocks. But risky has its place in a portfolio. I made 15% in 2 days recently on QUBT (I posted that trade here) and made almost 18% on NUTX in the last 2 days - just closed that trade today. As a % of my portfolio of trades, ones like that can be small positions, but make a meaningful impact. That's my hope for RBBN here.
Of the 25 winning trades in the last year, over half produced a gain of 4% or more. And the average holding periods of the winners was only 8 days, with 15 of the 25 closing in a week or less. That rapid return also reduces the risk in a stock like this one. Wnen you only stick around for a few days most of the time, it's harder (not impossible) to get caught holding the bag during a drop.
My close will be signal based, and not a particular price target, but the trades I referred to above on RBBN give a good outline. However, the 2 losers have been open since February, so be forewarned that IF you follow me on this one, you might need to buckle your chinstrap. It could get bumpy.
As always - this is intended as "edutainment" and my perspective on what I am or would be doing and why, not a recommendation for you to buy or sell. Act accordingly and invest at your own risk. DYOR and only make investments that make good financial sense for you in your current situation.
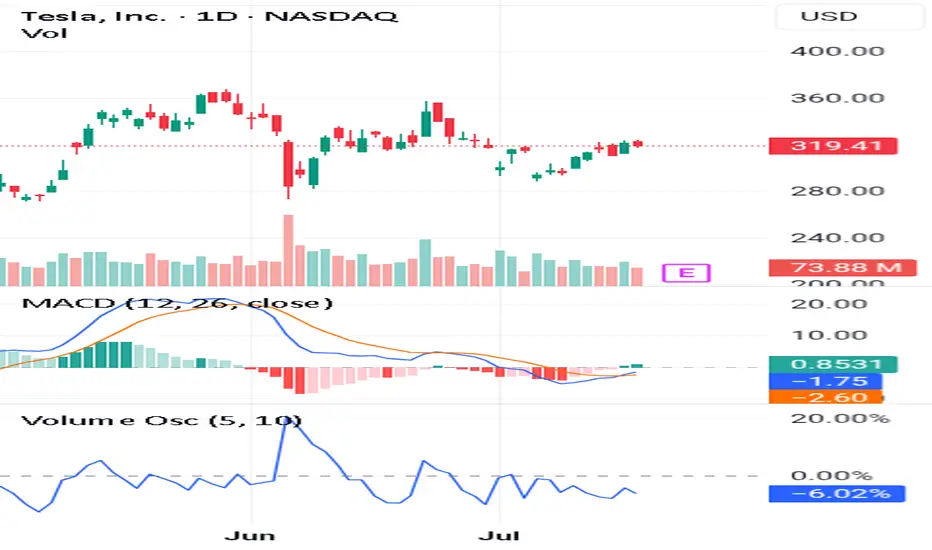
(Learn More)Use These 3 Steps To Spot Long-Lasting Trends👉Trade before the earnings report
👉Make sure the volume oscillator is below zero
👉Make sure the MACD lines give you a Bullish signal
If you look at this chart you can see all the steps alignment.
This is very important because you want to catch a long term trend.
Also it has to follow the 3step rocket booster strategy.
In order for you to learn more about this strategy 🚀 Rocket Boost This Content.
Disclaimer ⚠️ Trading is risky please learn how to use Risk Management And Profit Taking Strategies. Also feel free to use a simulation trading account before you use real money.
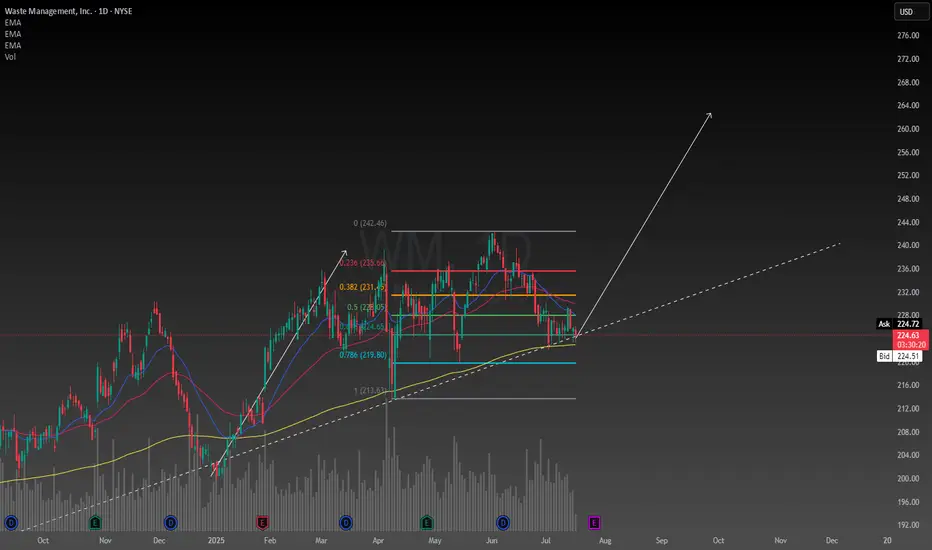
Waste Management confluencesFirst of all fundamentally the company is basically essential to our survival so I have no reason to believe they will go out of business any time soon. Earnings report soon should bring about some volatility. I was foolish enough to buy the top a couple months ago and deciding today I will add the the position because I like this price. Even though I bought the top, it was still below the intrinsic value at the time so it was a reasonable decision.
With my simple trendline and rudimentary use of a Fibonacci I am able to set a price target of $260 depicted by my drawing of a potential new leg up. This is backed up by the absolutely fundamental usage of a calculation of the intrinsic value, which by my calculation is $280, and has a range between $170-$640 however these numbers may need to be adjusted after the earnings report. The value is now well below the intrinsic value so I am seeing this stock as a really good deal now.
Despite any uncertainty in the economy Waste Management has seemed to outperform during these times so it is in my portfolio defensively. This stock is strong when it needs to be, which is why I like it.
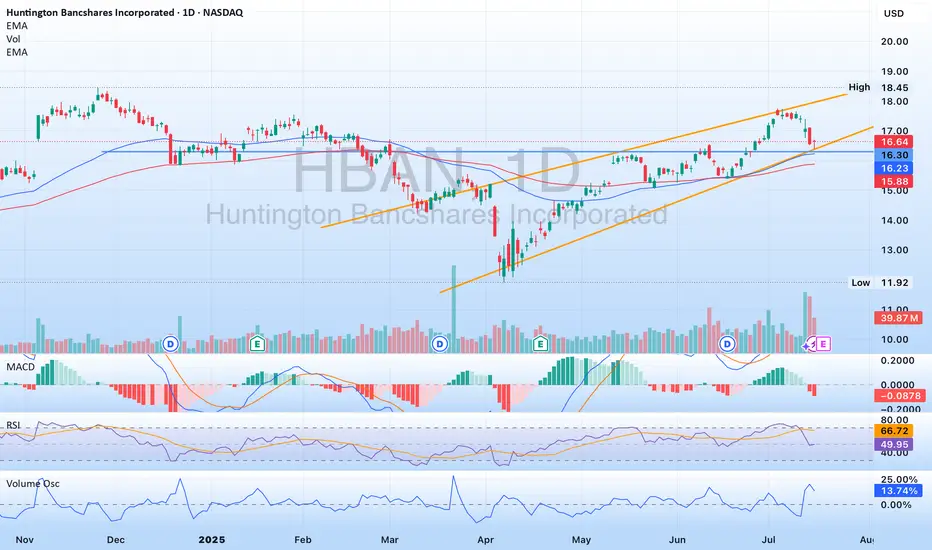
$HBAN - well positioned to continue on its pathNASDAQ:HBAN has been in a rising channel since April, and is no touching the lower band of the channel. His area also includes some previous resistance turned support, as well as some movement paces. NASDAQ:HBAN recently announced they are acquiring Veritex ( NASDAQ:VBTX ) which will strengthen their mark in Texas. Please note NASDAQ:HBAN is releasing earnings July 18th. A good report should see the stock moving towards the upper band of the channel, maybe break through it.
Double Calendar Option Spread on MMMUsing a double calendar spread to profit from price movement in either direction after earnings announcement in 3 days time (18 July) for MMM.
These trades can be extremely profitable if one expects movement after earnings.
Selling both a Put and Call at high (pre-earnings IV) makes this option trade relatively cheap, since the purchase for the other Call and Puts are after earnings announcement with lower IV
Selling a Call with Strike $167 for 18th July
Selling a Put with Strike $145 for 18th July
Buying a Call with Strike $175 for 29 Aug
Buying a Put with Strike $140 fro 29 Aug
Total net debit and max loss $125 for 1 contract
Max profit $ 287
For more details on these type of Option trades you can search for Strategic Options Trader on Substack

“How Other People’s Fear Becomes Our Profit”From a behavioral and technical standpoint, LEVI presents a textbook short opportunity following its post-earnings overreaction. After a strong earnings beat, the stock surged over 13% intraday, reaching a high of $22.07. However, this rally quickly pushed RSI into overbought territory, triggering natural selling pressure. Much of this sell-off can be attributed to traders who previously bought near the $21–$22 range and are now looking to exit at breakeven—a classic example of loss aversion and anchoring bias. This emotional response often leads to temporary price spikes followed by sharp corrections. We are now observing that exact pattern, with the stock fading to $21.92 in after-hours and closing at $21.95, signaling buyer exhaustion.
Technically, this marks a short-term trend reversal—from bullish earnings momentum to a developing downtrend. The price action shows rejection at key resistance, weakening volume, and emotional exit zones being triggered. Now is a clean, high-probability shorting opportunity, with potential to capture 2–7% downside in the next 1–2 sessions, especially as the broader market reacts to inflated valuations and profit-taking behavior.

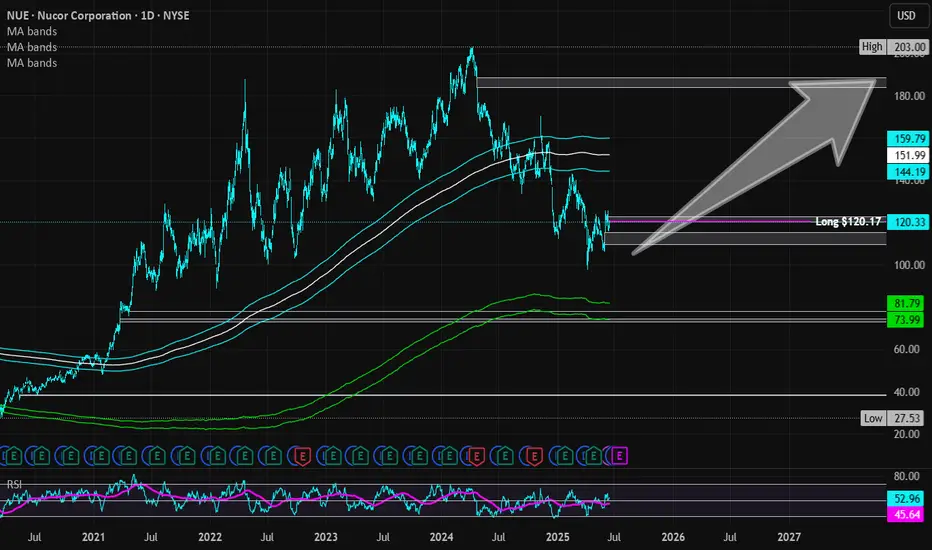
Nucor | NUE | Long at $120.17Nucor NYSE:NUE , a US manufacture of steel and steel products, will likely capitalize on reduced foreign competition as tariffs become reality. The CEO also recently stated that the steelmaker's order backlog is the largest in its history and is increasing prices. So, while there is a potential for short-term downside as tariff "unknowns" are negotiated, the longer-term upside may be there for those who are patient... but time will tell.
Basic Fundamentals:
Current P/E: 21x
Forward P/E: 15-16x
Earnings are forecast to grow 29.6% per year
Projected Revenue in 2025: $32.3 billion
[*} Projected Revenue in 2028: $39.4 billion
Debt-to-Equity: 0.4x (healthy)
Dividend Yield: 1.8%
Technical Analysis:
Riding below the historical simple moving average and there is risk the daily price gap near $109 will close before moving higher. If there is a "crash" in price, $70s is absolutely possible which will be a "steel" if fundamentals do not change.
Targets in 2027:
$142.00 (+18.2%)
$187.00 (+55.6%)
Green Plains | GPRE | Long at $4.18Green Plains NASDAQ:GPRE , a company involved in the production of fuel-grade ethanol and corn oil, and grain handling/storage has seen a significant decline in stock price since 2023. Analyzing the company's historical stock performance shows it is highly cyclical and goes through "boom and bust" cycles every 4-8 years - whereby during booms the price has typically 10x'ed from the lows. History may not repeat, though.
From a pure technical analysis perspective, the company has already entered and slightly exited by "crash" simple moving average zone (green lines). While the lows may not be in yet, this zone (currently between $1.20 and $3.30) typically represents a longer-term bounce area or price consolidation.
Fundamentally, the company is currently unprofitable but expected to become profitable in 2026 and beyond. Debt-to-equity = 0.72x (low/moderate). Price-to-book = 0.31x. During the most recent earnings call, Chief Legal and Administration Officer at Green Plains noted the company’s past performance has not met expectations, but stressed “that is changing.” This includes exiting non-core operations and launching the sale of non-strategic assets in a commitment to achieve $50 million in cost reductions. The company is on track to meet that goal and has already achieved $30 million in annualized cost savings.
It's a speculative play that could go to $0. But at $4.18, NASDAQ:GPRE is in a personal buy zone based on technical analysis as well as future fundamental predictions (which could be BS...).
Targets:
$6.00
$8.00

ITS TIMEGME coiled on the 4hr RSI break 50 were launching from the POC area to 24.50 to next MA. Overall target after taking 26 is VAH around 27.58. The drop down was profit taking/ overextended /sell the news after all the hype leading into the btc purchase announcement they didn't disclose purchase price either from what I know. But btc is at ATH the 500M is now in decent profit and last quarter rev and earnings were good. Last time gme broke out was 17% on a overall stock market correction day, seems like thats going to be the case again for now im in the Aug 1 25 calls for .6 looking to close these in profit and roll to higher further out strike like the jan 26 35. cheers, here kitty kitty.

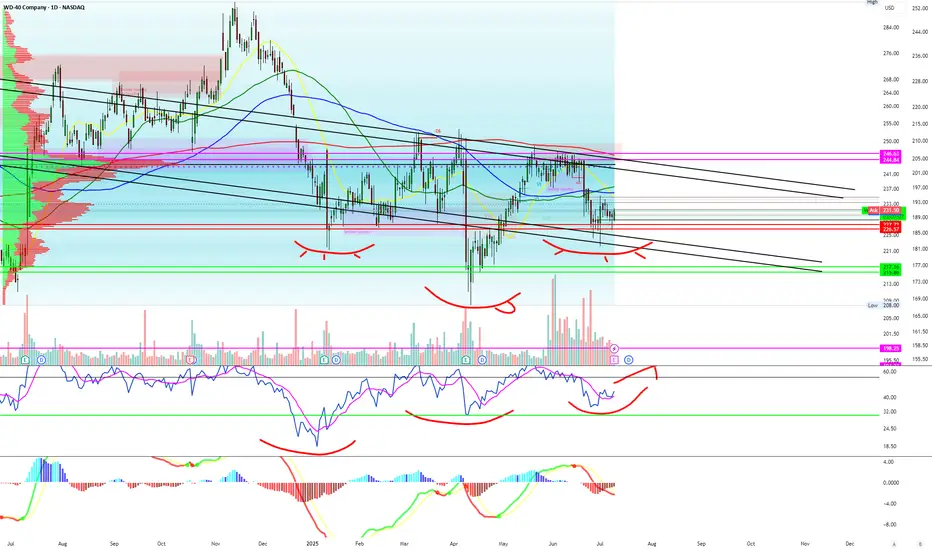
Never thought I'd be bullish WD-40 LMAOAll indicators such as RSI, descending channel pattern and MACD combined with options exposure make me believe earnings will be good in the stock prices eyes.
IWM and small cap stocks are really starting to pop off and nothing is more American then WD-40!!!
Target #1 - $240
Target #2 - $250
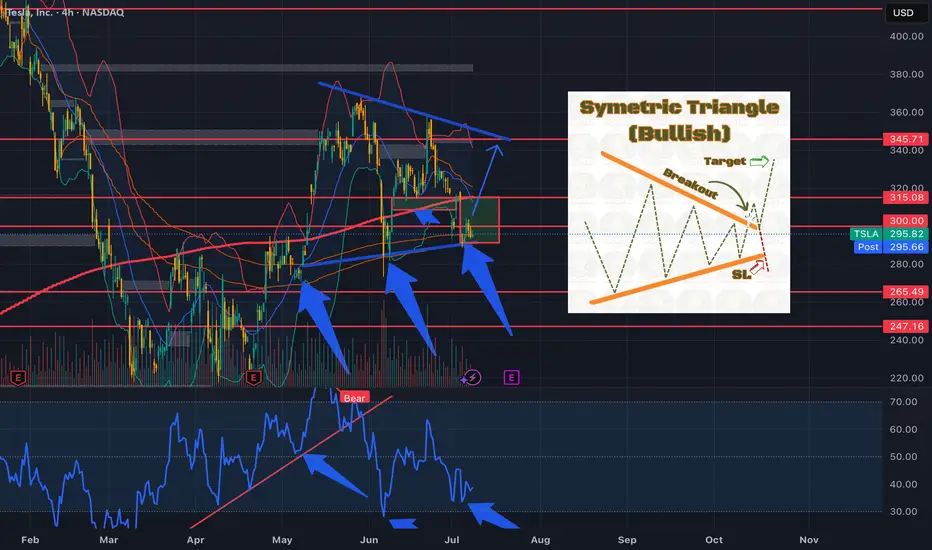
TSLA....Symetric Triangle....Earnings Rally?Could we see the bulls step in and leads us into earnings?
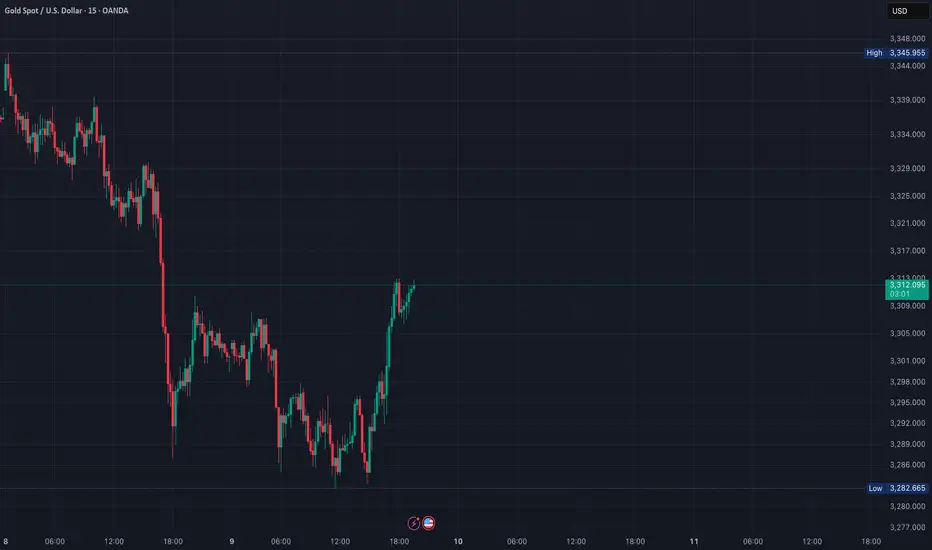
XAUUSD – Watching the 3318 Resistance for Potential Reversal
Currently monitoring Gold (XAUUSD) after a short-term bullish push toward the 3318 resistance zone. This area is significant due to:
Confluence with the upper Bollinger Band
Previous horizontal resistance level
Loss of momentum shown on MACD and other lower timeframes (15m–1h)
Price action is slowing as we approach the overbought territory. If price fails to break above 3318 and prints a clear reversal candlestick (e.g., pin bar or bearish engulfing) on the 1H chart, I’ll be looking for a short setup.
Disclaimer:This analysis reflects my personal view and is shared for educational purposes only. It does not constitute financial advice or a recommendation to enter any trade. Always do your own research and manage your risk accordingly. ⚠️
$MAN to the moon! Monthly RSI hit 30; will hit $65-75 in 60 daysNYSE:MAN has repeatedly gone up in huge ways every single time the monthly RSI has crossed below 30. We have now seen back to back months dipping below and now it’s on its way up already!
Check its history and you’ll see that typically within 2-3 months after it breaks the 30RSI it goes up 50-150% in price within just a few months! Some of those times it doubled in just 2 months.
History repeats itself and I don’t want anyone missing this one! $50 strike calls for September/December will pay handsomely. Short term grab $55 July calls for just .10-.15 each as they have earnings the day prior to the contract expiring—lots of volume on that strike also compared to all other strikes/monthly contracts.
I am going “all in” on this trade and will be buying 500 of the December $50c. I expect to more than double my position by the end of September.

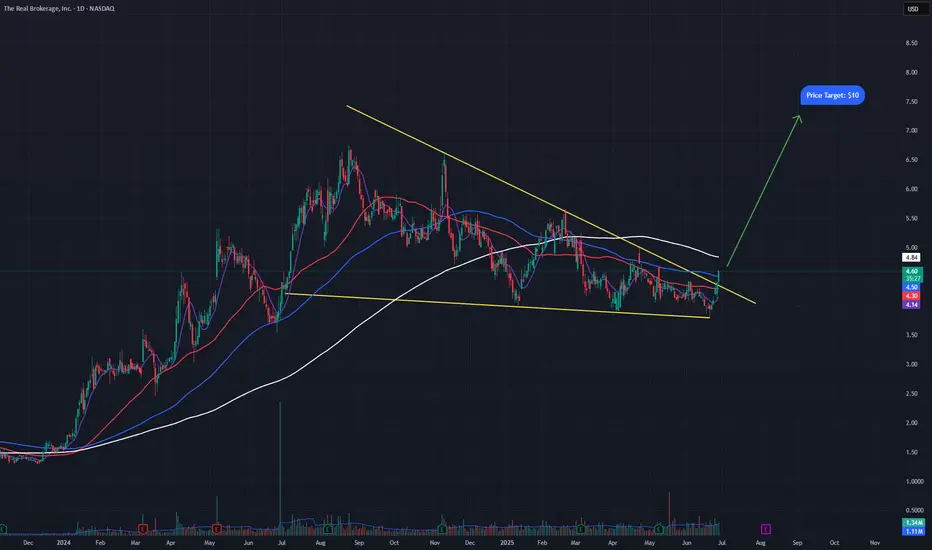
REAX breaking outREAX is a real estage brokerage company that has been in this bullish decending wedge for about a year now. It just broke out yesterday and had a push higher today, confirming the breakout. A measured move of the bull flag puts price targets on this stock around $10 a share, roughly double its current share price. It also sports a Zack's #1 buy rank and is expected to report positive earnings for the first time in company history, when it reports Q2 earnings on August 6th. If this indeed happens, the stock will push much higher, get in early before that happens.

ETH SHORT LIMIT2510–2525 SHORT
TP - 2465 / 2430
SL - 2545
The old pending order is no longer valid, easy to mistakenly touch the high short, resulting in a reverse stop loss

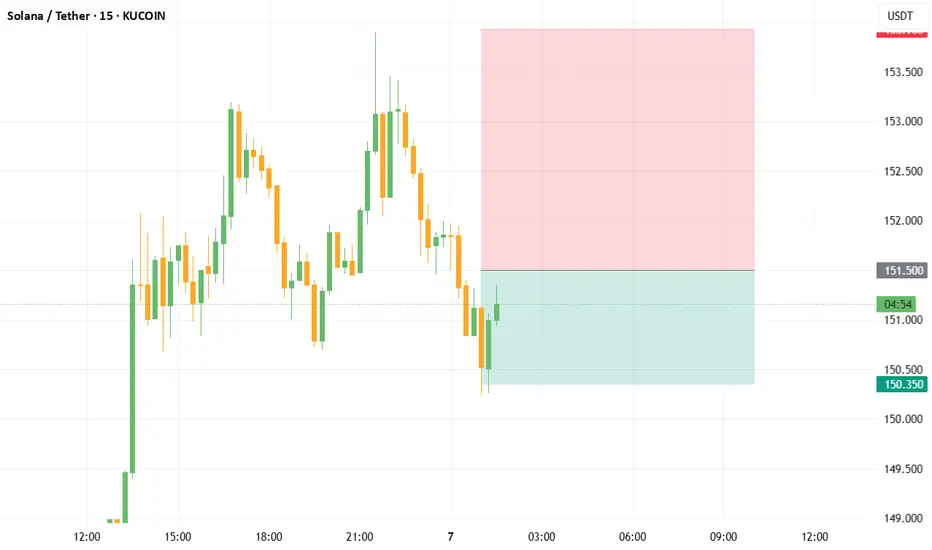
[SOLUSDT scalping short signal]- Signal: SHORT
- Entry: 151.300 ~ 151.500
- Take Profit: 150.820, 150.350
Chasing highs and lows is prohibited, so miss it;
Prohibit stop-loss operation, only to do "controlled static and dynamic resonance zone" within the transaction.
FULL MARGIN TEST ETH✅ 2. ETHUSD (Strong bias rising)
Entry: 2565 Long on retracement
Stop Loss: 2540
Take Profit: 2600
Recommended lot size: 0.20 lot (1:100)
