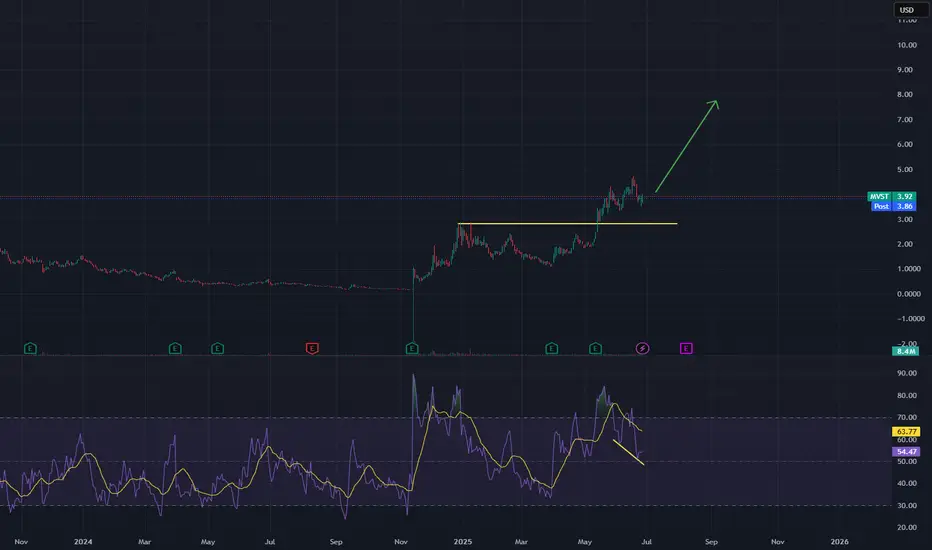
Microvast setting new 3-year highsMicrovast beat earnings in May of this year and reported positive earnings for the first time, shocking investors and sending the stock soaring above its previous resistance highlighted by the yellow trendline. As you can see it has been forming bullish consolidation above the trendline which now is seeming to act as support. There is also hidden bullish divergence on the RSI which I've highlighted. Great time to get into a really cheap stock that has much more upside to go should they continue to report positive earnings.
Earnings
XRP Price Finds Some Relief — But Headwinds Remain,Says ArtavionAfter slipping below $0.50 last week, XRP has rebounded modestly, now trading above $0.52. While this short-term recovery provides relief for holders, fundamental and structural challenges still limit the token’s upside potential, according to analysts at Artavion.
The recent bounce appears largely technical. Support held near $0.48, and with Bitcoin regaining strength above $66,000, sentiment across altcoins briefly improved. XRP’s Relative Strength Index (RSI) has moved out of oversold territory, suggesting some room for additional upside — but resistance between $0.56 and $0.60 remains firm. Low trading volume suggests the rally lacks conviction.
A major ongoing concern remains XRP’s legal battle with the U.S. Securities and Exchange Commission (SEC). Although Ripple Labs scored partial wins, the case is unresolved. Until a final judgment or settlement is reached, institutional investors will likely remain cautious, and U.S.-based platforms will continue restricting XRP exposure.
🗨️ “The legal cloud hasn’t lifted — and that limits capital inflows,” says a regulatory analyst at Artavion.
From a network perspective, XRP Ledger remains functional and Ripple’s payment infrastructure is active, particularly in select cross-border corridors. However, XRP still lacks integration with key crypto sectors like DeFi, NFTs, and gaming, which restricts organic demand and developer activity.
Externally, macro conditions are neutral to negative for altcoins. The Federal Reserve’s rate outlook and rising bond yields continue to pressure speculative assets. Stablecoin inflows into XRP trading pairs have slowed — another signal of fading short-term appetite.
Outlook
At Artavion, we believe XRP is currently locked in a range-bound pattern. A breakout above $0.60 is unlikely without:
Full legal clarity in the U.S.;
Stronger altcoin sentiment market-wide;
Renewed ecosystem development and integrations.
🗨️ “XRP isn’t broken — it’s waiting,” says the Artavion market desk. “But without a catalyst, it stays reactive — not directional.”

Bearish Alert: SOL Short Setup You Can’t Ignore🔻 60-min Bearish Signal on SOL/USDT
🎯 Entry: 130.50–128.80
📉 Targets: 123.40 & 118.20
🧠 Clean confluence setup — no indicators, just pure price timing.
⚠️ For educational purposes only.


My system.Hi followers, I have kept my system a secret because i have been struggling for 3 years now i am at my 5th year and it has been working well, i will be launching a course to teach it, this is a no Indicator system, no trendline, simple rules to follow majority of the works come from the mental side.


Wayfair | W | Long at $34.62Wayfair $NYSE:W. Recession fears are valid. But long-term, once this company becomes truly profitable, this will be a multi-bagger. I won't go on much about the fundamentals because there are too many economic unknowns ahead, but from a technical analysis perspective, the historical simple moving average lines/area is repeatedly converging with the price and leveling out. Often, this means a change in directional momentum. There are no more open price gaps below the current price on the daily chart. Thus, at $34.62, NYSE:W is in a personal buy zone.
Note: The price entering the teens in the near-term is a possibility.
Targets:
$40.00
$50.00

#Cochinshipyard - Expecting 30% move from here on Stock is making higher highs
Bullish market structure 💥💥

Newmont Corp | NEM | Long at $48.00While gold prices have soared recently, gold mining stocks have lagged. Newmont Corp NYSE:NEM , the world's largest gold mining corporation, may be undervalued if the miners take off to catch up to the gold demand/price. Currently sitting near $48.00 and at a historical moving average that it will need to break to show a true trend reversal, NYSE:NEM is in a personal buy zone. Now, the price may break down at the simple moving average and test the patience of shareholders, but the long game may benefit those who can tolerate the volatility.
Target #1 = $57.00
Target #2 = $71.00


DOT/USDT High win rate scalping signals in 15 minutes (TEST)- Signal: Empty
- Entry: 3.778 ~ 3.782
- Take Profit: 3.761, 3.748

ETH/USDT Scalping Signal of the DayDirection: Empty
Entry Range: 2523 ~ 2528
Take Profit Target: 2508, 2501

Can $ALB Triple Without Lithium Prices Hitting All-Time Highs?🧠 TL;DR
Albemarle ( NYSE:ALB ), a global lithium heavyweight, has seen its stock price collapse over 70% from its 2022 highs, closely tracking the decline in lithium spot prices. With lithium carbonate plunging from ~$80,000/ton to under $15,000/ton, many investors assume a rebound in the commodity is a precondition for a meaningful recovery in $ALB.
But what if that assumption is wrong?
This post explores whether Albemarle can stage a powerful comeback even if lithium prices remain far below their peak. Once lithium bottoms—potentially soon—investors can begin extrapolating annual demand growth and embed those expectations into the share price, setting the stage for a valuation rerating.
The headline chart tracks the long-term price relationship between Albemarle and lithium carbonate, normalized and plotted on a logarithmic scale. It shows the synchronized peaks of 2022, the ensuing crash, and where that correlation may have decoupled.
While the lithium price collapse has been severe, NYSE:ALB has arguably overcorrected — potentially pricing in a long-term depression in lithium that may never materialize.
🏭 Revenue, Net Income, and Lithium
This chart juxtaposes Albemarle's trailing revenue and net income against spot lithium prices. Despite a sharp fall in the commodity, the company posted two successive quarters of profitability, and revenue remains well above pre-boom levels.
This resilience suggests:
Multi-year pricing contracts offer insulation from spot volatility
Cost structure remains profitable even at current prices
Demand tailwinds (EVs, grid storage) are still pushing through
📊 Negative Forward P/E, Positive Earnings, and Discount to NAV
While forward P/E metrics have dipped into negative territory, this doesn’t tell the full story. The company delivered back-to-back profitable quarters, and the current share price reflects a significant discount to estimated net asset value.
The market is currently punishing ALB based on trailing pessimism and collapsing sentiment, rather than forward fundamentals. When lithium prices stabilize, even at mid-cycle levels, investors may reprice ALB based on future earnings potential and hard assets—not backward-looking assumptions.
🔍 Key Takeaways
🔋 Demand Remains Strong
EVs, grid storage, and electrification trends are not slowing. Lithium demand is projected to more than triple by 2030. Even modest demand growth off the current base will stretch supply chains, especially if new projects are delayed.
🏗️ Albemarle’s Structural Edge
With a relatively low cost of production and long-term contracts in place, ALB is positioned to ride through the downturn. The company has already demonstrated profitability at today's prices.
📉 Valuation Compression = Opportunity
At current levels, the stock appears to price in a scenario of sustained low lithium prices and declining demand. But the company’s hard assets, cost advantage, and future demand curve suggest a different reality.
🧠 Final Thought
Once lithium prices bottom—maybe relatively soon—investors can begin to extrapolate the rate of annual growth and embed those expectations into the share price, potentially triggering a sharp re-rating before spot prices ever return to their highs.

US Unemployment Rising: How Is This NOT a Recession?The U.S. unemployment numbers are steadily climbing, as indicated by recent Bureau of Labor Statistics data. Typically, significant rises in unemployment correlate directly with recessions, which are shaded gray in historical data charts.
Currently, unemployment has reached over 7 million, significantly higher than recent lows. Historically, every similar increase has coincided with or preceded an official recession declaration. Yet, mainstream economic narratives have avoided labeling this a recession.
What does this data tell us, and is the market accurately pricing in the risk? Are we already in a recession, or is this time different?
Share your thoughts below. Let's discuss the disconnect between the unemployment reality and official recession narratives.

AES | Bounce in Motion from Multi-Decade Support – 75% Upside 📍 Ticker: NYSE:AES (AES Corporation)
📆 Timeframe: 1M (Monthly)
📉 Price: $11.48
📊 Volume: 109.4M
📈 RSI: 40.20 (Oversold rebound zone)
🔍 Technical Setup:
NYSE:AES has just bounced from the lower boundary of a 30-year ascending parallel channel, a zone that has historically marked major long-term bottoms.
🟢 Green arrow: Rebound from long-term trendline support
📏 Targeting reversion to the channel median
🔹 Pattern context: Mean-reversion strategy inside macro uptrend
🧠 Trade Plan & Price Target:
✅ Entry Zone: $11.00–$11.50
❌ Stop-Loss: Close below $9.50 (channel structure breakdown)
🎯 Target: $20.00
→ 📈 Return: +75.6% from current levels
⚠️ Key Insights:
RSI near historical bounce zone (40)
Major volume surge may signal capitulation
AES is historically cyclical within this macro structure — mean reversion is likely
Short interest elevated — potential for short-covering rally
💬 Will AES power a multi-quarter reversal like it did in 2002, 2009, and 2020?
📈 Add it to your radar if you’re watching for long-cycle rebounds.
#AES #MeanReversion #LongTermChannel #Utilities #ValueTrade #TargetTraders

PRMB | Breakdown in Progress – Setting Up for a 200% Swing Buy📍 Ticker: NYSE:PRMB (Primo Brands Corporation)
📆 Timeframe: 1W (Weekly)
📉 Price: $28.84
📊 Volume: 32.38M
📈 RSI: 40.95 (Bearish momentum, nearing bounce zone)
🔍 Technical Setup:
PRMB has broken below a steep sub-channel and is targeting the midline and base of a broader long-term ascending channel, offering a high-reward opportunity for medium-term traders.
📉 Short-term trend: Bearish correction
📈 Long-term trend: Still intact within rising channel
📍 Support zone: $20.70 – multi-year horizontal + lower channel convergence
📊 RSI: Oversold territory, potential for bullish divergence
🧠 Trade Plan & Price Targets:
📥 Wait for price to hit $20.70–21.00 zone (major confluence zone)
✅ Entry Range: $21.00–$22.00
❌ Stop-Loss: Below $19.00 (channel breakdown invalidation)
🎯 Target 1: $35.00
→ 📈 Return: +64.8%
🎯 Target 2: $72.00
→ 📈 Return: +229.3%
⚠️ Key Insights:
Volume spikes during selloff = panic selling, possible capitulation
RSI forming base near 40 → reversal often begins here historically
Macro trend channel still fully intact — just correcting within range
Steep reward potential if entry is timed at support
💬 Will PRMB complete the retest and deliver a massive swing?
🎯 Precision setups like this don't come often — add it to your watchlist now.
#PRMB #ChannelTrading #SwingSetup #LongTermReversal #HighReward #TechnicalSetup #TargetTraders

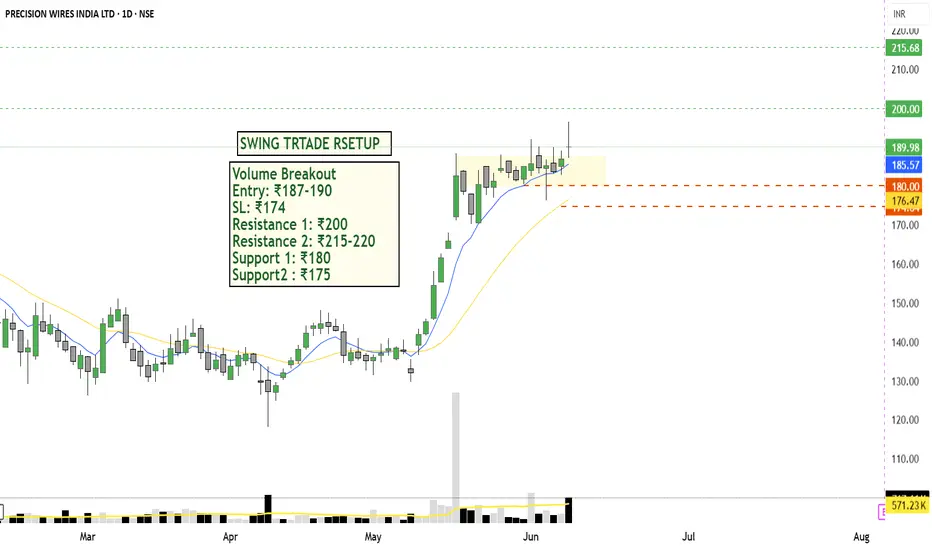
Precision Wires India Ltd: Breakout + Fundamental Bullish SetupTechnical Analysis (Daily Timeframe)
Breakout Pattern: consolidation breakout with Strong bullish DOJI candle above ₹185–₹187
Volume Confirmation: with a spike in volume (767.6K vs avg 571.2K)✅ Yes
Trend: Strong uptrend; Higher Highs & Higher Lows
Bullish momentum intact Price above 20 EMA & 50 EMA
FUNDAMENTALS ANALYSIS : Company fundamentals are fully strong, company low debt and high reserves make it fundamentally strong
PROFIT & LOSS:
Company revenue increased YOY
Company net profit good
Profit Margin improved from 3.9% to 4.2% that is the good sign.
🔼 Steady revenue growth with increasing margins shows operational efficiency and cost management.
Fundamental Summary
Parameter Verdict
Earnings Growth : Consistent YoY
Financial Health : Excellent
Promoter Holding: Stable & high
Business Model: Stable & scalable
Trade conclusion:
Strong volume Breakout from Consolidation
Earning Growth and ROCE >15%
Debt free company with high promoters confidence.
Good Sector
📢 Disclaimer: Not investment advice. Do your own research (DYOR). This idea is shared for educational and tracking purposes.
Stock of the Week ! LMND Price Action June 2025Overview
Name: Lemonade, Inc.
Ticker Symbol: LMND
Exchange: New York Stock Exchange (NYSE)
Founded: 2015
Headquarters: New York City, USA
CEO: Daniel Schreiber (as of 2025)
Sector: Financial Services
About
Lemonade is a technology-driven insurance company that uses artificial intelligence (AI) and behavioral economics to disrupt traditional insurance. It offers a variety of insurance products through a mobile-first, digital platform:
Renters insurance
Homeowners insurance
Pet insurance
Term life insurance
Car insurance
Fundamentals
Overview
Statements
Earnings
Revenue
Key Takeways
Lemonade had a robust quarter with growth accelerating to 27% year-on-year to $151 million in Q1 2025., the 6th quarter of year-over-year (YOY) acceleration, and outperforming. The company posted losses this quarter that was less than expected.
Technicals
Price has crossed above the 50-week EMA (~$30) and is now at $38.98, suggesting strong bullish momentum. The 50-day MA also just crossed the 200 day MA forming a golden cross.
It also recently broke out of a falling wedge pattern formation on the 4hr timeframe.
It has formed and broken out a saucer suggesting a price reversal from 2021 on the weekly chart suggesting bullish momentum.
My Take
NYSE:LMND is showing a clear bullish momentum though it has entered overbought RSI signaling a consolidation or pullback near $42-$45 range. I am looking for a potential upside to
$52 by the end of the month.
Position: LMND 40 Call June 20 2025
Quantitly: 10
Average Cost Basis: 1.26
Last Price: 2.33
Total % Gain/Loss: +85%
