Maximize Gains with Options for $UBER: Option Chain Outlook The NYSE:UBER stock price had been in an uptrend until it reached around the $75 level, after which it entered a correction phase. The price is currently near a long-term upward trendline, which could act as strong support.
Volatility: The IVRank (Implied Volatility Rank) is 107.5, indicating that the current volatility is high compared to the values observed over the past year. The IVx value is 73.6, also indicating high volatility.
IVx 5-day Change: +7.8%, showing a significant increase in volatility over the past 5 days. This is common in the period leading up to earnings as investors prepare for the announcement.
Price Skew: The 27.3% skew indicates that call options are more in demand, which could suggest that investors are expecting a bullish movement post-earnings. A solid skew suggests higher demand for call options, indicating a potential bullish sentiment among investors.
IVx (46 DTE): 73.6, indicating high volatility expected over the next 46 days. Volatility is likely to remain high around the earnings report, which is favorable for selling option premiums.
Exp.mV (46 DTE): The expected move over the next 46 days is $7.6, indicating that investors are pricing significant price movement after the earnings report.
Earningsanalysis

PLTR Earnings Options Analysis: Strong SupportsCurrent Price Level: NYSE:PLTR is currently trading around 23.79 USD.
Options Data:
IVRank: 95.8, indicating that the current implied volatility is at the 95.8th percentile over the past 52 weeks.
IV% 5d Change: 16%, showing a significant increase in implied volatility over the past 5 days.
Exp. move at 46 DTE: 4.6% for options expiring in 46 days.
Price Skew: 31.8%, indicating the difference between the bid and ask prices of options.
Market participants overpriced call options by 31.8% for the September expiration, indicating bullish sentiment despite the significant panic in the markets today.
Support Level: There is strong support below the 4/8 level, which is crucial for put options.
The green line represents the strike price expected by the market based on the options chain for 46 days to expiration (46 DTE), around 18 USD.
The Delta 16 PUT level is below the 4/8 Murrey Math level, indicating strong support based on the status of the current optionchain.

Options Analysis for Caterpillar Inc. ($CAT)Key Levels and Indicators:
Current Price: $316.49
IV Rank: 129.5
IV (46 DTE): 58.7%
IV Change (5 Days): +10.2%
Expected Move (46 DTE): $31.4
Price Skew: 3.1% for PUTs (almost neutral)
The market appears to anticipate that the price of NYSE:CAT will remain above this strike price ($280) by the expiration date of 46 days (DTE).
A 5-day change in IV of +10.2% indicates increasing volatility possibly due to upcoming earnings or other significant events + today crash of SP500.
An expected move of $31.4 suggests that the market predicts CAT could move within a $31.4 range from its current price over the next 46 days.
The green horizontal line at $280 represents a critical support level at MurreyMath 2/8.

Long-term bottoms for Position Trade OpportunitiesNASDAQ:TWST reports tomorrow and has been trending up but doesn't have a pre earnings run. However, the stock has completed a long term bottom which provides strong support. Position trade candidate after the earnings volatility settles out. Institutional Holdings are very high.

Stock Pricing Above Fundamentals Ahead of EarningsWeekly Chart: NYSE:ANET reports today after the close.
The stock has a short-term topping formation that is nearly completed. The prior runs went speculative but then corrected. The top is similar to the previous peak and the depth of correction is likely to be similar.
The stock has simply moved beyond fundamental levels. This is NOT likely to turn into a long-term top unless there is something substantially wrong with the company and its products. To become an intermediate-term top, it must have lower highs and lower lows. That is not in the chart at this time.
Ideally, the stock needs to shift sideways to build a much stronger support level to sustain a longer-term uptrend. HFTs are in the mix and may gap the stock on earnings news.

$T cheapest good R:R earnings play2024-07-23 at 3DTE
NYSE:T Jul 26th 16/17 Put Ratio Spread
Options Overlay indicator and Options Screener in action.
Tomorrow before open : Earnings
Max loss: $2.5
Max profit: $97
Bp.req: $200
Bearish micro, bullish macro.
I expect that even in the event of a possible fall, the 4/8 will hold the price.
If it doesn't, then the upward macro trend.
So I went for a pretty safe-looking trade, with the green rage showing the range of returns, so I will sleep well :)
PUTS = CALLS equally priced for 3DTE.

$TFC Options visualization - Earnings at Monday After Close NYSE:TFC Earnings at Monday After Close
Hard PUT pricing skew
Interpolated DELTA16 is far below the STD1
4/8 could be act as support
08/16 at 27DTE
IVx is 35
Exp.move ±2.13
Put pricing skew: PUTs are +77%
more expensive at Exp.mv
09/20 at 62DTE
IVx is 29.5
Exp.move ±2.93
Put pricing skew: PUTs are +49%
more expensive at Exp.mv

Visualize $TSLA CALL pricing skew due to the upcoming earningsLet’s take a look at our new tradingview options screener indicator to see what we observe, as the options chain data has recently been updated.
When we look at the screener, we can immediately see that NASDAQ:TSLA has an exceptional Implied Volatility Rank value of over 100, which is extremely high. This is clearly due to the upcoming earnings report on July 23rd.
As we proceed, we notice that Tesla's Implied Volatility Index is also high, over 70. This means that not only the relative but also the absolute implied volatility of Tesla is high. Because the IVX value is above 30, Tesla’s IV Rank is displayed with a distinguishable black background. This favors credit strategies such as iron condors, broken wing butterflies, strangles, or simple short options.
Next, let’s examine how this IV index value has changed over the past five days. We can see it has increased by more than 6%, indicating an upward trend as we approach the earnings report.
In the next cell, we see a significant vertical price skew. Specifically, at 39 days to expiration, call options are 84% more expensive than put options at the same distance. This indicates that market participants are pricing in a significant upward movement in the options chain.
The call skew is so pronounced that at 39 days to expiration, the 16 delta call value exits the expected range. This signifies a substantial delta skew twist, which I will show you visually.
We see a horizontal IV index skew between the third and fourth weeks in the options chain. This means the front weekly IVX is lower than the IVX for the following week, which may favor calendar or diagonal strategies. Hovering over this with the mouse reveals it’s around the third and fourth week.
In the last cell, we observe that there’s a horizontal IVX skew not just in weekly expirations but also between the second and third monthly expirations.
Now, let’s see how these values appear visually on Tesla’s chart using our Options Overlay Indicator. On the right panel, the previously mentioned values are displayed in more detail when you hover over them with the mouse. The really exciting part is setting the 16 delta curve and seeing the extent of the upward shift in options pricing. This significant skew is also visible at closer delta values.
When we enable the expected move and standard deviation curves, it immediately becomes clear what this severe vertical pricing skew in favor of call options means. Practically, market participants are significantly pricing in upward movement right after the earnings report.
Hovering over the colored labels associated with the expirations displays all data precisely, showing the number of days until expiration and the high implied volatility index value for that expiration. Additionally, a green curve indicating overpricing due to extra interest is displayed. Weekly expiration horizontal IVX skew values appear in purple, and those affected by monthly skew are shown in turquoise blue.
The 'Lite' version of our indicators is available for free to everyone, where you can also view Tesla as demonstrated. Pro indicators are available more than 150 US market symbols like SPY, S&P500, Nvidia, bonds, etfs and many others.
Trade options like a pro with TanukiTrade Option Indicators for TradingView.
Thank you for your attention.

UBER Bearish Harmonic Setup! UBER is in a pretty nice harmonic bearish setup! i have my stop loss (which is trailing) so if we hit profit target one to the down side we can bring the stop loss lower. Let's get it!! 🤘🏻✌️💵🤑

Mind the gap! What next for Broadcom?Broadcom (AVGO) has been a major beneficiary of the AI boom, with its stock soaring 53% since the beginning of 2024 and more than doubling year-to-date. While not reaching the astronomical heights of NVIDIA (NVDA), Broadcom's performance remains remarkable.
The company's Q2 revenue report was a resounding success, showing a 43% year-over-year increase, while EBITDA grew 31% year-over-year. This strong performance prompted Broadcom to announce a 10:1 stock split on July 15th, a move that will make the stock more accessible to smaller retail investors.
The sustainability of this growth in the rapidly evolving AI landscape remains a key question for any AI-related company. However, Broadcom's forward P/E ratio of 35 appears relatively modest compared to its AI peers like NVIDIA (50), CrowdStrike (95), and AMD (46). This suggests that Broadcom may still have room for further valuation expansion.
Following the impressive earnings report, the stock surged 12% on June 13th and continued to trade higher in after-/pre-market activity. The technical picture is also positive, with the price comfortably above its short, mid, and long-term moving averages, indicating strong momentum. The recent surge in volume, reflected in the Volume Oscillator, further underscores the heightened interest in the stock.
While the Relative Strength Index (RSI) is currently in overbought territory at 79.23, this is not unusual following a major earnings announcement. Importantly, the RSI's moving average has been trending upwards since early May, suggesting that the bullish momentum behind AVGO may not be exhausted yet.
Furthermore, the overall market sentiment towards AI remains positive, which could continue to support Broadcom's growth trajectory. Yet it remains important to monitor Broadcom's competitive position in the Semiconductor Solutions & Infrastructure Software market, as the landscape is constantly evolving.
Risk Management: Despite the positive outlook, investors should be mindful of potential risks, such as a slowdown in AI adoption or increased competition, and employ appropriate risk management strategies.

Meta Platforms - Watch the earnings!Hello Traders and Investors, today I will take a look at Meta Platforms.
--------
Explanation of my video analysis:
For more than five years Meta Platforms has been trading in a reverse symmetrical triangle formation. We saw the last retest of support back in the end of 2022 which was followed by a decent rally of +450% towards the upside. At the moment Meta Platforms is retesting the upper resistance of the triangle formation so it is quite likely that we will see at least a short term rejection towards the downside.
--------
Keep your long term vision,
Philip (BasicTrading)

Nvidia Stock Eyes Apple’s 2nd Spot After Monster 30% Gain in MayChip giant racked up nearly $700 billion in market cap last month and is on track to become the world’s second-largest company.
If you’ve been extremely online and following the headlines for a while, you know how this blog will kick off: Nvidia (ticker: NVDA ) crushed, smashed, and shattered all expectations while reporting record profits and revenue. The artificial intelligence (AI) bonanza is so strong it’s literally no-froth-gains-only out there.
Not that much in the loop? Let’s catch you up. For the fiscal first quarter, Nvidia reported record revenue of $26 billion, up 262% year-over year. Along the way, shares of the AI-focused company soared past $1,000 a pop and the stock is now threatening to overtake iPhone maker Apple (ticker: AAPL ) as the world’s second-largest company .
Blink and You’ll Miss It. You Blinked, Right?
Not that long ago — in March 2019 — Nvidia was a little-known GPU provider with its niche found in the gaming sector and the crypto mining corner. And, worth mentioning, it was chugging along as the 84th company in the world by market cap with shares changing hands at $30 a piece.
Fast-track to nowadays, Nvidia’s market cap hovers near $2.7 trillion after gaining a monster 3,755% from its March 2019 lows. It also swooped in as the third-biggest company globally, replacing Amazon (ticker: AMZN ).
Nvidia’s Big Gains Could Dethrone Apple
The AI mainstay picked up more than $700 billion, or 30%, in valuation over May as its shares hit a record high of $1,160. The big leap positioned the company’s market cap less than 10% shy of Apple’s $2.95 trillion. This said, another $250 billion and Nvidia will become the second-biggest company in the world, trailing Microsoft ( MSFT ), valued at $3.2 trillion. That is, if Apple stays where it is now.
The iPhone maker, on the other end of the spectrum, is having a rough year. The victim of a monopoly lawsuit , Apple is witnessing its shares linger around a 3% gain for the year, compared with Nvidia’s 130% rise.
What’s more, spiraling iPhone sales in China added to the brewing troubles.
Can Nvidia Sustain Its Bonkers Revenue Growth?
Looking forward, Nvidia expects to rack up revenue of $28 billion for the current quarter . Recent quarterly performance shows that this type of guidance is not only being met, but it’s being comfortably exceeded.
That’s what happens when you have big tech companies lining up to be your loyal customers. Nvidia is happily selling its hot hardware to the biggest and baddest out there — Microsoft (ticker: MSFT ), Google (ticker: GOOGL ), Tesla (ticker: TSLA ) and privately-held ChatGPT parent OpenAI are all scrambling to get their hands on the powerful chips made by Nvidia.
These heavyweights usually pre-order the good stuff and sign contracts worth billions and billions of dollars, allowing Nvidia to predict how much revenue it will bring in over a quarter.
Coming for That Margin
Investors poured hundreds of billions into Nvidia as they sought to capture the AI train. What this has done to the industry is to propel a single company to the forefront while leaving a huge gap for the rest of the companies that a) have ample amounts of cash to invest, and b) are looking to get a piece of the AI action.
Here’s Nvidia’s weak point: it boasts a huge profit margin. For the past quarter, Nvidia churned out a net income of $14.88 billion on its $26 billion revenue. That’s a clear invitation for other players in the ecosystem to swoop in and attack that profit margin.
Rivals such as AMD (ticker: AMD ) could be looking to get involved in the battle for margin and launch a product that’s slightly better, slightly faster, and slightly cheaper than what Nvidia is making. The incentive is there — the question is when will a rival roll out a competitive product worthy of attention?
Let’s Hear from You!
What’s your take on Nvidia and the AI race? Do you own Nvidia shares or maybe AMD shares? Join the discussion below.

NVIDIA - ready for the earnings?
Regarding Nvidia, we maintain our view that Wave ((iv)) has concluded, and we are currently on the path to completing the overarching Wave 3. We anticipate this wave to reach between $1032 and $1300, which we consider the maximum potential target range for now.
We observed an accumulation phase from June 2023 to January 2024. This area might become significant again, possibly next year, as a zone for placing new entries. Currently, the market has left a lot of imbalances and shows very little volume on the way up because the price has been consistently surging.
With the earnings report due today, we can expect around 8.7% volatility in either direction, depending on the earnings outcome. It’s common to see even greater fluctuations than anticipated during such events. We will find out this evening after the market closes. For now, everything points towards the continuation of the upward trend.
Zooming in, it's clear that since reaching the 461.8% level, where we perfectly completed Wave ((iii)), we have seen the formation of Waves (i) and (ii) in the current move to complete wave ((v)). We anticipate expanding this upwards within the trend channel. Our tentative expectation is that the upcoming earnings report might outperform expectations, which would align with the chart’s indications.
If earnings exceed expectations, we could see a spike to a new all-time high, followed by a retracement marking Wave (iv) and then an overshooting Wave (v).
The target zones for Wave ((v)) are similar to those of Wave 3, lying between the 50% and 61.8% Fibonacci extensions. Specifically, we are looking at a range between $1123 and $1192.
After reaching these levels, we expect a significant pullback towards the Wave 4. This scenario would align with typical Elliott Wave patterns and provide opportunities for strategic entries and exits.

Study of Dark Pool Buy Zones: CRWDNASDAQ:CRWD reports out of season, June 4th. When outlined to eliminate the extreme price action, there is a clear sideways trend. This is a Dark Pool Buy Zone. When the stock moves outside of that zone, it recovers quickly back into the zone.
The huge Black candle was a gap up by HFTs on the last earnings report, followed by pros taking profits. Along with a lack of accumulation at that level, the stock whipsawed back down. The black candles thereafter were smaller funds selling on each bounce. Notice the tiny white candles that follow the black candles (see the orange arrows), patterns that reveal controlled, incremental buying against the selling.
This is a longer sideways trend with stronger support and more definition of the buy zone despite heavy interference from small funds selling in the past couple of months.

3M ($MMM) Beats Profit Estimates Amidst Industry ChallengesAmidst a challenging industrial landscape, 3M Co (NYSE: NYSE:MMM ) emerges as a beacon of resilience, surpassing profit estimates in its latest quarterly report. Despite headwinds such as slow sales and inflationary pressures, the company's strategic initiatives, including price hikes and cost-saving measures, have propelled it to success.
Strategic Adaptations Drive Success:
3M's ability to exceed profit expectations can be attributed to its strategic adaptations in response to changing market dynamics. By implementing price increases and undertaking cost-cutting measures, the company has effectively mitigated the impact of sluggish demand, particularly in its electronics segment. Outgoing CEO Mike Roman's emphasis on operational execution and strategic initiatives underscores 3M's commitment to driving sustainable growth and value creation for shareholders.
Transformational Spin-offs and Streamlined Operations:
In a strategic move to streamline its operations and focus on core competencies, 3M ( NYSE:MMM ) executed the spin-off of its healthcare business, Solventum. This strategic divestiture, coupled with workforce reductions and facility closures, has enabled the company to curb challenging market conditions and position itself for future success. The recent listing of Solventum as a separate entity on the New York Stock Exchange signifies 3M's commitment to unlocking value and maximizing shareholder returns through strategic portfolio optimization.
Financial Performance Exceeds Expectations:
3M's first-quarter results surpassed analyst expectations, with adjusted profit per share of $2.39 and adjusted net sales of $7.72 billion. The company's ability to outperform in the face of industry challenges highlights its operational resilience and strategic foresight. With a dividend payout ratio expected to be 40% of adjusted free cash flow and the potential for further increases post-spin-off, 3M demonstrates its commitment to delivering sustainable shareholder value amidst a dynamic business environment.
Looking Ahead:
With a solid foundation built on strategic initiatives, cost efficiencies, and portfolio optimization, 3M ( NYSE:MMM ) is well-positioned to scale through future challenges and capitalize on emerging opportunities in the industrial sector.
Technical Outlook
3M ( NYSE:MMM ) Stock is up 3.75% trading with a Relative Strength Index (RSI) of 70 which positions the stock in the overbought region. Hence, traders ought to be cautious in case of a trend reversal. In the last 2 weeks, the stock has consolidated in price, gathered liquidity, and formed an upside gap as a result of the Earnings beat forming a "Gapper" pattern.

TESLA EARNINGS 23 APRIL 2024I have clearly explained TESLAs price action. Let me know if you have any questions.I dont see any buying opportunity in it currently.
NOTE: TESLA SHOULD BE AVOIDED FOR LONGS

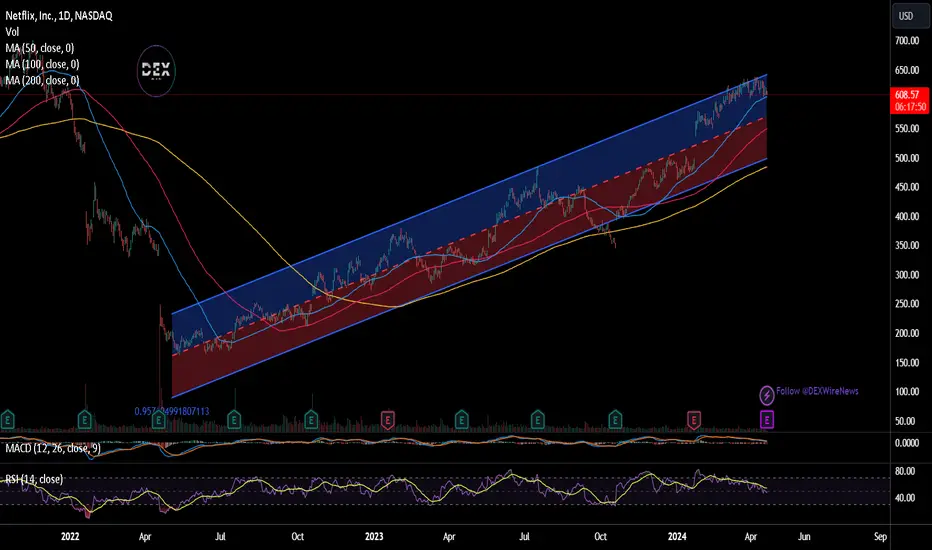
Netflix Faces Subscriber Growth Challenge Netflix has consistently set benchmarks and pushed boundaries. However, as the company gears up to report its earnings, a closer look reveals a nuanced landscape where subscriber growth is no longer a foregone conclusion. The once-lauded crackdown on password sharing, while initially boosting numbers, now presents a plateauing challenge. With the fervor of the pandemic waning, Netflix must navigate through shifting tides to sustain its momentum.
The Password-Sharing Conundrum
Netflix's recent surge in subscriber numbers was partly fueled by its global crackdown on password sharing. Yet, analysts warn that the euphoria from this initiative might be waning, especially in mature markets like the United States. While the crackdown may still yield results in burgeoning markets like India, it's evident that Netflix needs more than a singular strategy to fuel growth.
Diversification Beyond Traditional Models
In a bid to diversify revenue streams and cater to a wider audience, Netflix ( NASDAQ:NFLX ) has ventured into an ad-supported tier. With over 23 million monthly subscribers already onboard, this move marks a significant shift in its business model. Analysts predict that the ad-supported tier could play a pivotal role in mitigating churn and bolstering revenue in the years to come. Moreover, recent price hikes in premium plans could further incentivize users to opt for the ad-supported model, driving up average revenue per user.
Strategic Content Investment
Netflix's commitment to content remains unwavering, with projected investments reaching as high as $17 billion this year. Unlike its competitors, who are trimming content budgets to achieve profitability, Netflix ( NASDAQ:NFLX ) is doubling down on its content strategy. By retaining a flat spending trajectory, Netflix has managed to attract subscribers while securing rights to coveted content. The recent trend of competitors selling exclusive content to Netflix not only reduces churn but also underscores the company's dominance in the streaming arena.
Sports Entertainment: A New Frontier
In a strategic move to diversify its content portfolio, Netflix ( NASDAQ:NFLX ) has entered the realm of sports entertainment. The recent deal with World Wrestling Entertainment (WWE) signals Netflix's intent to tap into the lucrative sports entertainment market without bearing the exorbitant costs associated with traditional sports rights. By acquiring WWE's flagship program, "Raw," Netflix aims to leverage the inherent stickiness of sports content while aligning with its ethos of entertainment-centric programming.
Conclusion:
As Netflix ( NASDAQ:NFLX ) prepares to unveil its earnings report, the spotlight shines on its ability to innovate and adapt in a rapidly evolving landscape. While challenges loom, from plateauing subscriber growth to intensifying competition, Netflix's strategic diversification and unwavering commitment to content position it as a formidable force in the streaming industry. By embracing change, seizing opportunities, and staying true to its vision, Netflix ( NASDAQ:NFLX ) charts a course towards sustained growth and continued relevance in the ever-expanding world of streaming.
ZBH a medical device company falls on earnings beat LONGZBH is a big global medical device company. It is old school. Aluminum titanium polymers, plates screws wires. Hollywood stars are familiar as it makes the devices for leg lengthening surgery. ( shortening is easy, lengthening not so much) I am familiar because in the past I have served as a consultant for this company. It business is mainly orthopedic elective surgery in supporting orthopedic surgeons serving their patients spine straightening to braces for after a neck fracture.
Not a surprise but a lot of surgeries were put off during Covid. So much that the catching up is still ongoing. This is part of the reason why healthcare and the medical technology sectors are expected to be among the hottest of 2024.
So much for fundamentals, the technical analysis support for a long trade is commented on the chart. On it you can see the trend since the last earnings. ZBH reported Thursday, January 7th.
with an earnings beat and a dip in preparation for a possible rip. The lunch hour of Thursday's session would be the next best time while another time is when you find another dip after you
have read this.
Want to trade and hedge your trade? Just take a trade in SYK and let them have a race. Cut the underperformer and use the proceeds to get more of the other. It's a very simple plan.
Want a broad trade in medical technology? Take a look at XBI or leveraged LABU.

Bottom Formation with Dark Pool Buy Zones: DISNYSE:DIS reports earnings next week and is attempting to complete the bottom formation that started last summer. The stock must now sustain above the bottom completion level at $95.
Even though the market is over-speculating many index components, this stock is more likely to have sideways trends or platforms if the price holds above the new support level to complete its bottom.
Dark Pool buy zones are evident within the bottom formation, providing fundamental and technical support.

3M (MMM) Navigates Challenges and Beats Earnings Estimates
In a recent quarterly report, multinational conglomerate 3M ( NYSE:MMM ) showcased resilience in the face of challenges, beating earnings estimates for the fourth quarter of 2023. The maker of iconic products like Post-it notes and Scotch tape reported adjusted earnings of $2.42 per share, surpassing the Zacks Consensus Estimate of $2.31 per share. This marks a positive trend for the company, which has consistently outperformed earnings expectations over the last four quarters.
Earnings Performance:
3M's earnings surprise of 4.76% in the latest quarter follows a robust performance a quarter ago, where the company exceeded expectations by a substantial 14.53%. Despite facing headwinds, 3M has demonstrated its ability to adapt and deliver strong financial results. The company's earnings growth from $2.28 per share a year ago to the current $2.42 per share reflects a steady upward trajectory.
Revenue Resilience:
While the quarterly revenues of $8.01 billion slightly fell short of the year-ago figure of $8.08 billion, 3M managed to beat the Zacks Consensus Estimate by an impressive 4.25%. This consistent ability to surpass revenue expectations highlights the company's agility in navigating market challenges.
Guidance and Market Response:
Despite the positive financial results, 3M's stock experienced an 11% drop to a seven-week low after the company provided its earnings guidance for 2024. The projected adjusted earnings of $9.35 to $9.75 per share fell below the consensus estimate of $9.82 per share. The market response underscores the significance investors place on forward-looking guidance.
CEO Perspective and Strategic Initiatives:
3M's Chairman and CEO, Mike Roman, expressed optimism about the company's performance in 2023, citing successful execution of priorities, expansion of operating margins, and progress in organizational restructuring. The CEO emphasized initiatives such as simplifying the supply chain, advancing the healthcare spin-off, and addressing legal matters, including resolving litigation related to products like earplugs for soldiers and environmental concerns.
Investor Concerns and the Path Forward:
The discrepancy between the company's strong quarterly results and the cautious outlook for 2024 raises questions among investors. The potential impact of ongoing legal matters and the restructuring efforts initiated by 3M add an element of uncertainty. Investors are keenly awaiting insights from management during the upcoming earnings call, seeking clarity on the company's strategies to overcome challenges and capitalize on opportunities in the coming year.
Conclusion:
3M's recent financial performance reflects a mix of resilience and caution, with the company navigating challenges successfully in the past year. As investors assess the stock's future potential, the focus shifts to management's commentary on the earnings call, where insights into the company's strategies, risk mitigation, and growth plans will play a crucial role in shaping investor sentiment. 3M's journey in 2024 will be closely watched, and the stock's trajectory may depend on how well the company addresses investor concerns and executes its strategic initiatives.

Stocks at New All-Time Highs Ahead of Earnings: CATThis Dow component attempted a new all-time high and failed. However, it has ample support from the prior sideways trend after the previous all-time high. NYSE:CAT has been over-speculated as it moved out of its bottom low.
The company reports end of January. Watching to see how the stock performs in the next week or so should indicate whether it will be stuck range bound for another couple of quarters or if it will have the fundamentals to support a new high. For now, it has more of the appearance of a range bound sideways pattern developing.
Caterpillar Inc. did well during the years of huge real estate and city development in China. Unfortunately, the great industrial revolution of China is long gone, their population in decline due to fewer births and more deaths reducing their billions. Their consumer-based economy has slammed into Market Saturation as their population continues to age at a faster pace than any nation on earth. CAT needs to find another source for its machinery.

HD: Finally Patterning Out Post-PandemicNYSE:HD benefited greatly from the pandemic lockdown and the numerous stimulus checks that over-stimulated all nations' economies.
The stock has now moved above its trading range and has sustained, aka held onto, those gains.
This patterns out the excessive revenues and earnings that were inevitably unsustainable for all of the companies that benefited from the brief surge of revenues due to the "over-stimulus checks."
This is the Weekly Chart to show that the Year over Year comparatives that harmed HD for a couple of years is now patterned out.

Controlled Sideways Trends Ahead of EarningsThe Giant Banks and Credit Card companies benefit the most from the Federal Reserve Board's overnight interest rate hikes. As the FRB increases its lending rate, it allows big banks and credit companies to increase their interest rates to consumers, small businesses, etc. That usually means higher revenues.
NYSE:V is in a sideways trend that is not as consistent as would be ideal ahead of its earnings report in about 3 weeks. However, HFTs are aware of the tendency for credit card companies to prosper during high interest-rate markets.
Study the candlestick patterns: Note the quick reversal back down after a higher price level was reached. Note the rebound the same day when price dropped out of the lows of this sideways trend. There is control in this pattern which is typical of Professional trading activity.
