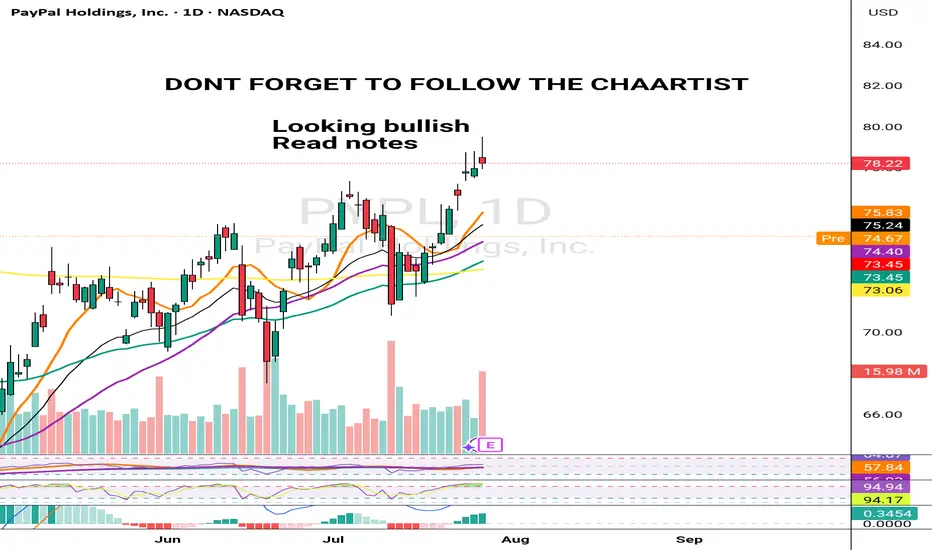
PYPL LOOKING BULLISH JULY 29 2025Pypl is lloking good to go long. Whenever I trade at current price rule is clear that you manage your risk and quantities properly. Dont blindly trade in a hope to make quick money. Pypl looking good to go to $85 soon
Earningsplay
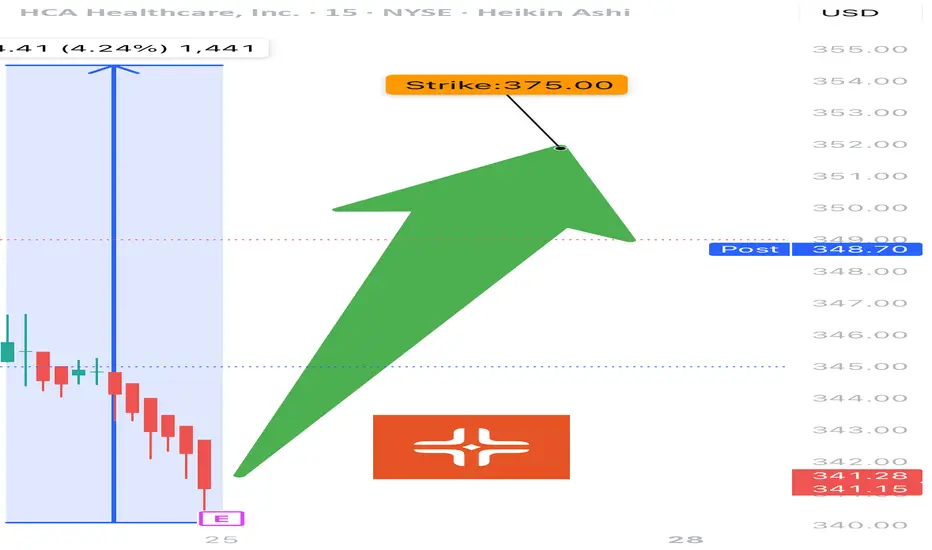
HCA EARNINGS TRADE (07/24)
🚨 HCA EARNINGS TRADE (07/24) 🚨
🏥 Healthcare with earnings tonight after close — high-upside setup brewing.
🧠 Quick Breakdown:
• 📊 Revenue Growth: +5.7% (stable, defensive sector)
• 💸 Margins: Operating 15.6%, EBITDA 19.9% = efficient and strong
• 🧠 Beat Rate: 75% with 6.7% avg surprise → credible upside
• 📉 RSI: 22.5 → OVERSOLD and primed for bounce
• 💬 Whisper sentiment strong from sector peers (e.g., Tenet)
• 🔥 Analysts target: $391.54 → 13.8% upside
💥 TRADE SETUP
🟢 Buy HCA $375 Call exp 8/15
💰 Entry: $3.90
🎯 Target: $11.70 (200–300%)
🛑 Stop: $1.95
📈 Confidence: 73%
⏰ Entry: Before Close Today (Pre-Earnings)
📆 Earnings: Today After Market (AMC)
📊 IV Rank: 0.60 → fair pricing
📉 Expected Move: ~5%
⚠️ RSI this low + sector strength = earnings bounce candidate. Watch the $375 breakout zone. 🎯
#HCA #EarningsPlay #OptionsTrading #HealthcareStocks #UnusualOptionsActivity #CallOptions #TradingView #DayTrading #OversoldBounce #EarningsSeason
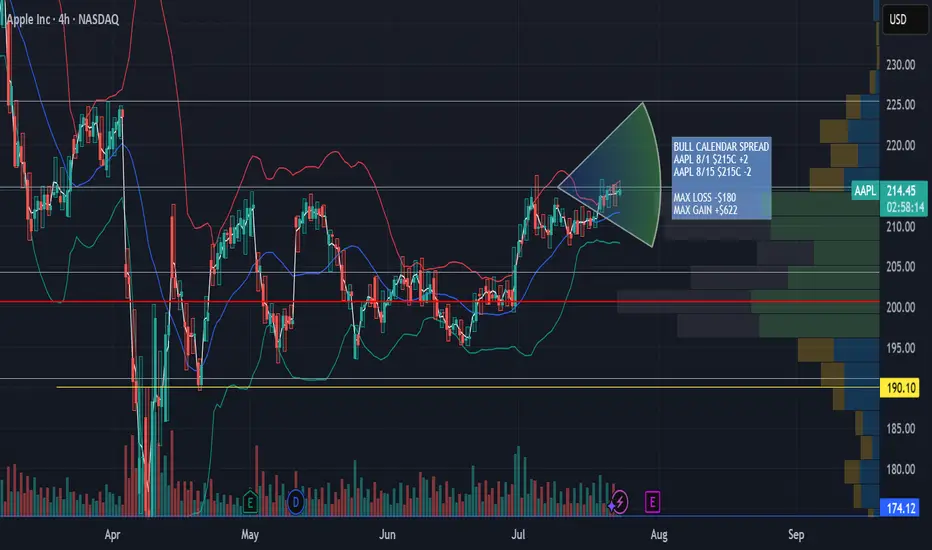
AAPL Aug 1st - Aug 8th 215 Calendar Call SpreadAAPL Aug 1st - Aug 8th 215 Calendar Call Spread
AAPL earnings after market close 7/31/25. Looking for an upward move into earnings with resistance at $225 then retesting support at $215. This zone falls between the .5 and .618 fib retracement. Great risk/ reward ratio 3.5:1
TESLA POST EARNING 24 JULY 2025This is Post earning analysis for Tesla . I have clearly explained all the levels. Please trade carefully & try to stick to your plan.
NOTE: FOLLOW THE LEVELS

AAPL LIVE PRICE ACTION JULY 23 2025This is the price action for AAPL. I have discussed indicators as well. Do not blindly trade without understanding the logics. I am long here with stocks only.
NOTE: DO NOT BLINDLY BUY

ALK LOOKING BULLISH 22 JULY 2025ALK is looking good to go long at current price. I am going long as it looks very good. If you dont understand a trade then don't push yourself.
NOTE: LONG WITH STOCKS ONLY

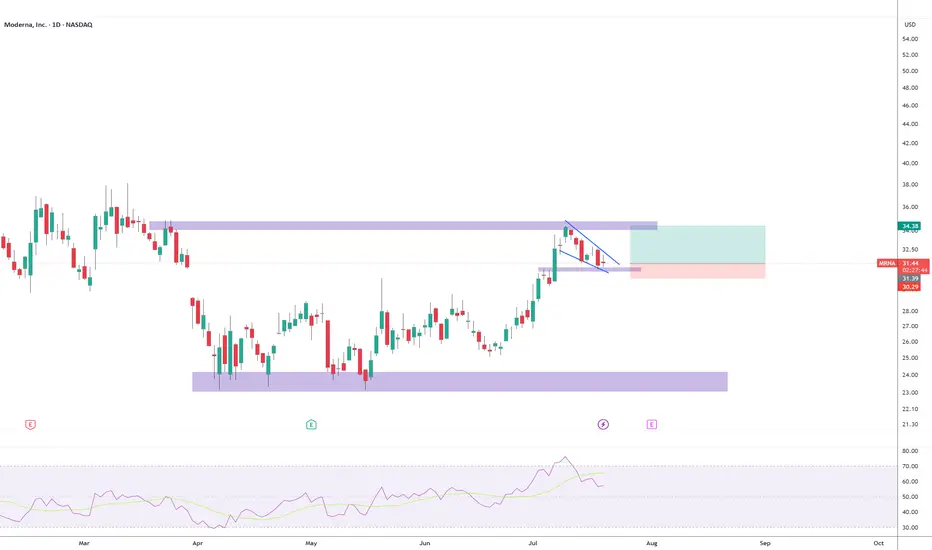
Retest comingBullish flag forming to test the ~$35 resistance again. Earnings coming up on 08/01. I expect the flag breakout before earnings. I have calls exp 08/01 strike 31.5. SL triggers if a daily candle breaks down the support area and closes below 30.30.
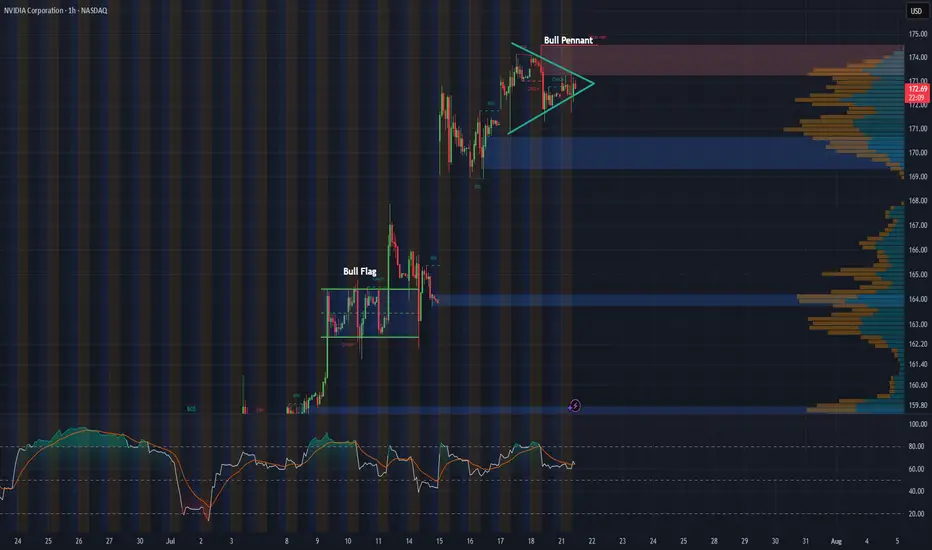
NVDA 1-Hour Chart UpdateHey everyone, just wanted to share a quick update on NVDA’s 1-hour chart. Following last week’s bull flag breakout, the stock appears to be consolidating into what looks like a solid bull pennant formation.
With major tech earnings on the horizon and the recent approval to sell H20 chips to China, this pattern could be setting the stage for another breakout. Will NVDA continue its impressive rally, or is this just a breather before the next move?
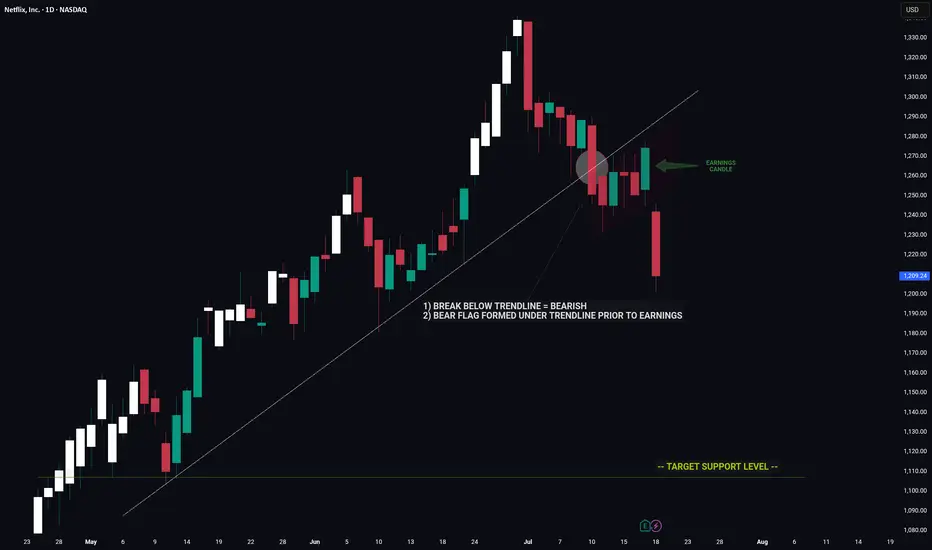
NETFLIX -- Price Signaled A Move Lower Prior To EarningsHello Traders!
The chart of NFLX is a great example of using clues to decipher a future move.
Prior to earnings we had major bearish indicators on the chart that hinted towards a move down on earnings.
1) Break below major trendline
2) Bear flag
These two signals by themselves are very bearish however the fact that these signals appeared coming into earnings was an even strong indicator of a potential for negative move.
Now that the upward trend is broken NFLX has a long way to fall before reaching the next key support level.
Thanks everyone and best of luck on your trading journey!
How We’ll Trade Earnings This Season Earnings season is almost here — and if you're with QS, you’re already holding the most powerful edge in the market.
Let me walk you through how QS trades earnings, why we built 💸earning-signal, and how you can use it most effectively this quarter.
---
📜 A Little History: The Birth of 💸earning-signal
When QS launched in early April, we started with just two short-term signals:
⏰0dte
📅weekly-options
Both focused on short-term options trades.
Then came TSLA earnings in late April. That’s when we launched our very first 💸earning-signal — and nailed the prediction.
Since then?
We’ve had one of the best earnings win streaks on the internet. Period.
📌 Don’t take my word for it — check:
#✅signal-recap for the track record
#🤑profits and #🤩member-testimonials for real wins from members
---
🤖 Why We Built a Separate Earnings Signal
Earnings are not regular trading days. The dynamics are completely different.
On normal days, a stock might move <1%
On earnings? 10–20% swings are common
This is what we call a “pivot event” — and it requires a different engine to predict.
That’s why we separated:
📅 #weekly-options → normal day-to-day setups
💸 #earning-signal → high-volatility earnings plays
---
🧠 How a Human Would Trade Earnings...
If you wanted to manually trade an earnings report, you’d need to analyze:
Past earnings reactions
Analyst expectations
Earnings call language
Financial statement surprises
Options IV & skew
Post-earnings stock behavior
This would take hours (or days) — and most retail traders don’t have time.
---
⚙️ How QS AI Does It Instead
We built 💸earning-signal to do all that work for you — and more.
✅ It pulls in all the data above
✅ Runs it through 5 top LLM models (each acts as an independent analyst)
✅ Aggregates their insights + calculates probability-weighted direction & strategy
✅ Uses fine-tuning to learn from its past prediction success/failures
This means: faster decisions, deeper insights, and better accuracy — every week.
We don’t just run predictions. We let the AI learn from past mistakes and self-improve each quarter.
---
💥 Results Speak for Themselves
Last season, we nailed:
TSLA
MSFT (10x–20x winners!)
NVDA
AAPL
And many more...
All based on this unique AI-driven earnings analysis stack.
This season?
We’re going harder, faster, and even smarter. 📈
🎯 The goal is clear:
Make 💸earning-signal the #1 earnings prediction system in the world.
---
🧩 Final Notes
Earnings are 10x harder to trade than regular days
But with QS, you’re equipped with 500x the speed and insight of an average trader
Upgrade if you haven’t yet: #💰upgrade-instructions
Earnings season kicks off next week
Let’s get it.
Let’s win big.
Let’s make season 2 of 💸earning-signal our most legendary yet. 🚀💸

Hims is OVERBOUGHT Market Context ✨
NYSE:HIMS | Current Price: $42.00
1-Month Move: +17.5% (from $35.75)
1-Year Move: +68.2% (from $25.00)
Year High/Low: $43.50/$24.80
Technicals
RSI: ~75.8 (overbought )
Moving Averages: Above 20-day, 50-day, and 200-day MAs (strong uptrend, but overextended )
MACD: Bearish divergence forming (momentum fading, potential reversal )
Trade Setup
Direction: PUT
Entry Price: $42.00
Take Profit 1 (TP1): $36.00 (~14.3% gain )
Take Profit 2 (TP2): $30.00 (~28.6% gain )
Expected Move: ~12–15% downward
Best AI Signals on the market

AMD Earnings About To PrintTechnical Analysis NASDAQ:AMD
RSI: 🟡 Near overbought but showing strength
MACD: 🟢 Bullish crossover in progress
Support: $96.84 → $93.64 → $90.00
Resistance: $100.75 → $101.72 → $103.96
Key Level to Watch: $100.75 (immediate resistance)
💰 Earnings Play
🎯 Trade Signal: BUY
✅ Justification
Recent uptrend confirmed by bullish MACD crossover with price action above key short-term MAs. Strong momentum heading into earnings with positive sentiment from analysts.
⚠️ Risk Management
Stop Loss: $93.64 (-5.2%)
Expected Range: $93.64 to $103.96
Best AI Generated Signals.
Stay Alpha

AMD BULLISH MAY6TH 2025AMD has its earnings today & I am bullish as per the price action. I have managed my risk, and I am long irrespective of any news. I have discussed in depth analysis of AMD. If you have any questions, feel free to leave a comment below.
NOTE: I AM LONG ONLY WITH STOCKS

IBM Earnings PlayTechnical Analysis NYSE:IBM
On the 4-hour chart, IBM’s stock price is currently trading at approximately $260.50. Applying Bollinger Bands, the price is hovering near the 20-period moving average, with the bands moderately contracted, indicating relatively low volatility. The stock has shown resilience above the lower Bollinger Band, suggesting potential for an upward move if bullish momentum builds post-earnings. A recent green candle indicates buying interest, but the stock remains below the upper band, which sits near $270.00, signaling room for upside if catalysts align.
Target
Wait for bullish confirmation post-earnings.
Entry LONG : Around $262.00, Targeting $270.00.
Secondary Target: $275.00.
Resistance Levels: $265.00, $270.00, $275.00.
Support Levels: $255.00, $250.00, $245.00.
The price is testing the 20-period moving average, and a strong earnings report—particularly with positive AI or cloud revenue updates—could push the stock toward the upper Bollinger Band at $270.00 or higher. Conversely, a disappointing earnings report or weak guidance could see the price drop toward $255.00 or lower, especially if broader market conditions weaken.
QuantSignals
Best AI news analysis and signals

BOEING EARNINGS ABOUT TO PRINT Fundamental Outlook NYSE:BA
Boeing is heading into its Q1 2025 earnings with notable challenges. Ongoing quality-control issues, supply chain disruptions, and a reported negative profit margin are creating headwinds. Additionally, recent negative publicity surrounding production delays and regulatory scrutiny may further dampen investor sentiment. While potential defense contract wins or positive updates on 737 MAX production could provide a lift, the risk of a disappointing earnings report remains high, especially in a volatile aerospace sector.
Technical Analysis (Using Bollinger Bands Strategy)
On the 4-hour chart, Boeing’s stock price is currently trading at $175.46, as seen in the provided chart. Applying Bollinger Bands, the price has recently broken below the lower band, signaling a potential oversold condition but also confirming a strong bearish momentum. The price has been trending below the 20-period moving average within the bands, with the bands widening—a sign of increased volatility. This setup suggests a continuation of the downward move, especially with the recent sharp decline highlighted by the red arrow in the chart.
Target
Wait for bearish confirmation
Entry SHORT: Around $165.50, Targeting $152.00.
Secondary Target: $146.00.
Resistance Levels: $180.00, $185.00, $188.60.
Support Levels: $165.00, $155.00, $148.00.
The price is struggling to reclaim the 20-period moving average, and with earnings approaching, a breakdown below $170.00 could accelerate the decline toward $165.00 or lower. However, a positive earnings surprise—such as strong delivery numbers or improved guidance—could push the price back toward the upper Bollinger Band near $185.00.
QuantSignals.
Best AI news analysis and signals

TESLA 22 APRIL 2025This is my analysis for Tesla irrespective of its earnings. If yoiu have any doubts feel free to leave a txt.
I am long with proper RR & risk management

Solid Q1 Earnings amid Tariff Turbulence Spike S&P500 VolatilityAs Q1 earnings roll in, Wall Street is digesting a rare divergence: strong fundamentals across much of corporate America paired with deepening investor anxiety. While companies are largely beating expectations, looming tariff shocks and tech sector fragility are suppressing sentiment—and returns.
Tactical positioning is crucial at times like this. This paper describes the outlook for the coming earnings season and posits options strategies that astute portfolio managers can deploy to generate solid yield with fixed downside.
Resilient Earnings Growth in the Current Season
The Q1 2025 earnings season is underway, and early results show resilient growth despite an unsettled backdrop. According to a Factset report , with about 12% of S&P 500 firms reporting so far, 71% have beaten earnings estimates and 61% have topped revenue forecasts.
Blended earnings are tracking about +7.2% year-over-year, on pace for a seventh-straight quarter of growth. However, only two sectors have seen improved earnings outlook since the quarter began (led by Financials), while most others have faced modest downgrades.
Forward guidance is also skewing cautious – roughly 59% of S&P companies issuing full-year EPS forecasts have guided below prior consensus, reflecting corporate wariness amid macro uncertainty.
Source: Factset as of 17/April
Financials Front-Load the Upside
The first wave of reports was dominated by major banks, which largely delivered strong profits and upside surprises. Volatile markets proved a boon to trading desks: JPMorgan’s equities trading revenue surged 48% to a record $3.8 billion, and Bank of America’s stock traders hauled in a record $2.2 billion as clients repositioned portfolios around tariff news.
Source: Factset as of 17/April
These tailwinds – along with still-solid net interest income – helped lenders like JPMorgan and Citigroup post double-digit profit growth (JPM’s Q1 earnings up 9% to $5.07/share; Citi’s up 21% to $1.96). FactSet notes that positive surprises from JPMorgan, Goldman Sachs, Morgan Stanley and peers have boosted the Financials sector’s blended earnings growth rate to 6.1% (from 2.6% as of March 31), making it a key contributor to the S&P 500’s overall gains.
Even so, bank executives struck a wary tone. JPMorgan’s CEO Jamie Dimon cautioned that “considerable turbulence” from geopolitics and trade tensions is weighing on client sentiment. Wells Fargo likewise warned that U.S. tariffs could slow the economy and trimmed its full-year net interest income outlook to the low end of its range. Across Wall Street, management teams indicated they are shoring up reserves and bracing for potential credit headwinds if import levies drive up inflation or dent growth.
Tech Titans Under Scrutiny
Attention now turns to the yet-to-report mega-cap tech firms, which face a very different set of challenges. Stocks like Apple, Amazon, Microsoft, and Alphabet – collectively heavyweights in the index – have been battered by the escalating trade war, eroding some of their premium valuations.
Apple’s share price plunged over 20% in early April on fears that new tariffs could jack up the cost of an iPhone to nearly $2,300, underscoring these companies’ exposure to global supply chains.
The tech sector’s forward P/E remains about 23 (well above the market’s 19), leaving little room for error if earnings guidance disappoints. With Washington’s tariff barrage and retaliatory threats casting a long shadow, Big Tech finds itself on the front line of the global trade war, suddenly vulnerable on multiple fronts. Any cautious outlook from these giants – which account for an outsized share of S&P 500 profits – could heavily sway overall forward earnings sentiment.
Market Context and Reaction
Despite solid Q1 fundamentals, equity markets have been whipsawed by macro headlines. The S&P 500 slid into correction territory, falling roughly 10% since the start of April and about 14% below its February peak, as investors de-rated stocks in anticipation of tariff fallout and a potential economic slowdown. Consumer inflation expectations have skyrocketed with risk delaying rate cuts in the near-term.
This pullback has tempered valuations somewhat – the index’s forward P/E has eased to ~19 (down from ~20 at quarter-end) – even though consensus earnings estimate for 2025 have only inched down. Notably, the high-flying “Magnificent Seven” mega-cap stocks that led last year’s rally are all sharply lower year-to-date (Alphabet –20%, Tesla –40%), a stark reversal that has dented market breadth and sentiment.
Source: Factset as of 17/April
Investors are rewarding only the strong earnings winners: for instance, Bank of America’s stock jumped over 4% after its earnings beat, and JPMorgan rose 3% on its results. Such reactions imply the market is discriminating – strong execution is being acknowledged even as the broader mood remains cautious.
Source: Factset as of 17/April
Hypothetical Trade Setup
Solid corporate performance is offset by significant macro risks, warranting a nimble and selective approach. While recent positive earnings may provide a short-term boost, downbeat sentiment and concerns over future tech earnings could limit gains.
In this uncertain environment, investors may adopt a fundamentally driven view that the S&P 500 could rise in the near term due to strong earnings. However, the upside appears limited, supporting the case for a bullish call spread.
Earnings release dates for the Super 7
With major tech firms set to report earnings in early May, investors can consider the 2nd May MES Friday weekly options. A narrow bull call spread offers a higher probability of profitability. In this hypothetical setup, the long call is at 5,250 and the short call at 5,390, resulting in a breakeven point of 5,312 at expiry. This position requires net premium of USD 315/contract (USD 62.5/index point x 5). The position returns a max profit of USD 385/contract for all strikes > 5,390 and a max loss of USD 315/contract for all strikes < 5,250.
This strategy is most successful when the S&P 500 rises slowly. A simulation of this scenario using the CME QuikStrike Strategy Simulator has been provided below.
MARKET DATA
CME Real-time Market Data helps identify trading set-ups and express market views better. If you have futures in your trading portfolio, you can check out on CME Group data plans available that suit your trading needs tradingview.com/cme .
DISCLAIMER
This case study is for educational purposes only and does not constitute investment recommendations or advice. Nor are they used to promote any specific products, or services.
Trading or investment ideas cited here are for illustration only, as an integral part of a case study to demonstrate the fundamental concepts in risk management or trading under the market scenarios being discussed. Please read the FULL DISCLAIMER the link to which is provided in our profile description.

Comerica (NYSE: CMA) Reports First Quarter 2025 Earnings ResultsComerica Incorporated (NYSE: NYSE:CMA ), together with its subsidiaries, a company that provides financial services in the United States, Canada, and Mexico reported her first quarter 2025 earnings results today before the bell.
The results are available on the Investor Relations section of Comerica's website: c212.net
Technical Outlook
Prior the earnings, shares of Comerica Incorporated (NYSE: NYSE:CMA ) are up 1.28% in Monday's premarket session. The asset is trading in tandem with the support point of $52, a break above the 38.2% Fib level could set the pace for a bullish reversal albeit the stock was already consolidating as hinted by the RSI at 46.
Financial Performance
In 2024, Comerica's revenue was $3.20 billion, a decrease of -8.79% compared to the previous year's $3.50 billion. Earnings were $671.00 million, a decrease of -21.43%.
Analyst Forecast
According to 21 analysts, the average rating for CMA stock is "Hold." The 12-month stock price forecast is $67.43, which is an increase of 27.35% from the latest price.

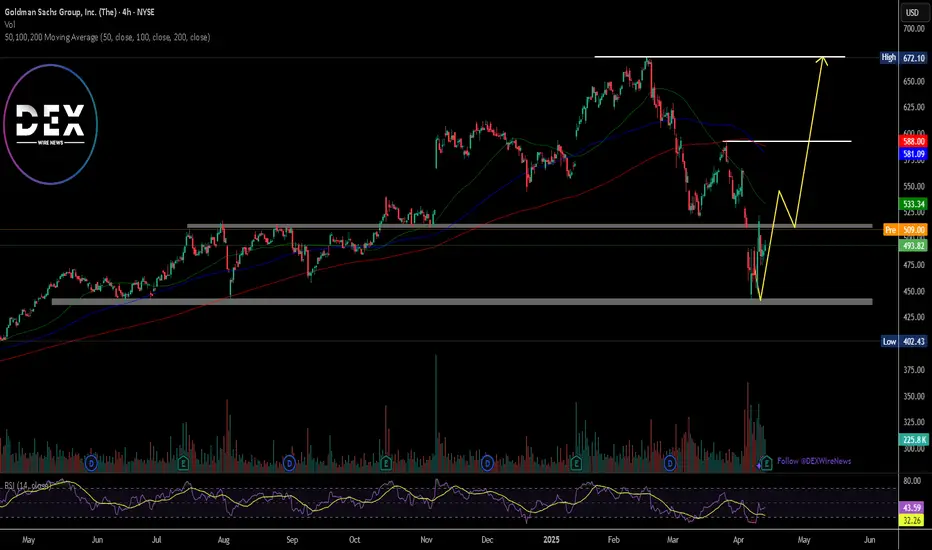
Just In: The Goldman Sachs Group, Inc. (GS) Set for Breakout The Goldman Sachs Group, Inc. (GS) shares is set for a breakout today as the firm smashes Q1 Estimates leading to a 2.45% surge in Monday's premarket trading.
Reports Overview
Goldman Sachs delivered a strong first-quarter performance, beating Wall Street expectations on both earnings and revenue, thanks to a record-setting quarter in equities trading. The bank posted earnings of $14.12 per share versus an expected $12.35, with revenue reaching $15.06 billion compared to forecasts of $14.81 billion.
Financial Performance
In 2024, The Goldman Sachs Group's revenue was $52.16 billion, an increase of 15.34% compared to the previous year's $45.23 billion. Earnings were $13.48 billion, an increase of 71.52%.
Analyst Forecast
According to 16 analysts, the average rating for GS stock is "Buy." The 12-month stock price forecast is $593.43, which is an increase of 20.02% from the latest price.
Technical Outlook
Prior our last analysis on NYSE:GS stock, the asset is already approaching the short term resistant point and a break above that pivot would cement the path for a bullish campaign for NYSE:GS shares . As hinted by the RSI at 43, NYSE:GS shares has more room to capitalize on the dip and pull on a bullish campaign today.
All eyes are set on the $520 level, should NYSE:GS shares break that pivot, a bullish breakout might be inevitable.
JPMorgan Chase Reports Earnings Today, Topping Q1 EstimatesShares of JPMorgan Chase (NYSE: NYSE:JPM ) are currently up 3% in Friday's premarket session as the asset tops Q1 estimates.
The company reported better-than-expected fiscal first-quarter results as big banks kicked off the new earnings season.
The banking giant reported earnings per share (EPS) of $5.07 on revenue of $45.31 billion, each up from $4.44 and $41.93 billion, respectively, a year ago. According to estimates compiled by Visible Alpha, some analysts had expected $4.64 and $43.55 billion. It generated $23.4 billion in net interest income (NII), above the $23.00 billion consensus.
Shares of JPMorgan were up 3% immediately following the release of Friday's report. They entered the day down roughly 5% year-to-date but up about 16% in the last 12 months.
"The economy is facing considerable turbulence (including geopolitics), with the potential positives of tax reform and deregulation and the potential negatives of tariffs and 'trade wars,' ongoing sticky inflation, high fiscal deficits and still rather high asset prices and volatility," JPMorgan CEO Jamie Dimon said. "As always, we hope for the best but prepare the Firm for a wide range of scenarios."
Dimon wrote in his annual letter to shareholders this week that he expected the Trump administration's tariffs "will slow down growth."
technical Outlook
As of the time of writing, NYSE:JPM shares are already up 1.5% with the asset trading above the support point. A break above the 1-month high pivot could set the course for a bullish campaign eyeing the $260- $280 region.
With the last close RSI at 46, NYSE:JPM shares has more room to capitalize on the dip and make a comeback prior the earnings beat.

Breaking: Delta Air Lines, Inc. (NYSE: $DAL) Surged 8% TodayShares of Delta Airlines, Inc (NYSE: NYSE:DAL ) surges 8% today after the company reported adjusted earnings per share (EPS) of $0.46 on operating revenue of $14.04 billion. Analysts polled by Visible Alpha had forecast $0.39 and $13.89 billion, respectively.
The company which provides scheduled air transportation for passengers and cargo in the United States and internationally reported passenger revenue per available seat mile (PRASM) of 16.78 cents and cost per available seat mile (CASM) of 19.69 cents; analysts had expected Delta to lose about 2.8 cents per ASM transporting passengers. Delta and domestic rivals United Airlines (UAL), American Airlines (AAL), and Southwest Airlines (LUV) all were profitable but lost money flying passengers in 2024.
Delta said it expects second-quarter revenue to rise or decline by 2% and adjusted EPS from $1.70 to $2.30, below the $2.41 consensus. The airline said it is not affirming or updating full-year projections at this time "given current uncertainty."
Analyst Forecast
According to 14 analysts, the average rating for DAL stock is "Strong Buy." The 12-month stock price forecast is $64.56, which is an increase of 68.30% from the latest price.
Technical Outlook
As of the time of writing, NYSE:DAL shares are up 6.69% trading within a bullish pattern. The asset has more to run as hinted by the RSI at 31. NYSE:DAL 's chart pattern shows a bullish engulfing candlestick and a break above the $45 pivot point could cement the path for a bullish move to the 1-month high.

Apparatchik Trump Says 'No.. More Pain' Ahead of Amazon EarningsPresident Trump's new tariffs have had a significant negative impact on Amazon's stock performance, revenue, and earnings, primarily due to increased costs and supply chain disruptions.
Here below is a detailed analysis of these effects.
Impact on Amazon's Stock Performance
Amazon's stock has seen substantial declines following the announcement of Trump's tariff plan. The company's shares dropped nearly 7% within two days of the announcement and are down nearly 21% year-to-date. These tariffs have exacerbated existing challenges for Amazon, which was already struggling in early 2025 with a 13% decline in stock value during the first quarter. The broader market also suffered, with technology stocks experiencing sharp declines as investors reacted to fears of higher costs and inflation.
Revenue Challenges
Amazon's reliance on Chinese suppliers for merchandise has made it particularly vulnerable to the newly imposed tariffs. Over 50% of Amazon's top third-party sellers are based in China, and many of their products are subject to hefty import taxes, including a 34% tariff on Chinese goods. These tariffs increase landed costs for a significant portion of Amazon's inventory, forcing sellers to either absorb the additional expenses or pass them on to consumers through higher prices. This could lead to reduced consumer demand, as higher prices may deter shoppers from purchasing goods on Amazon's platform.
Additionally, the elimination of duty exemptions on minor imports—previously advantageous for discount platforms such as Temu and Shein—has disrupted Amazon's competitive pricing strategy. While this change may level the playing field among e-commerce platforms, it also raises operational costs for Amazon's marketplace vendors who had relied on these exemptions.
Earnings Pressure
The tariffs are projected to slash Amazon's annual operating profits by $5 billion to $10 billion due to increased merchandise costs. Goldman Sachs estimates that these costs could rise by 15% to 20%, further straining profitability. While Amazon has historically maintained lower prices compared to competitors, absorbing these increased expenses without raising prices significantly may be unsustainable in the long term.
Moreover, fears of inflation resurgence due to Trump's trade policies could further dampen consumer purchasing power. This would likely lead to lower sales volumes and additional pressure on profit margins across Amazon's retail operations.
Potential Mitigation Strategies
To counteract these challenges, Amazon may implement several measures:
Vendor Negotiations. The company could negotiate with suppliers to share the burden of increased input costs rather than bearing them entirely.
Price Adjustments. Selective price increases on certain products may help offset rising costs without alienating customers entirely.
Supply Chain Diversification. Shifting sourcing away from heavily tariffed regions like China or focusing more on domestic suppliers could reduce exposure to trade disruptions.
Focus on Services. Amazon’s cloud division, AWS, contributes significantly to its operating income (58% in Q4 2024) and remains largely unaffected by tariffs. Increased emphasis on AWS could help mitigate losses from retail operations.
Technical challenge
The main technical graph indicates on Bearish market in development, with nearly 30% potential to further decline, down to major 10-year average support.
Conclusion
Trump’s tariffs have created substantial headwinds for Amazon by driving up costs and disrupting its supply chain. These challenges have led to stock declines, reduced revenue potential, and significant earnings pressure. While Amazon is exploring mitigation strategies such as vendor negotiations and diversification, the long-term impact will depend on how effectively the company adapts its operations amidst ongoing trade tensions.
--
Best 'Apparatchik' wishes,
PandorraResearch Team 😎

Breaking: nCino, Inc. (NASDAQ: $NCNO) Tanks 33% In Premarket nCino, Inc., (NASDAQ: NASDAQ:NCNO ) a software-as-a-service company, that provides cloud-based software applications to financial institutions in the United States and internationally saw its shares plummet 32.93% in Wednesday's Premarket trading amid slowing growth in cloud banking and mortgage markets.
nCino shares slumped in after hours trading Tuesday (April 1) extending the loss to Wednesday's (April 2) premarket trading in the wake of guidance that anticipates slowing growth in the core cloud banking segments and mortgage markets, though a reacceleration is envisioned for fiscal year 2027.
in the current fiscal year (2026) first quarter, top-line growth should be in the high single-digits year over year, to a range of roughly $139 million to $140.7 million, which would be a slowdown from the 14% growth rate notched in the most recent quarter. Fiscal year guidance also disappointed investors, who sent the shares down by 28%.
The company also announced the appointment of Sean Desmond as CEO, succeeding Pierre Naudé, who becomes executive chairman.
Financial Performance
In 2024, nCino's revenue was $540.66 million, an increase of 13.45% compared to the previous year's $476.54 million. Losses were -$37.88 million, -10.55% less than in 2023.
Analyst Forecast
According to 13 analysts, the average rating for NCNO stock is "Buy." The 12-month stock price forecast is $40.38, which is an increase of 43.60% from the latest price.
Technical Outlook
As of the time of writing, NASDAQ:NCNO is down 32.93% in Wednesday's premarket trading. the asset's daily price chart depicts a bearish pennant or a bearish symmetrical triangle that resorted to the 33% dip. NASDAQ:NCNO shares close Tuesday's session with a RSI of 39.77 which is weaker for a trend reversal and also potent for a continuous trend.
There is a possible chance of a gap down pattern evolving which is a very strong bearish pattern. For now investors will have to wait for a favourable grounds mostly likely the 25 RSI pivot to capitalize on the dip.
