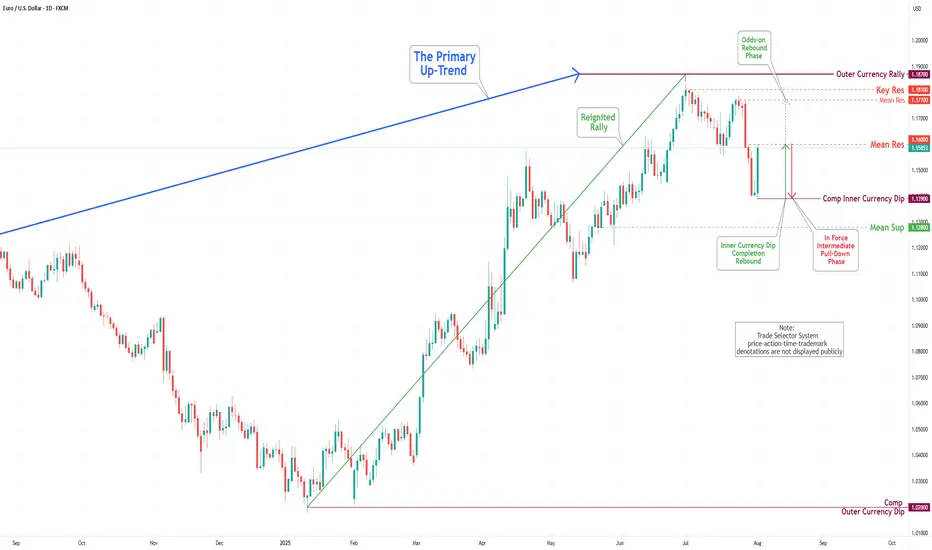
EUR/USD Daily Chart Analysis For Week of August 1, 2025Technical Analysis and Outlook:
In this week's trading session, the Euro experienced a significant drop, reaching the 1.139 level, and completing what is referred to as the Inner Currency Dip. As a result of the completion, the currency reversed direction and made a strong rebound, hitting the Mean Resistance level at 1.160. Recent analyses suggest that the Euro is likely to enter a sustained downward move after retesting the Mean Resistance at 1.160, with the target set to revisit the completed Inner Currency Dip at 1.139. However, it is essential to consider the possibility of continued upward momentum towards the Mean Resistance level of 1.177. Such a movement could trigger a significant rebound and lead to the completion of the Outer Currency Rally at 1.187.
Ecb
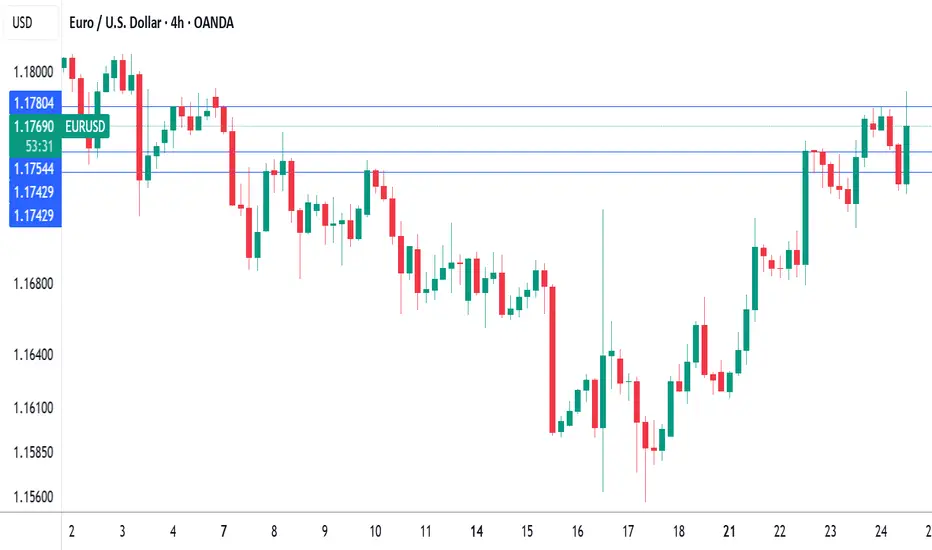
EUR/USD: The Last Bear Standing...As indicated on my previous EUR/USD idea ( that's still currently open ), I remain short EUR/USD given the technical aspect of things are still valid.
Divergences are still in play along with a rising broadening pattern and the fact that we're trading at the yearly R3 level ( which is rare ).
I suspect we will have some volatility with the ECB press conference tomorrow, so that should get things moving hopefully in the bearish direction. If we begin trading aggressively above 1.1800+, that will invalidate the short idea overall.
If we roll over, I'm still looking for 1.13000 - 1.12000 as the target range for Q3 going into Q4.
We'll see how this all develops.
As always, Good Luck & Trade Safe!

EUR/CAD: Shorting the Climactic Rally Near 1.6000The strong rally in EUR/CAD has pushed the pair into extreme territory, approaching a major psychological and structural resistance zone. While momentum has been strong, this looks like a potential climactic or "blow-off" top, offering a highly favorable risk/reward opportunity to short the pair in alignment with the weak underlying Euro fundamentals.
The Fundamental Why 📰
The core thesis remains bearish for the Euro. The European Central Bank (ECB) maintains a distinctly dovish tone, signaling a willingness to ease policy further to support a slowing Eurozone economy. This fundamental headwind suggests that extreme rallies in Euro pairs are often exhaustive and present prime shorting opportunities.
The Technical Picture 📊
Major Supply Zone: The price is entering a critical multi-month supply zone between 1.5950 and the key psychological level of 1.6000. This is a major ceiling where significant selling pressure is anticipated.
Fibonacci Extension: This area aligns with a key Fibonacci extension level (1.272) from the last major impulse wave, a common zone where trending moves become exhausted and reversals begin.
Pronounced RSI Divergence: A clear bearish divergence is forming on the daily chart. As price makes this final push to a new high, the Relative Strength Index (RSI) is making a significantly lower high, signaling a deep exhaustion of buying momentum.
The Counter-Trade Rationale 🧠
This is a high-level fade. We are positioning for a reversal at a major, technically significant ceiling. The extreme price extension, combined with clear momentum divergence, indicates that the risk of buying at these highs is substantial. By shorting here, we are betting that the powerful technical resistance and weak fundamentals will trigger a significant correction.
The Setup ✅
📉 Pair: EUR/CAD
👉 Direction: Short
⛔️ Stop Loss: 1.63230
🎯 Entry: 1.59490
✅ Take Profit: 1.52008
⚖️ Risk/Reward: ≈ 2:1

EUR/USD Daily Chart Analysis For Week of July 25, 2025Technical Analysis and Outlook:
During the previous week's trading session, the Euro experienced an increase following the completion of the Inner Currency Dip at the 1.156 level. It subsequently surpassed two significant Mean Resistance levels, namely 1.167 and 1.172; however, it reversed direction by the conclusion of the trading week. Recent analyses indicate that the Euro is likely to undergo a sustained downward trend, with a projected target set at the Mean Support level of 1.169 and a potential further decline to retest the previously completed Currency Dip at 1.156. Nonetheless, it remains essential to consider the possibility of renewed upward momentum towards the Mean Resistance level of 1.177, which could initiate a preeminent rebound and facilitate the completion of the critical Outer Currency Rally at 1.187.

ECB holds rates as expected, Euro steadyThe euro is showing limited movement on Thursday. In the North American session, EUR/USD is trading at 1.1763, down 0.03% on the day. Earlier, the euro climbed to a high of 1.1788, its highest level since July 7.
The European Central Bank's decision to maintain the key deposit rate at 2.0% was significant but not a surprise. With the hold, the ECB ended a streak of lowering rates at seven consecutive meetings. The ECB has been aggressive, chopping 250 basis points in just over a year.
The ECB statement said that inflation was falling in line with the Bank's forecasts and that future rate decisions would be data dependent. President Lagarde has said that the easing cycle is almost down, but the markets are expecting at least one more rate cut before the end of the year.
The European Union and the United States are locked in negotiations over tariffs, with hopes that an agreement can be reached, on the heels of the US-Japan deal earlier this week. US President Trump has threatened to hit the EU with 30% tariffs if a deal is not made by August 1, but there are signals that the sides will agree to 15% tariffs on European imports, as was the case in the US-Japan agreement.
If an agreement is reached, it will greatly reduce the uncertainty around tariffs and will make it easier for the ECB to lower rates and make more accurate forecasts for inflation and growth.
In the US, Services PMI rose to 55.2 in July, up from 52.9 in June and above the market estimate of 53.0. This pointed to strong expansion and marked the fastest pace of growth in seven months. Manufacturing headed the opposite direction, falling from 52.6 in June, a 37-month high, to 49.5. This was the first contraction since December, with new orders and employment falling.
EURAUD ForecastOANDA:EURAUD is poised to confirm a bearish Head & Shoulders pattern.
The price could move higher today on hopes that the ECB can share some positive news on the economy and interest rates.
The European Central Bank is expected to keep interest rates unchanged, ending a seven-year streak of cuts.
If the price manages to break below the neckline of the pattern, it will open the door for further declines.

EURUSD LONG AND EDUCATIONAL BREAKDOWN ECB INTRESTRATE RELEASE The European Central Bank is expected to hold key rates for the first time in over a year on Thursday.
The Eurozone inflation rate has hit the ECB’s 2% target as the US-EU trade deal uncertainty lingers.
The EUR/USD pair could experience intense volatility following the ECB policy announcements.
The European Central Bank (ECB) is on track to leave its key interest rates unchanged after its July policy meeting, after having reduced rates at each of its last seven meetings. The decision will be announced on Thursday at 12:15 GMT.
The interest rate decision will be followed by ECB President Christine Lagarde’s press conference at 12:45 GMT.

EUR/GBP: Bullish Stance Above 0.8640This signal outlines a tactical long entry on EUR/GBP, positioning for a bullish resolution from today's major fundamental events.
📰 Fundamental Thesis
This position is taken ahead of the two primary market movers: the ECB rate decision and the UK PMI data. The core thesis is that the ECB policy statement will be the dominant catalyst, providing strength to EUR that will outweigh the impact of the UK data release.
📊 Technical Thesis
The trade is defined by a sound technical structure. The stop loss is anchored beneath the critical support zone at 0.8640. The profit target is set to challenge the resistance area just above 0.8722. This setup offers a favorable and clearly defined risk-to-reward profile.
🧠 Risk Management
Execution is timed before extreme event-driven volatility. Adherence to the stop loss is critical to manage the inherent risk of this pre-news strategy.
Trade Parameters
⬆️ Direction: Long (Buy)
➡️ Entry: 0.86690
⛔️ Stop Loss: 0.86344
🎯 Target: 0.87382
✅ Risk/Reward: 1:2

EUR/USD About to Trap the Bears? Final Push Before the Drop! EUR/USD is showing a solid short-term bullish structure, with a move initiated from the demand base around 1.1560, fueling a strong rally toward the current level near 1.1770. Price is now approaching a significant supply zone between 1.1790 and 1.1875, previously responsible for the last major bearish swing. This area also aligns with projected Fibonacci levels (25%-100%), reinforcing its relevance as a possible inflection point.
This movement suggests there’s still room for price to push higher, likely completing the final leg of this bullish cycle before a more convincing short setup develops. At this stage, Fibonacci levels are not acting as firm supports, but rather as hypothetical pullback projections: once price enters the 1.1800–1.1875 area, it will be key to monitor for signs of exhaustion. A rejection here may initiate a bearish retracement toward 1.1670–1.1650, in line with the 62–70.5% fib levels.
Retail sentiment remains highly contrarian: 76% of traders are short, positioning themselves too early against the trend. This imbalance adds fuel for a potential continuation higher, as the market may seek to "squeeze" these premature shorts. Additionally, the COT report confirms growing institutional interest in the euro, with non-commercials increasing their net longs, while USD net long exposure continues to shrink.
Seasonality adds further confluence: late July is historically bullish for EUR/USD, suggesting one final leg up could materialize before a typically weaker August.
✅ Trading Outlook
EUR/USD is technically aligned for a final push toward the 1.1800–1.1875 premium zone, where a potential short opportunity may arise. The rally is currently driven by overextended retail shorts and supportive institutional flows. Only after price interacts with the upper supply zone should reversal signs be evaluated, with correction targets around 1.1670–1.1650. The ideal play: wait for confirmation of bearish intent in August, when seasonal weakness typically kicks in.

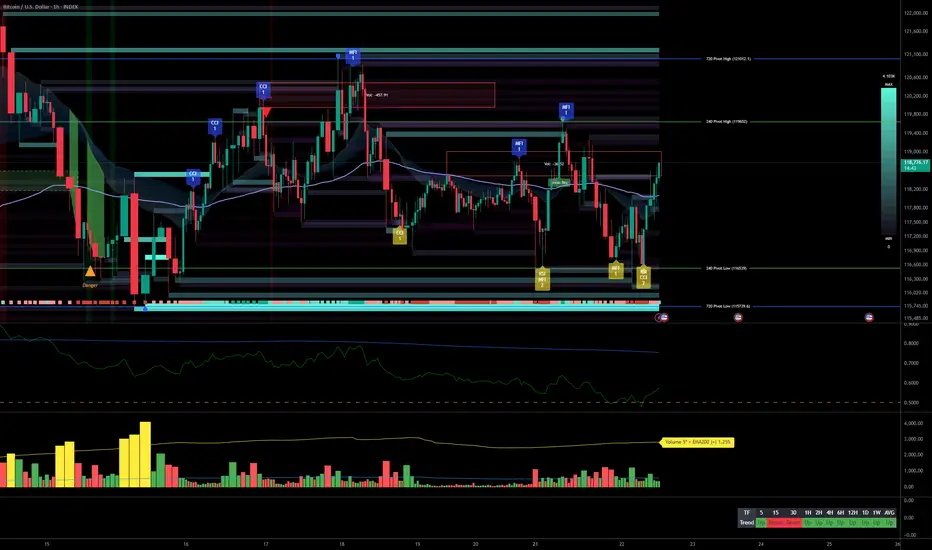
Bitcoin Bullish Momentum, Swing Setups on Support Pre-ECB__________________________________________________________________________________
Technical Overview – Summary Points
__________________________________________________________________________________
Strong bullish momentum confirmed on all timeframes >1H; structure Up.
Major supports: 105100, 111980, 115736; main resistance: 122318 (ATH).
Volumes normal at all timeframes except 30min (very high at lows, institutional absorption).
No behavioral anomaly signals (ISPD DIV neutral, Risk On / Risk Off Indicator = "STRONG BUY" everywhere except 15m/30m).
Multi-timeframe alignment, only 15m/30m in minor divergence (Down, no structural impact).
__________________________________________________________________________________
Strategic Summary
__________________________________________________________________________________
Bullish swing/mid-term bias confirmed: Optimal opportunities on pullbacks 117900–116467.
Risk/stop zone: below 115736 USDT (key multi-frame pivot).
Catalysts: ECB (24/07, volatility expected); strict monitoring post-announcement.
Plan: swing entries on pullback, strict risk management, reduce exposure before macro events.
__________________________________________________________________________________
Multi-Timeframe Analysis
__________________________________________________________________________________
Daily (1D) : Consolidation after ATH, strong supports (105100, 111980). Strong momentum, Risk On / Risk Off Indicator at "STRONG BUY," ISPD neutral. Normal volumes.
12H/6H : Price oscillating near upper pivots (115736, 116467). Buyers in control. "STRONG BUY" generalized.
4H/2H : Range 116467–119676, Up momentum. Swing setups/favorable to buyers on weakness.
1H : Full confirmation of the bullish bias. 116.5–117K area = key support for scalp/swing.
30min/15min : Minor short-term bearish divergence, increasing volumes, no structural warning. Possible scalping on bullish reaction 117800–116467.
Risk On / Risk Off Indicator = "STRONG BUY" on all timeframes (>1H). Only micro-risk: "Down" divergence on 15/30min, to be watched.
Main risk: $130K area (Glassnode major statistical resistance), possible capitulation below 115736 (swing invalidation).
Targets: 122–130k.
Macro: Reduce exposure before 24/07 (ECB), adjust stops if extreme volatility.
__________________________________________________________________________________
Fundamental & On-Chain Summary (Glassnode, July 22, 2025)
__________________________________________________________________________________
BTC in price discovery, all holder cohorts in profit (>95% STH).
Profit-taking rising but no climax detected; market is "breathing".
Major support: $110K; major resistance: $130K.
Attractive risk/reward outside euphoria zones. Stop advised <115736.
No immediate disruptive macro catalyst. Watch for volatility spikes at ECB decision (24/07).
__________________________________________________________________________________
Actionable Synthesis & Plan
__________________________________________________________________________________
"Swing long" favored on pullback 117900–116467 / stop below 115736.
Scalping weaknesses 117800–116467 on bullish reaction, monitor post-ECB confirmation.
Reduce leverage/exposure ahead of ECB.
R/R ratio >2 on bullish swing scenario; strict stop-loss.
Robust bullish context, valid technical structure. Active approach required short term: seize pullbacks, protect stops, adjust post macro-news.
EURUSD: the ECB weekThe focus of the previous week was on US inflation figures. Posted data showed relatively stable figures for June, as inflation was standing at 0,3% for the month and 2,7% on a yearly basis. Both figures were in line with market expectations. Core inflation remained elevated and reached 0,2% for June and 2,9% y/y. At the same time, core inflation was by 0,1pp lower from market forecasts. The Producers Price Index in June was standing at 0%, same as core PPI. Compared to the year before, PPI was increased by 2,3%, while core PPI was higher by 2,6%. Retail sales in June were higher by 0,6%, and were better from market estimates of 0,1%. Building permits preliminary for June reached 1,397M and housing starts were standing at 1,321M in line with market expectations. The University of Michigan Consumer Sentiment preliminary for June was at the level of 61,8 in line with forecasts. Five year inflation expectations cooled a bit to 3,6%, from previous 4%. This year inflation expectations also eased to 4,4% from previous 5%.
The Industrial Production in the Euro Zone in May was higher by 1,7% for the month, bringing the indicator to the level of 3,7% on a yearly basis. Both figures were much higher from market forecasts of 0,9% for the month and 2,4% for the year. The ZEW Economic Sentiment Index in July for Germany reached the level of 52,7 a bit higher from forecasted. The final CPI in the Euro Zone in June was 2,3% y/y and core CPI at 2,3%, without change from the previous estimates.
For the second week in a row markets favored the US Dollar, which strengthened to the level of 1,1570 against euro. The currency pair ended the week at the level of 1,1626. The RSI continues to move around the level of 50 and is still not ready for a move toward the oversold market side. The MA50 continues to diverge from MA200, without an indication of a potential change in course in a near term period.
With a move toward the 1,1560, the eurusd tested the short term support line. At this level, the currency pair peaked in April this year. Charts are pointing to a potential for the short term reversal in the coming period. In this sense, levels modestly above the 1,17 resistance could be shortly tested. On the opposite side, 1,1560 might be tested for one more time at the start of the week, before the move toward upside. It should be considered that the ECB meeting will be held in a week ahead, where ECB members will draw the interest rate decision. A pause in rate cuts is overwhelmingly expected by market participants.
Important news to watch during the week ahead are:
EUR: GfK Consumer Confidence in august in Germany, HCOB manufacturing PMI flash for July for both Germany and Euro Zone, ECB meeting and interest rate decision will be held on Thursday, July 24th, Ifo Business Climate in July in Germany,
USD: Existing Home Sales in June, Durable Goods Orders in June.

3-Year Euro Uptrend — An Absurdity Amid a Weak EconomyCMCMARKETS:EURUSD
The euro is climbing, hitting its highest levels since late 2021 near $1.18. This surge is driven by diverging central bank policies—with the ECB holding rates steady while the Fed leans dovish—amid global tensions that push gold higher and rattle markets, weakening the dollar even though the eurozone economy remains fragile.
📉 1️⃣ Dollar Weakness Takes Center Stage
Since its January 2025 peak, the U.S. Dollar Index (DXY) has fallen by over 11% 📉—one of its worst starts in decades, comparable to the slumps of 1986 and 1989. As inflation cools, markets are betting on Fed rate cuts, pulling U.S. Treasury yields lower. Coupled with monetary policy divergence and tariff drama, the dollar’s usual safe-haven appeal is fading, even amid ongoing geopolitical tensions.
📊 2️⃣ Fed–ECB Policy Divergence
While the ECB has signaled the possibility of one or two cuts this year, markets are pricing in a milder path. By contrast, the Fed is tilting dovish, with swaps markets expecting a rate cut in September and another by December 🗓️. This widening yield differential supports EUR/USD, even though eurozone growth remains soft.
⚖️ 3️⃣ Trump Tariff Risks and Sentiment Shift
Uncertainty around U.S. trade policy—especially the threat of renewed tariffs—has weighed more heavily on USD sentiment than on eurozone currencies. Markets view these tariffs as inflationary and damaging to U.S. growth prospects. Speculative positioning data confirms record bearish sentiment on the dollar, with funds underweight USD for the first time in 20 years 💼.
💶 4️⃣ Eurozone’s Fiscal Shift
Germany has begun spending and borrowing, marking a dramatic pivot from years of fiscal restraint. This has raised hopes for an investment-driven recovery across the eurozone. Meanwhile, ECB President Christine Lagarde is avoiding signaling aggressive cuts, stabilizing market expectations and maintaining a sense of monetary calm—for now 🛡️.
🛡️ 5️⃣ Safe-Haven Flows Shifting
Traditionally, geopolitical stress boosts the USD as a safe haven. This cycle is different: investors are increasingly turning to gold, the Swiss franc, and the yen as defensive assets, indirectly supporting the euro. In April, when Trump delayed tariff plans, safe-haven USD flows unwound further, fueling euro gains 💰.
⚠️ Risks Ahead for EUR/USD:
💔 Weak Eurozone Fundamentals:
The eurozone economy is not booming. The IMF projects just 0.9% growth for 2025, with Germany, France, and Italy struggling to regain momentum. The ECB’s Financial Stability Review flags worsening credit conditions, weak private investment, and deteriorating balance sheets, none of which support sustained euro appreciation 📉.
🚢 A Strong Euro Hurts Exports:
Eurozone exporters in machinery, chemicals, and autos are already facing squeezed margins from rising input costs and global protectionism. A stronger euro makes exports less competitive, shrinking the eurozone’s current account surplus, which dropped sharply from €50.9 billion in March to €19.8 billion in April, according to the ECB 📊.
⚡ Political Risks Looming:
Fragile coalitions in Germany, budget battles in France, and rising anti-EU sentiment in Italy and the Netherlands could swiftly unwind euro gains if tensions escalate. Should the ECB turn dovish to support a weakening labor market, the euro’s rally could reverse quickly 🗳️.
📈 7️⃣ Technical Picture: Overextension Warning
In addition to the macro drivers, EUR/USD is now technically overextended. The pair has already retraced exactly 78.6% of its major bearish trend that started in January 2021 and ended in September of that year. Ahead lies a strong resistance zone at 1.18000–1.20000, which will be difficult to break without a significant catalyst.
Notably, the daily chart shows bearish RSI divergence, indicating fading momentum beneath the surface of this rally. A pullback toward the 1.13000 level would not be surprising, even as near-term momentum remains strong. This technical setup calls for caution while the pair tests these critical levels.
📈 Technical Outlook: EUR/USD Showing Signs of Overextension
Beyond macroeconomic factors, EUR/USD is currently technically overextended. The pair has retraced exactly 78.6% of its major bearish trend that began in January 2021 and concluded in September the same year. It is now approaching the upper boundary of a 3-year ascending channel, facing a significant resistance zone between 1.18000 and 1.20000—a hurdle unlikely to be crossed without a strong catalyst.
Additionally, the weekly chart reveals a bearish RSI divergence, signaling that underlying momentum is weakening despite the recent rally. Given this, a pullback toward the 1.13000 level is plausible, even as short-term momentum remains robust. This technical setup advises caution as the pair navigates these critical resistance levels.

EUR/USD Daily Chart Analysis For Week of July 18, 2025Technical Analysis and Outlook:
In the current trading session, the Euro has continued its decline, completing our Mean Support level of 1.160. Recent analyses indicate that the Euro is likely to experience a sustained downward trend, with an anticipated retest at the Mean Support level of 1.159 and a possible further decline to reach a Currency Dip of 1.152. Nevertheless, it is crucial to consider the potential for a dead-cat bounce toward the Mean Resistance level of 1.167, which could trigger a significant reversal of the downtrend and target a Currency Dip of 1.152.

EUR/USD Daily Chart Analysis For Week of July 11, 2025Technical Analysis and Outlook:
In this week's trading session, as expected, the Euro continued its decline, reaching our Mean Support level of 1.168. Recent analyses suggest that the Euro is likely to experience a further downward trend, with the next target set at the Mean Support level of 1.160. However, it's essential to consider the possibility of a rebound toward the Key Resistance level of 1.181, which could lead to the completion of an Outer Currency Rally reaching 1.187.

EUR/USD: A High-Probability Short Setup at 1.1829At its core, this trade is driven by a powerful and growing divergence between the US and European economies. While technicals tell us where to trade, fundamentals tell us why we're trading.
1️⃣ The Interest Rate Gap: The U.S. currently offers significantly higher interest rates (4.25% - 4.50%) compared to the Eurozone (2.15%). This makes holding the US Dollar more attractive, creating natural downward pressure on the EUR/USD.
2️⃣ Central Bank Policy: The US Federal Reserve remains hawkish, focused on strength and fighting inflation. Meanwhile, the European Central Bank is dovish, signaling a willingness to keep conditions loose to support a weaker economy.
3️⃣ Labor Market Strength: The US enjoys a robust labor market with unemployment at just 4.1%, while the Eurozone's is significantly higher at 6.3%. This points to a stronger US economy.
In simple terms, the US economy is strong, and its central bank is acting like it. The Eurozone economy is weaker, and its central bank is acting accordingly. This fundamental imbalance is the fuel for a potential significant move down in EUR/USD.
The Technical Picture: The Wall at 1.1829
As you can see on the 4H chart, the price has run into a major wall of resistance at the 52-week high of 1.1829 . After a long uptrend, the momentum has stalled, and the price is now consolidating inside a symmetrical triangle . This coiling of price action often precedes a strong breakout.
Our strategy is not to guess the breakout, but to act on a high-probability retest of resistance. We are looking to enter a short position as the price pulls back towards the upper boundary of this triangle, anticipating a failure at resistance and a subsequent break to the downside.
The Actionable Trade Plan
This setup offers an excellent risk/reward profile.
📉 Asset: EUR/USD
👉 Entry (Limit Sell): 1.1780
⛔️ Stop Loss: 1.1850
🎯 Take Profit: 1.1600
📈 Risk/Reward Ratio: ~2.57:1
Trade safe and manage your risk.

EUR/USD Daily Chart Analysis For Week of July 4, 2025Technical Analysis and Outlook:
During the trading session this week, we witnessed the successful completion of the Outer Currency Rally at a level of 1.177. Recent analyses suggest that the Euro is likely to encounter a downward trend, with an initial target set at the Mean Support level of 1.168 and a potential extension to an additional Mean Support of 1.160. Nevertheless, it is crucial to acknowledge the possibility of a subsequent increase toward the next Outer Currency Rally level of 1.187 before any definitive downward movement transpires.

EUR/USD: A Perfect Storm for BullsThis is a high-conviction long setup based on a powerful combination of macroeconomic divergence and a confirmed multi-year technical breakout.
The Non-Farm Payrolls report has now been released, and the resulting price dip has created what I believe is an ideal entry opportunity to align with the dominant bullish trend.
The Fundamental Why 📰
NFP Aftermath: Yesterday's NFP report was a mixed bag that ultimately reinforces the case for Fed rate cuts. The headline number beat expectations, causing an initial USD rally and a dip in EUR/USD. However, the underlying details like wage growth were soft. Crucially, the market continues to price in a 96% probability of a Fed rate cut by September, a figure that was unchanged by the data. The core driver of USD weakness—a dovish Fed—remains firmly intact.
Resilient EUR 🇪🇺: In contrast, the ECB has signaled it is at or near the end of its easing cycle. Economic data from core Eurozone countries is stabilizing, providing the Euro with relative strength.
Risk-On Sentiment 💹: The broader market remains in a "risk-on" mood, which is typically negative for the safe-haven USD. Gold is soaring and equities are near all-time highs, confirming the anti-dollar flow.
The Technical Picture 📊
The Secular Breakout 🚀: The most significant event is the breakout of a decade-long downtrend resistance line. This is a major structural shift. The pair has also achieved a monthly and quarterly close above the critical 1.1500 handle, turning a historic resistance level into a new support floor.
The Impulsive Uptrend 🌊: On the 4-hour chart, the price is in a clear ascending channel. The post-NFP dip represents a healthy correction within this uptrend, bringing price back toward key support.
Key Levels 🔑:
Support Zone: The dip has brought price directly into the key support confluence between 1.1700 and 1.1760, making this an ideal area to enter long.
Resistance Zone: Major resistance still sits at 1.1900, making it a prudent take-profit target.
Strategy & Risk Management 🧠
The stronger-than-expected NFP headline has provided the exact pullback this strategy was designed for. The dip presents a prime opportunity to buy into the dominant uptrend at a more favorable price. Instead of chasing the market, we are now positioned to enter on a technically sound correction.
Good luck, and trade safe!
Trade Parameters ✅
Pair: EUR/USD
Direction: Long / Buy 🟢
Entry Type: Limit Order
Entry Price: 1.1745
Stop-Loss: 1.1685 (60 pips) 🔴
Take-Profit: 1.1895 (150 pips) 🎯
Risk/Reward Ratio: 2.5 : 1

EUR/USD Daily Chart Analysis For Week of June 27, 2025Technical Analysis and Outlook:
In the course of this week's trading session, the Eurodollar has exhibited a strong rebound, successfully retesting and surpassing the Outer Currency Rally threshold of 1.163. Recent analyses suggest that the Euro is poised for further upward advancement, with the key target to reach the outer currency rally target of 1.177. Nonetheless, it is essential to recognize the possibility of a subsequent decline to the Mean Support level of 1.160 before a definitive upward movement.

DE40 H4 Analysis 23 Jul to 27 Jul - Bullish FlagDE40 Showing a bullish Flag 23,735 - 23,800. If it breaks this zone, Most probably can fly upto 24,466 and higher. Take your risk under control and wait for market to break support or resistance on smaller time frame. Best of luck everyone and happy trading.🤗

EUR/USD Daily Chart Analysis For Week of June 20, 2025Technical Analysis and Outlook:
During this week's trading session, the Eurodollar has encountered a significant decline, dipping below the Mean Support level of 1.149; however, it exhibited a modest recovery on Friday. Recent analyses indicate that the Euro is likely to decrease further to the Mean Support level of 1.148, with the potential for extending its bearish trend to reach 1.140. Nevertheless, there remains a possibility that the current recovery will persist, which could result in price movements targeting the Key Resistance level at 1.158 and potentially leading to a retest of the Outer Currency Rally's 1.163 mark.

EUR/USD Daily Chart Analysis For Week of June 13, 2025Technical Analysis and Outlook:
During the current trading session, the Eurodollar has exhibited notable volatility, mirroring patterns observed in the preceding week. The currency has surpassed both the Mean Resistance level of 1.145 and the Key Resistance level of 1.151, subsequently retesting the significant completed Outer Currency Rally level at 1.157.
Recent analyses indicate that the Euro is likely to revisit both the Key Resistance and the completed Outer Currency Rally and expand further to the next Outer Currency Rally of 1.177 in the forthcoming trading session(s). However, there exists a potential for a continuation of the downward trend from the current level, which could lead to the price action targeting the Mean Support level at 1.149 and possibly a further extension to the Mean Support level at 1.140.

EUR/USD Daily Chart Analysis For Week of June 6, 2025Technical Analysis and Outlook:
During the current trading session, the Eurodollar has exhibited notable volatility, mirroring patterns observed in the previous week. The currency surpassed a significant Mean Resistance level of 1.142 and encountered substantial resistive price action near the crucial Key Resistance level of 1.151. Recent analyses indicate that the Euro is likely to approach the critical Mean Support level at 1.137 and may decline to the subsequent Mean Support level at 1.129. Nevertheless, there exists the possibility of an upward movement from the current level or the Mean Support at 1.137, which could result in a target Mean Resistance of 1.145 and a retest of the Key Resistance at 1.151.

As ECB Ready's "Final Cut", EJ "Begins Reversal"OANDA:EURJPY has began to potentially form a very strong Triple Reversal Pattern, The Head and Shoulders @ the Resistance Level lasted visited May 14th.
I say "potentially" because the "Right Shoulder" or recent Lower High has been created but we still wait for the final decline to the "Neckline" or Support Area formed by the Lows separating the "Head" from the "Shoulders" or Higher High from the Lower Highs in the pattern!
Signs of Potential Head & Shoulders:
1) Left Shoulder is an Oversold High
2) A Higher High is created at a level of Resistance
3) The Head not only has the Most Volume concentrated in the Pattern, but is also the start of the RSI Divergence from Price
4) Right Shoulder is formed and unable to surpass the Left Shoulder
..Bringing us to a very important tell..
5) Volume Decreases and logs a 3rd Divergent High in the RSI @ the creation of the Right Shoulder
Now we must WAIT for CONFIRMATION of the Pattern!
This will come when Price:
1) Declines to the Neckline
&
2) Makes Successful Breakout
Once the Head & Shoulders is Confirmed and Breakout is Validated:
- This could deliver great Short opportunities as a Head and Shoulders Breakout and Retest at the Neckline being the Last Line of Defense for the Bulls if Bears can push Price through and pick up Volume!
Fundamentally, BOJ Governor Kazuo Ueda will be speaking on Tuesday, June 3rd where we could see volatility come in for JPY.
The ECB is expected to cut rates by 25 bps from 2.4% to 2.15% on Thursday, June 5th and this could be the Last Cut we see the ECB plan to make until they see downside growth risks make more cuts likely.
