Euro Funded Carry Trades!This time I have an update to the macro chart to show the impact of increased borrowing on the Euro as European banks continue to led abroad. The flows are very complex in nature but very easy to track, we have two major forces in play which will serve the main course for the theme in 2020.
I am expecting EUR to find a strong bid next year as we see a new chapter in growth differentials . This will act as a catalyst in the reversal of capitals flows from the euro area to the US and serve as support in EURUSD.
The risk to the thesis comes from European growth flopping next year, investors will therefore expect lower returns from the euro area and therefore European assets would sell off, weighing heavy on the currency.
Short-term threatening to enter into wide consolidation till year-end, price action eminent of strong support at current levels. I sense that a clean break of 1.11 is now being watched as the catalyst for fresh demand and am comfortable buying anything inside the 1.09xx handle, as opposed to chasing the breakout. Watching EURJPY through 120.70 for clues.
For the chart deck today we have:
(i) A quick review of the wave count we have been tracking in this leg:
(ii) While we can continue to comfortably lean on the long-term macro chart posted from 2018:
Risk assets continue painting a positive story with Equities marching higher, cyclicals outperforming defensives and small caps outperforming large caps. However, rates and commodities clearly were not copied into the email with global yields and industrials stuck in first gear. Recommend all to bookmark this as an early warning sign of what is coming in 2020.
Perhaps the most interesting highlight of all comes from EM FX which continues to underperform vs yields and equities. Those following the previous conversations from 2018 will remember we traded this theme before; the same mainstream media in 2018 are selling the 2020 story as domestic EM related problems - well we know from experience in 2018 that these issues soon turned out to be a global pandemic.
Thanks all for keeping the likes and comments coming.
Ecb

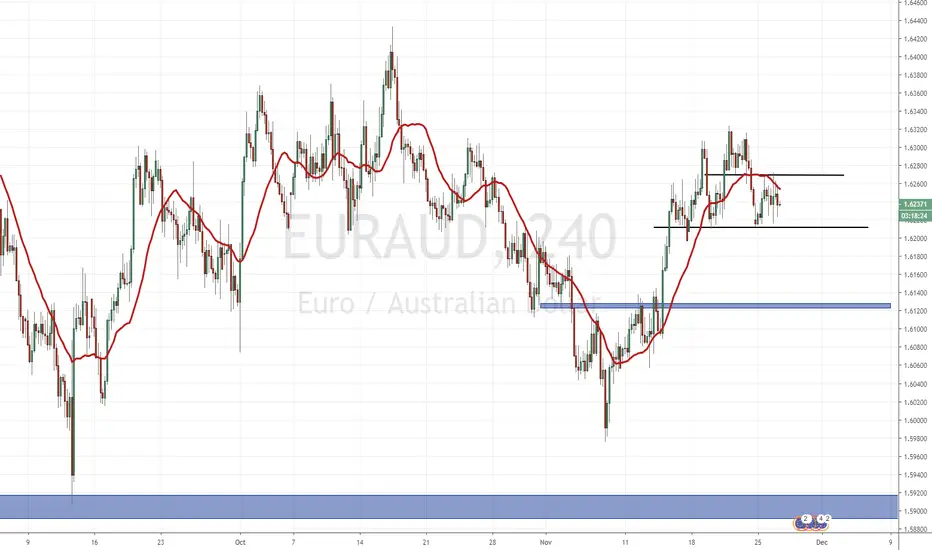
EURAUD Reversal PatternThis idea is similar to my GBPAUD idea which is still valid. Awaiting the break and close is our trigger.
EURAUD hit a resistance zone at 1.6320. We have been in an uptrend, but one factor which goes against this idea would be the swings, or higher lows, are not very prominent. However, there are 2 swings in the trend which is good for our trading.
We can see the bounce to make another higher low has been sold. It appears we will be making our FIRST lower high with the break of the 1.6210 zone.
This is the zone I am watching for a break.
1.6120 is a previous flip zone and 1.6095 is a demand zone both of which we can target.
ridethepig | EURSEK 2020 Macro MapTime for another forward walk in 2020, this time the focus is EURSEK. I am tracking for a year of "two halves" with the first providing support for SEK and a lot of demand for the most undervalued G10 cross.
On the SEK side lets start with the Long-term chart:
On the EUR side lets start with the Long-term chart:
For the Swedish Macro details, Sweden is badly exposed to extreme levels of domestic credit with the SEK depreciation. Houses in Sweden have also not been attractive for a while and are finally showing signs of a bounce. The Riksbank is widely expected to hike in Dec, if the housing market plays ball then we can have more hikes from Riksbank next year.
We have traded EURSEK a few times previously here:
Risks to the thesis come from the Swedish housing market, if this breaks down we are going to see expectations shift in EURSEK. I will be releasing my 2020 FX outlook reports along with other strategy research in the coming weeks. 2020 is setting up for fireworks on the FX board with expectations and valuations starting to diverge and with late cycle concerns creeping back in through the back door to put the cherry on top. For those interested can send a PM on here or Tradingview.

EU: Weekly price to watchWe'll be looking for an opportunity to enter either short or long on the Euro dollar early this week, as price has reached a key-level, a retracement zone, an area of supply, and a trendline. We are prepared to take either side of this trade.

How to make money on a pound and what to do with oilThe situation in Hong Kong continues to escalate. Trump promises to sign a scandalous law to support demonstrators, which is extremely describing China. And although the US and China declare progress in the negotiations, in such conditions, it can break at any moment. So we continue to look for points for purchases of gold and the Japanese yen.
As for the other news - the impeachment process continues in the USA, the UK is preparing for the elections and Saudi Arabia for the IPO Saudi Aramco.
In light of the upcoming elections and the uncertainty with its outcome, we can’t count on the growth or decline of the pound in the next couple of weeks. But on the other hand, understanding this opens the doors for aggressive intraday trading without explicit preferences. So, we are armed with hourly oscillators and actively trade GBPUSD.
Oil has grown quite well over the past couple of days amid information about rising oil reserves in the US, as well as increased tensions in the Middle East. These events are not one of those that can significantly change the balance of power in the market. So Friday looks like a great day for oil sales.
First of all, we are waiting for business activity indices to be published in the Eurozone, the UK and the USA. Also, pay attention to retail sales in Canada, as well as the speech of the new head of the ECB Lagarde. Given that markets are now very sensitive to macroeconomic statistics, even relatively minor data can trigger a surge in volatility. Well, from the new head of the ECB, her vision of monetary policy in the Eurozone has long been expected.

EURUSD thoughts and opinionThe bilateral chart pattern is seen in the hourly timeframe. ECB: A strong call for unity was made at the October meeting. Daily ATR is around 42 meaning, for now, price is trading below the average (may have some room for upside). It seems like a break for now from the upper trendline of the bilateral chat pattern has occurred. Price was held by this crucial level from the last day but for now, the bull breaks this wall.

EURUSD 4hrAgain just an idea, no one knows where the price is gonna head.
The money you lose is the dollar amount of the punition you deserve because the market is always right and it's surely doesn't care about your feelings.

EURJPY Likely to Decline towards 119.00 After Support Break!Hello Viewers, this is an instant trade signal! Therefore, please have a look at the main chart for the following vital trade details:
• ENTRY POINT
• STOP LOSS
• TAKE PROFIT
• RISK TO REWARD
The setup may look simple but I can assure you it is NOT. There are various in depth technical and fundamental analysis incorporated behind the execution. I would very much love to explain these two aspects here but doing that would consume ample amount of time which could affect the appropriate entry point behind this trade! So, to keep it simple the main chart just displays the simplified technical view of this trade.
My way of performing technical analysis basically starts by breaking down the monthly Timeframe down until the One Hour charts. The following are the aspects I focus most on when performing technical analysis:
• Draw Support & Resistance through key common psychological levels on M & W Charts. This helps me to see where the price might stall or breakout.
• Draw Trendlines to determine the dynamic support and resistance levels present on the charts. This helps me to determine where the price might stall and most importantly help determine the path of least resistance behind the active trade.
• I also tend to use EMA 50 on all the Timeframes. This EMA 50 is proficiently proven to act as dynamic support and resistance and is vital behind all my analysis.
• Lastly, I tend to use classic pivot levels to determine my entry, stop loss and take profit levels. The combination of this and all of the above helps me determine the precise and likely trade targets behind the setup.
Another aspect of my way of analysis is reading a lot of news to determine the fundamental aspects affecting any trade. After the technical analysis is performed, I tend to match if the fundamental aspect really supports my technical analysis.
Therefore, as you could see, putting all my thoughts here would surely take up a lot of time which could make the price drift away from the entry price thus affecting the Risk to reward ratio. I understand it is vital for many of you to know the details behind this trade setup, and so if you are interested you could send me message and I will try to share most of what I can!
The Above words are just template I use in all my trades. Shall there be any updates I will provide them here. Thank you

EU: Daily (1d) Morning Star Reversal Price has reacted perfectly on longer time frames to be currently showing a morning star pattern on the daily time frame. See linked and previous charts below,

EU: Long Setup (11.12)The Euro has dropped steadily from the previous higher-low in the current long-term downtrend (1.11795). The weekly support of 1.1 is within 10 pips. Tomorrow and this week we'll be looking for longs at the key level of 1.1 Staying dynamic and not being stuck on one bias is key to seeing through the noise and trading the Euro in peace. If support is found, I expect 1.175 to be hit as an upside target very quickly.
This trade entry is provided in our telegram channels.


EURJPY consolidationStuck between an ascending channel that would mean going short or a bullish rectangle which would force me to go long.
The short is accompanied by a resistance too, so more sentiment on that.
Good luck and follow me for more!

EURUSD Could Test 1.10000 Level After Double TOP Neckline Break!Hello Viewers, this is an instant trade signal! Therefore, please have a look at the main chart for the following vital trade details:
• ENTRY POINT
• STOP LOSS
• TAKE PROFIT
• RISK TO REWARD
The setup may look simple but I can assure you it is NOT. There are various in depth technical and fundamental analysis incorporated behind the execution. I would very much love to explain these two aspects here but doing that would consume ample amount of time which could affect the appropriate entry point behind this trade! So, to keep it simple the main chart just displays the simplified technical view of this trade.
My way of performing technical analysis basically starts by breaking down the monthly Timeframe down until the One Hour charts. The following are the aspects I focus most on when performing technical analysis:
• Draw Support & Resistance through key common psychological levels on M & W Charts. This helps me to see where the price might stall or breakout.
• Draw Trendlines to determine the dynamic support and resistance levels present on the charts. This helps me to determine where the price might stall and most importantly help determine the path of least resistance behind the active trade.
• I also tend to use EMA 50 on all the Timeframes. This EMA 50 is proficiently proven to act as dynamic support and resistance and is vital behind all my analysis.
• Lastly, I tend to use classic pivot levels to determine my entry, stop loss and take profit levels. The combination of this and all of the above helps me determine the precise and likely trade targets behind the setup.
Another aspect of my way of analysis is reading a lot of news to determine the fundamental aspects affecting any trade. After the technical analysis is performed, I tend to match if the fundamental aspect really supports my technical analysis.
Therefore, as you could see, putting all my thoughts here would surely take up a lot of time which could make the price drift away from the entry price thus affecting the Risk to reward ratio. I understand it is vital for many of you to know the details behind this trade setup, and so if you are interested you could send me message and I will try to share most of what I can!
The Above words are just template I use in all my trades. Shall there be any updates I will provide them here. Thank you

EURAUD Short Trade Executed! Price Aiming For 1.61850 LevelHello Viewers, this is an instant trade signal! Therefore, please have a look at the main chart for the following vital trade details:
• ENTRY POINT
• STOP LOSS
• TAKE PROFIT
• RISK TO REWARD
The setup may look simple but I can assure you it is NOT. There are various in depth technical and fundamental analysis incorporated behind the execution. I would very much love to explain these two aspects here but doing that would consume ample amount of time which could affect the appropriate entry point behind this trade! So, to keep it simple the main chart just displays the simplified technical view of this trade.
My way of performing technical analysis basically starts by breaking down the monthly Timeframe down until the One Hour charts. The following are the aspects I focus most on when performing technical analysis:
• Draw Support & Resistance through key common psychological levels on M & W Charts. This helps me to see where the price might stall or breakout.
• Draw Trendlines to determine the dynamic support and resistance levels present on the charts. This helps me to determine where the price might stall and most importantly help determine the path of least resistance behind the active trade.
• I also tend to use EMA 50 on all the Timeframes. This EMA 50 is proficiently proven to act as dynamic support and resistance and is vital behind all my analysis.
• Lastly, I tend to use classic pivot levels to determine my entry, stop loss and take profit levels. The combination of this and all of the above helps me determine the precise and likely trade targets behind the setup.
Another aspect of my way of analysis is reading a lot of news to determine the fundamental aspects affecting any trade. After the technical analysis is performed, I tend to match if the fundamental aspect really supports my technical analysis.
Therefore, as you could see, putting all my thoughts here would surely take up a lot of time which could make the price drift away from the entry price thus affecting the Risk to reward ratio. I understand it is vital for many of you to know the details behind this trade setup, and so if you are interested you could send me message and I will try to share most of what I can!
The Above words are just template I use in all my trades. Shall there be any updates I will provide them here. Thank you

EURUSD Bear going to catch and eat a Bull fish tonight..!!??We already know Brexit deal has somehow affected EURUSD upward bullish momentum which was good enough earlier days before the vote in the UK but not it's not the same as it was in back days. Talking about volatility EURUSD has an average of just 9.4 pip per hour comparing to GBPUSD it has around 26.6pips within an hour which is quite a great amount of volatility rather then EURUSD. Today but it's a special day for European currency as we all know there is rate decision which is yet to see.
On the subject of ECB easing, we’ll actually hear straight from the central bankers themselves later on in the trading session. No actual interest rate changes are expected this time since the ECB already made its move in the September statement. However, today's manufacturing and services PMIs show poor outlook. This could tone down speculations that the ECB is bound to step up its easing efforts anytime soon.
Also keep in mind that this will be the last ECB meeting for Mario Draghi, as he is due to step down from his post and turn over the position to Christine Lagarde. With that, most of the market focus could be on the presser that follows the announcement as Draghi would likely be quizzed on what he is foreseeing for future policy. Aside from that, Draghi might also be asked to share his thoughts on the dissent in the ECB, particularly when it came.
This is only an idea, a fact but not a guarantee trade advice. If you think this idea gonna work somehow then better to check once by self and risk on your own pure judgment and not by just some random post which you read around. Not only mine but others post too. In the end, it's our money and our own decision so must be taken as reference purpose mostly! At end, I will like to say either this idea works fine or not it's not my priority for posting this idea but the aim of this post is to let all my fellow traders know what's coming next!! Be prepared and have safe trading ahead all. If you like this report give a thumps up as your support! ;)

ECB waits, economy stagnates, Johnson keeps pound from growingAt yesterday’s meeting, the Governing Council of the European Central Bank (ECB) decided that the interest rate on the main refinancing operations and the interest rates on the marginal lending facility and the deposit facility will remain unchanged. So Draghi can leave with a sense of accomplishment, but his successor Christine Lagarde will have to solve a challenging task - how to stimulate the economy if rates are lower than zero.
Yesterday's macroeconomic statistics has been psyching negative thoughts out. The composite PMI index in Germany is below 50 and worse than forecasts, the similar index in the Eurozone as a whole turned out to be above 50, but it came out worse than forecasts, and its recessive values remained only - 0.2. Orders for durable goods in the United States fell by 1.1% m / m in September (forecast: -0.7% m / m), while composite PMI in the United States, although it reached 51.20, is still worse than analysts' forecasts.
In general, the economy continues to generate signals in favour of stagnation. Recall recent data on manufacturing activity in Japan, which reached its lowest level over the past 3 years, or China's GDP, which has reached thirty-year lows.
Returning to the ECB and its negative rates, I would like to note that regulators are one step away from being stuck when traditional instruments of influence on the economy go off, but there is nothing to replace with. In general, the threat of a global economic catastrophe from a hypothetical opportunity may well become a reality.
Well, we recall that during periods of crisis, the investment strategy needs to be radically adjusted: replace investments in stocks with investments in bonds, increase cash in the portfolio and spend part of facilities on the purchase of safe-haven assets.
In this light, we continue to recommend buying gold and the Japanese yen.
Speaking of threats. Boris Johnson continues to stop the pound from growing. His intention to hold early elections in December is becoming real. On Monday, this issue will be put to a vote in Parliament. And if the EU by that time manages to agree on a postpone on Brexit, then the opposition is ready to vote “in favour”, which means that early parliamentary elections are waiting for Britain in December.

ORBEX:BoJo Pushes for Election, Draghi Hints to Fiscal Measures!In today's #marketinsights video recording I analyse #GBPUSD and #EURUSD #FXMajors!
GBPUSD Dragged down by:
- BoJo push for an early election on December 12
- Increasing likelihood of October exit failure
EURUSD Under Pressure as:
- ECB reiterates downside risk, stubbornly low inflation
- Draghi hints to fiscal policy measures
Stavros Tousios
Head of Investment Research
Orbex
This analysis is provided as general market commentary and does not constitute investment advice

Draghi - Last word, Johnson's threats, EU and USA statisticsThe main event will be the announcement of the ECB decision on the monetary policy parameters in the Eurozone. Given the general tendency toward easing monetary policy in the world and the recent actions of the Central Bank of Europe, euro can be expected a pretty unpleasant surprise, In theory. But in practice, most likely everything will be ok.
Mario Draghi is ending his eight-year term at the European Central Bank. Accordingly, there is simply no reason for him to present any surprises and slam the door after leaving. However, follow the ECB's comments on the quantitative easing program and the size of bond purchases by the Central Bank is needed.
Given the general state of the global economy in general and the Eurozone in particular, the ECB does not have to rely on positive signals for the euro today. But they are unlikely to sell the euro. In this regard, today we recommend working with the euro with hourly oscillators, but with a mandatory eye to the decision and comments of the ECB.
Also, today it is worth paying attention to data on business activity in Germany and the Eurozone. They may well create the ground for a subsequent reaction to the results of the ECB meeting.
As for other countries and currencies, quite a lot of macroeconomic statistics will be published in the United States, including data on orders for durable goods, business activity indexes, as well as statistics on sales of new homes. We are still negative about the dollar, so we recommend using weak data as a reason for its sales in the foreign exchange market.
The Brexit situation is again plunging into a chaos of uncertainty, but uncertainty without a global threat. This refers to an exit without a deal.
On the one hand, the House of Commons of the British Parliament supported the new Brexit bill, based on an agreement reached by the government with EU representatives last week. On the other hand, Johnson does not abandon attempts to complete Brexit by October 31 and proposed that Parliament finally approve the agreement on Thursday, otherwise he promised to withdraw the agreement and call early elections.
Despite Johnson’s threats, markets generally believe in a happy ending but are not completely sure what final form Brexit will take. In this regard, our recommendations to buy the pound on the rebound remain relevant today.
The oil market experienced some recovery yesterday after the publication of data on oil reserves in the United States. Oil stocks unexpectedly declined (by approximately 1.7 million barrels, while markets were preparing to continue their growth by 3 million barrels). Our position in oil is still unchanged: while the asset is above 51.20 (WTI brand), we give preference to purchases on the intraday basis.


ORBEX: EURGBP - Ready to Take Break-even Stops Lower?EURGBP could move a tad lower to complete intermediate wave 2 near 0.8480 before continuing higher. The said level is the 100% FE of the first minute degree zig-zag and could be duplicated as minor X was somewhat dominant.
Look for a valid reversal above last zig-zag's minute b wave but expect minute c to complete first. Minute c should be truncated to support this outlook, otherwise, fresh lows can be expected.
Should prices move below minute a low the complex minor W,X,Y pattern could come to an end.
Stavros Tousios
Head of Investment Research
Orbex
This analysis is provided as general market commentary and does not constitute investment advice.
