Semiconductors & SOXL: A Bull ThesisWhy Semiconductors?
Virtually every single electronic device contains some form of a semiconductor unit within its components. The entire Bull theory on semiconductors as an industry could be reduced to this one sentence. The following, however, will introduce concepts contingent to the understanding of what is shaping the market for semiconductors. The weight of intra-industry, political, macroeconomic, and physical factors discerning an inconceivable upside potential for certain investments carrying maximum exposure to the sector, such as AMEX:SOXL . The last section contains my technical approach to trading SOXL.
We begin with the fundamental, and by fundamental, I refer to the simplest reasons for what is happening in the market up until now; [ Early morning Monday, 7/28 ].
Macroeconomic Context
Like essentially the rest of the market, SOXL hit its 1 year low of 7.23 USD on Monday, 4/7, following the announcement (and soon postponement) of global tariffs at levels not observed since the early 30's. This of course sparked a panic spiral in the entire market, leading to outflows from the S&P 500 of approximately 70 billion USD during the month of April. During this time we also saw a new, but familiar narrative emerge. Asset Managers, Such as J.P. Morgan set historically low price targets on the S&P 500, going as low as 5,200 USD. They reinforced their PTs with publications warning investors across the world that the risk of recession in the United States was raised to 80%, and this message was relayed across all media in parabolic fashion. While it does not seem too outward to assume an increased risk of recession due to tariffs by looking back on what we learned of the consequences from the Smoot-Hawley Tariff Act of 1930. There exists a widely overlooked, fundamental , reason as to why I can claim that the REAL risk of recession at the time that J.P. Morgan assigned an 80% risk of recession, was in actuality, 0% (I assume J.P. Morgan knew this but pushed the narrative anyways in order to acquire massive equity at a discount). If anyone has taken introductory macroeconomics in their lifetime, they may be familiar with the function for calculating GDP via the expenditure approach: GDP = C + I + G - NX. Now, why am I referencing high school/college economics basics, the answer to that lies in how we determine our rate of economic growth in the context of tariffs. The part of this formula that we must focus on is NX or Net Exports, the negative factor to GDP. Tariffs, if implemented would effectively decrease import volume, resulting in a smaller Net Exports, and ultimately a higher GDP calculation. Now, what makes this scenario unique, the tariffs having been postponed shortly after their inception, allowed US retailers to engage in front running, or the accelerated purchasing of foreign goods in advance of tariffs. During the month of April, we saw a 5.4% increase in import volume in US west coast ports. This increase in imports effectively caused the inverse impact on GDP growth that import tariffs themselves would have caused: front-running lead to import uptick, leading to a greater Net Exports, which results in lower (negative) GDP growth. Essentially, tariffs in the short-term increases GDP growth (in the long term deadweight loss, and cost structure distortion comes in to play, but that doesn't matter yet), however , tariffs that are announced but not immediately implemented will result in a lower GDP growth, coupled with uncertainty surrounding the whole situation that translated into a cut in CapEx as companies scrambled to determine if tariffs would f*ck them over or not. This argument is further supported by the trends observed in the foreign exchange market. You may have heard in the news that we are experiencing a period of "Dollar Weakness", and while, yes, you can clearly see that the USD has fared rather poorly against other currencies in most major dollar pairs over the past few months. The agent behind this isn't just that the dollar happens to be weak, it is a combination of factors that generate noise and volatility in the forex market. The two main factors highlighted by the media are 1. The obvious political policy instability, pushing bond yields higher, plus a significant debt ceiling raise as per the BBB and 2. the expectations of interest rate cuts over the next year. The other, less recognized major factor to dollar weakness is exactly what we described above: Increased imports means more dollars flowing out of the economy. When these dollars land abroad, they are converted into the native currency, driving down the demand for the dollar. Notice how none of the reasons described above, actually have anything to do with what truly drives foreign exchange markets. Over time, the strength/weakness of a currency is directly correlated to the strength/weakness of the underlying economy. To say that we can expect dollar weakness due to the aforementioned reasons outright ignores the economic growth potential that exists in our economy at this current time, subsiding the out-of-proportion tariff fears as a proponent to an economic crisis. In an all-encompassing view, what I would describe to be occurring on the macro level is a sort of "slingshot" effect: Trade imbalances and private sector response to policy unclarity results in a pullback in economic growth, one that we are now experiencing as a short-term effect. From a medium-long term perspective, assuming that tariffs aren't persistent in the long term, we would see full fledge economic boom, driven by non other than the growth of our technology sector, which at it's core, lies the almighty semiconductor.
Growth of AI as a driver of Semiconductor demand: Stable trajectory or Bubble Territory?
Having laid the economic framework for picking the general direction our market is heading in, we can now begin to talk about the internal combustion occurring within the world of technology, and the two letter term associated with just about every cool thing in the business world, that is of course AI. Now just to clarify, AI is not new, its been around for at least 20 years and has a well established role in the world prior to the existence of ChatGPT. What changed so drastically in recent years is the breakthrough into a new form of artificial intelligence, known as "Artificial General Intelligence" or AGI. Long story short: AGI's primary difference in the business context is the colossal amount of electrical infrastructure and computing power that is demanded by the development of these mega language models. As a result of the high barrier for entry to this new industry, only 5 AGI companies have arisen to the global stage: OpenAI, Google DeepMind, Anthropic, Microsoft, and DeepSeek. Increasing competition in this space through more players entering the market is unlikely at this time as the cost to create a standalone AGI model is so astronomical. This is a particularly good thing because it tells us that AGI as an industry can result in natural monopolies. The ultra-intensive RnD costs and Data Center infrastructure demands make it more sensical to have a greater number of resources dedicated to producing 1 AGI model, instead of dividing resources to develop multiple less optimized models (similar to how a water company holds a natural monopoly as competition in that industry would result in no foreseeable benefit to it's customers). A further effect from this dynamic lies in how businesses in this industry scale to expand, and its pretty straightforward: the more megawatt computing power a model can access, the more parameters a model can account for, and the more vast the dataset that model can train on, with enhancing speed and efficiency (GPT 4o takes into account >500B parameters in a given query). We see the concept of natural monopoly playing out as the concentration of market capitalization is becoming more extreme where firms like Google, Microsoft, and NVIDIA are absorbing larger share of the market, while trading at ever increasing Price/Earnings multiples. To many, this reflects a trend we saw during the dot com bubble, however what makes the AGI industry different is the nature of the good or service provided. During the dot com boom, companies saw speculative value based on only the fact that their business existed on the .com domain. We know that each of these businesses are unique, providing a good or service across whatever industry they were part of, the only thing having in common was that dot com. The major oversight that took place during the turn of the dot com era was that the success of these businesses wasn't in truth due to them ending in .com, but whether the idea, and execution behind the underlying business is strong or not. Like how Amazon and Facebook saw unparalleled success not just because they were .coms, but because they were pioneering business models that would attract global demand to the services they were providing. The business of AGI has a sort of homogenous property. All AGI companies produce a service that is extremely similar in nature, the only ways they can compete with one another is through Capital Expenditure towards harnessing more computing power. This is the main reason capital is concentrating in a handful of companies trading at high multiples. To me, this is not an indication of a tech bubble but rather a product of how the AGI industry is poised to grow within our economy.
AGI as a Factor of Production
To get even more philosophical, we can think about how AGI itself enhances economic growth. We already see AGI tools applied in various ways, but the most widespread application pertains to the enhancement of human capital. While it is possible to make AGI models complete ongoing tasks completely on their own with zero human input, its far more common to see AGI tools be used, well, as tools. What I mean is that firms are not looking to replace human workers with AI ones (certain exceptions may include the manufacturing industry), instead they want to integrate AGI tools into their workforce as a means of optimizing regular processes, allowing them to access and process information with tremendous efficiency. The most observable economic outcome of this is firms being able to cut costs in human capital requirements, allowing them to achieve the same level of workflow with a smaller number of employees, or outsourcing solutions to business processes by way of automation utilizing AGI. The possibilities are endless and the economic impact of AGI appears to write itself new economic theory to explain how business growth is accelerating in unprecedented ways.
Semiconductor Physical Limitations: Blessing or Burden?
In 1965, Gordon Moore articulated his observation which would come to be known as Moore's Law. He observed that the number of transistors in an integrated circuit doubles approximately every 2 years. Based not so much on law of physics, Moore's law describes an empirical relationship between time and the number of transistors per chip, suggesting that the rate of production advancements would allow for such doubling to occur on a biannual basis. And to Gordon's own surprise, he was right. Transistor count for a given chip roughly doubled every 2 years for the following 50 years. However, Gordon also predicted that Moore's Law would come to an end in 2025, where transistor sizes would reach the physical limit of 2 nanometers (10-15 silicon atoms in width). While it may appear as a bottleneck to the semiconductor and AI industry, not being able to fit anymore transistors on one chip, but in reality, this limitation pressures companies to pursue innovations such as semiconductor packaging, which is NVIDIA's bread and butter. This technique allows for the stacking and integrating of many different chips to perform together as one. This technology has already proven wildly successful and is the backbone to virtually all of NVIDIA's GPU products. Google has invented their own method to getting around the physical limitation of silicon chips, producing AI-specialized integrated circuits known as Tensor Processing Units (TPUs). Catering these innovative solutions to expanding the frontier of AGI is almost a given.
How to play this market: A Technical Approach
If you have made it this far, I commend you. The following describes my approach to analyzing price activity in SOXL:
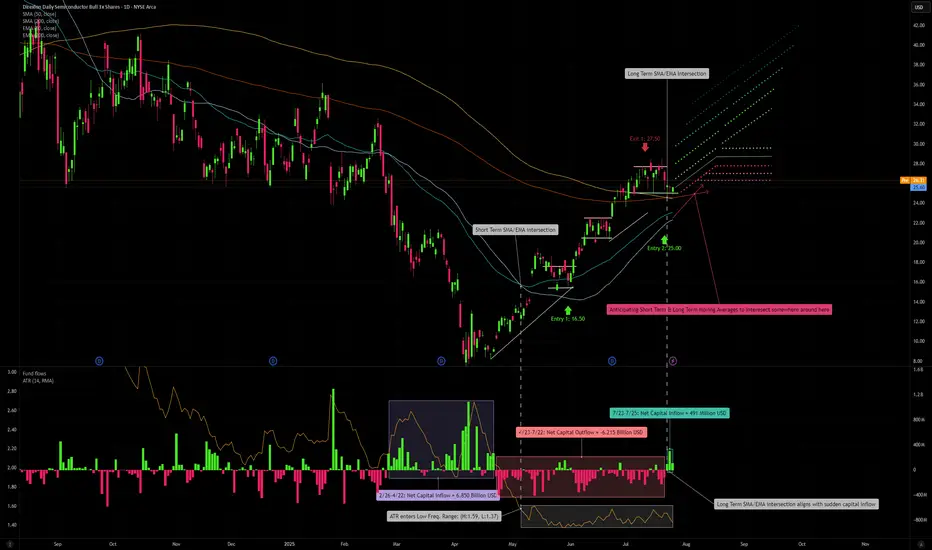
My First entry into SOXL took place on 5/30 with a unit cost of 16.50 USD. Two things can be noted prior to this entry. 1: Fund flows during late February, into March, and through April were extremely high, net inflow of 6.85 Billion USD, however price movement did not reflect the huge inflow until late April/early May where we began to see upward price direction. The beginning of June marked the start of the market bull rally which consolidated into our current price range of 25-28 USD, following contingent earnings releases of NASDAQ:ASML , NYSE:TSM , NASDAQ:NXPI and NASDAQ:INTC . The most recent pullback was a combination of a slightly concerning outlook from ASML, stating that tariffs on the EU would negatively affect projected sales growth for the 2026 fiscal year. As for TSM, there is not one concerning thing that could be said regarding the state of its business growth other than the New Taiwan Dollar gaining considerable strength over the USD amid trade relations between the US and Taiwan, affecting TSM's gross margin by an estimated 6%. NXPI released a sub par earnings and revenue growth outlook, but in my opinion this is not to be too heavily objectified as NXPI produces chips primarily for the Automotive sector, thus making it's sales heavily contingent on supply chain issues being faced by automotive manufacturers in leu of tariffs. NXPI carries a 3.5% market share in semiconductors whereas TSM carries a 68% market share. Lastly, INTC, earnings release I am almost embarrassed to talk about. If it were up to me I'd say they sell their plants in Ohio to TSM and look into opening a fruit stand instead. The most important earnings releases have yet to come though. NASDAQ:MSFT is just around the corner on 7/30, and NASDAQ:NVDA announces on 8/27. These two earnings reports will carry major weight in hinting the overall direction, momentum the market sees in AI demand growth, and the technology sector as a whole. Speculating, I have high expectations that both MSFT and NVDA will top all estimates, pushing the bar higher for 2025 into 2026.
If we look at our short-term 50-day SMA/EMA, you will notice a crossover occur on 5/6, a minor indication of a short term positive trend. Alone this is insignificant, but if we look at our 14-day Average True Range, we can see that this crossover aligns with a fall in ATR that would persist between the values of 1.37 and 1.59. This low ATR value signals that trailing volatility is actually quite low for semiconductors, considering the currently mixed market sentiment. Further along we see that price has crossed above both our long-term, 200-day SMA/EMA and a crossover occurred between the two on 7/23, serving as a small indication of a positive long term trend. Once again, not super significant on its own, but you will notice that the convergence aligns perfectly with a sharp increase in fund inflows, netting 491 Million USD in a matter of 3 trading days. If we see a continuation of net inflows over the several days, we can expect a near future extension of our bull rally, a semi-cyclical wave of inflows that concentrate during consolidation periods (which we have seen take place in the current price range between 25-28 USD following my first exit at 27.50 USD). If we extrapolate both our short-term and long-term SMA/EMA, we can anticipate a crossover to occur in the coming days to weeks. If this occurred, that would further reinforce our expectation for a positive long term trend. I have already locked in my entry 2 with a limit order executed at 25 USD. If all of the above conditions are met, I would confidently predict that we may see SOXL trade at around 42 USD in the coming months.
One more thing I would like to note, if we zoom out to our 5 year historical price progression, we can identify the previous high of 70.08 USD occurring on 7/11/2024. We know that the bull rally which took place in July of last year can be attributed to the first realization of AI as a driver for semiconductor demand, combined with renewed interest in GPU technology for applications in crypto. If we compare AI-related Capital Expenditure in fiscal year 2024 to AI-related Capital Expenditure of the first half of 2025 fiscal year: 246 Billion USD made up AI-related CapEx for all of 2024, vs first 6 months of 2025, adding up to 320 Billion USD. That is a 30% increase in capex, and we still have another 5-6 months to go. Just some food for thought.
Do you believe all of the above has been priced into SOXL, leave your thoughts in the comments!
Disclaimer
You must obviously keep in mind, SOXL is a 3x leveraged ETF, you can expect volatility with such type of investment. However, in capturing a bullish market, a 3x leveraged investment may produce greater than 3x the returns as the underlying (non leveraged) assets, due to the effect of compounding growth of returns over time. However, the same is true for sideways, or bearish markets, losses may be amplified to greater than 3x. If this is an uncertainty you do not wish to be exposed to, I would opt for the non-leveraged Semiconductor ETF ( NASDAQ:SOXX ), or divide your allocation across the top 5-10 equity holdings of SOXL. Please remember to employ your OWN due diligence before making any investment decision, as none of what I am saying shall serve as financial advise to you, the reader.
Economicanalysis
All Employees to Population Flashing CAUTION!As I have been saying in chat. It is hard to increase revenues, profits, and EPS without more workers producing. We have seen that reality play out in the data. Deporting prime-age labor and imposing taxes on ourselves is certainly not going to help. There is only so much output an economy is capable of. Giving tax cuts to the rich certainly won't change how much output an economy can generate. Reciprocating tariffs certainly won't help exporters grow profit or create jobs.
Caution is in order!

Will the Australian Dollar Survive the Perfect Economic Storm?In the intricate dance of global financial markets, the Australian dollar stands at a critical crossroads, facing a confluence of economic challenges that threaten its stability. The convergence of complex factors—including the Federal Reserve's cautious monetary policy, China's economic headwinds, and Australia's domestic economic pressures—creates a perfect storm of uncertainty that challenges traditional economic assumptions and investor strategies.
The current landscape reveals a nuanced battleground where geopolitical tensions, central bank decisions, and macroeconomic indicators intersect with unprecedented complexity. Projections suggest the Australian dollar could potentially decline to 62 cents against the U.S. dollar in early 2025, a forecast that speaks to deeper structural challenges facing the Australian economy. The Reserve Bank of Australia's delicate balancing act—managing persistent inflation, maintaining economic growth, and responding to global economic shifts—epitomizes the sophisticated challenges confronting modern monetary policy.
Beyond just numbers, this economic narrative reflects a significant test of resilience and adaptability. Investors and economic strategists face a unique moment of transformation, where conventional economic models are being challenged by unprecedented global dynamics. The interaction between U.S. monetary policy, China's economic challenges, and Australia's domestic economic strategy creates an intriguing intellectual puzzle that requires sophisticated analysis and a forward-thinking approach.
As the global economic landscape continues to evolve, the Australian dollar's journey becomes a microcosm of broader economic transformations. This is not simply a story of currency fluctuation, but a testament to the complex, interconnected nature of global financial systems—where every decision, from central bank policies to geopolitical strategies, can send rippling consequences through international markets. The true measure of economic strength lies not in avoiding challenges but in the ability to navigate them with insight, agility, and strategic foresight.

Title: Ringgit Rally Fuels Foreign Bond Inflows: A Deep DiveThe Malaysian ringgit has experienced a substantial appreciation, driven by robust foreign investment in the domestic bond market. A surge in capital inflows, totaling RM5.5 billion in July alone, has propelled the ringgit's performance. This analysis delves into the underlying economic factors driving this trend, examining key indicators and assessing the outlook for sustained growth. While the current trajectory is promising, investors must remain cognizant of potential global economic headwinds.
Key Points:
Strong foreign inflows into Malaysian bonds
Ringgit's appreciation driven by multiple factors
Deep dive into economic indicators shaping USD/MYR
Assessment of Malaysia's economic fundamentals
Cautious outlook amid potential global challenges
Key Drivers of the Ringgit Rally:
Currency Appreciation: Investors are buying bonds unhedged, betting on further ringgit gains.
Strong Domestic Economy: Malaysia's economic robustness and expected interest rate stability bolster investor confidence.
Global Factors: Anticipated Federal Reserve rate cuts weakening the USD benefit the ringgit.
Economic Indicators Influencing USD/MYR:
Interest Rate Differentials: Higher local rates attract foreign capital, strengthening the ringgit.
Inflation Rates: Low inflation supports currency value.
T rade Balance: Surpluses strengthen the ringgit, reflecting Malaysia's export strength.
Economic Growth: Domestic consumption and government spending drive economic growth, enhancing the ringgit's appeal.
Political Stability: A stable political climate attracts investment, supporting the currency.
Global Economic Conditions: Global trends and geopolitical events affect investor risk appetite and currency flows.
Outlook:
Malaysia's diversified economy, fiscal prudence, and growing middle class underpin the ringgit's strength. Efforts to boost foreign direct investment and exports further support currency appreciation. However, global uncertainties, US monetary policy shifts, and geopolitical tensions could introduce volatility.

Premium Gold idea for XAUUSD $$$$"Success is not final, failure is not fatal: It is the courage to continue that counts." - Winston Churchill
"An arrow can only be shot by pulling it backward. When life is dragging your back with difficulties, it means it's going to launch you into something great. So just focus, and keep aiming." - Unknown
"Difficult roads often lead to beautiful destinations. The best is yet to come." - Unknown
"The moment you're ready to quit is usually the moment right before a miracle happens. Don't give up." - Unknown
"The only time you fail is when you fall down and stay down." - Stephen Richards
entry 2332.04
Target 2327

Charting the Trade: USDCAD and the Downtrend DynamicsGreetings Traders,
As we anticipate the upcoming week, our attention is firmly on USDCAD, where we are actively assessing a potential selling opportunity around the 1.32600 zone. Engaged in a downtrend, USDCAD demonstrates a sustained downward trajectory. Concurrently, the currency pair is in a correction phase, steadily converging towards the trend at the pivotal 1.32600 resistance area. This numerical level bears significance as both a historical resistance point and a crucial juncture where the correction may intersect with substantial market forces.
Taking a broader economic perspective, let's examine the progression of the US Consumer Price Index (CPI) data, providing insights into the potential market dynamics. The most recent data, dated January 25, 2023, indicates an actual inflation rate of 1.9%, surpassing the forecast of 1.6% and the previous 1.8%. This data points to a pattern of inflation fluctuation over recent quarters. Such variations can potentially influence the sentiment of the Federal Open Market Committee (FOMC) in the forthcoming meeting, hinting at potential adjustments in their approach. Understanding these nuances is crucial for traders, as it suggests the possibility of a dovish USD outlook, impacting currency pairs like USDCAD.
In navigating the opportunities within the USDCAD chart, traders should remain vigilant, aligning their decisions with the evolving economic landscape. The anticipation of a potential dovish sentiment from the FOMC meeting underscores the importance of a strategic approach to trading in the coming period.
Trade safe,
Joe.

XAUUSD new double bottom and potential price movementThis is the same double bottom from yesterdays rushed idea. Thursday 10th and 11th saw a rise from 1706 to 1764. Consequently, due to strong bullish pressure i have changed the neckline from 1706 to 1800. This will be determined in the coming days, if price challenges 1800, with XAUUSD needing to fill in from fib line 0.236 to 0 (This is nearly 4500 pips which seems like a lot however over the 10th and 11th of November price increased by a similar amount). If this occurs it can be considered a good indication for lasting bullish movement to come. If the arrow does get filled in and there are other strong indicators of bullish market pressure (such as candle types or chart patterns) i would look out for support and resistance and place buy signals for a semi long D1 entry and exit.
NEWS:
Friday 11th November:
Prelim UoM Consumer Sentiment came out at 3:00PM in the afternoon uk time.
FROM UNIVERSITY OF MICHIGAN
This measures the level of a composite index based on surveyed consumers.
The survey is of about 500 consumers which asks respondents to rate the relative level of current and future economic conditions.
THIS IS IMPORTANT BECAUSE FINANCIAL CONFIDENCE IS A LEADING INDICATOR OF CONSUMER SPENDING.
CONSUMER SPENDING ACCOUNTS FOR A MAJORITY OF OVERALL ECONOMIC ACTIVITY.
USUALLY: The 'Actual' is greater than 'Forecast' which is good for currency
(GREATER CONSUMER SPENDING THEN FORECASTED = MORE MONEY IN CIRCULATION + HIGHER BUSINESS CONFIDENCE = STRONGER USD
HOWEVER, ON THE 11th NOVEMBER:
ACTUAL LEVEL=54.7 FORECASTED LEVEL=59.5
THIS IS BAD FOR THE USD AS IT MEANS THERES LESS CONSUMER SPENDING WHICH WOULD DECREASE FINANCIAL CONFIDENCE WHICH WOULD WEAKEN THE USD AND THEREFORE HELP DRIVE UP GOLD PRICES. THIS COULD BE THE CLUE BULLS ARE LOOKING FOR TO KEEP PRICES UP.
IMPORTANT NOTE:
THE LAST TIME ACTUAL WAS LOWER THEN FORECASTED WAS SEPTEMBER 16TH AND WHEN THE NEWS CAME OUT AT 3, THE DOWNTREND STOPPED AND PRICE STARTED CONSOLIDATING BEFORE HAVING A SMALL BEARISH EPISODE AND EVENTUALLY HAVING BULLISH MOVEMENT OUT OF THE PRICE ZONE.
THIS SUGGESTS THAT ALTHOUGH THIS DATA HAS A SLIGHT EFFECT TO BOOST BEARISH PRESSURE, IT ISNT A STRONG EFFECT AND SO MAY NOT EFFECT PRICE AS MUCH.

RBA and May31 Rate DecisionFundamentals:
The RBA in December's meeting was a hawkish stance. This suggests that going forward, their monetary policy will continue to be hawkish. Coupled with that, given the pandemic's effects on the Australian economy, the Australian government's fiscal policy will be at the forefront of their minds in stimulating their economy. This is a two for one punch and should have effects on the Australian currency.
Conclusions:
We have a country that is forced in a corner to take action by their own desire and resolve to prop up their economy. We have a situation where risk has the potential to prevail should the economy is able to recover from the lockdown measures that took place recently. We have a populace that is mobile, able and ready to work should the pandemic situation has improves. This is potentially, good news for the currency.
Trades:
AUDNZD and AUDUSD
