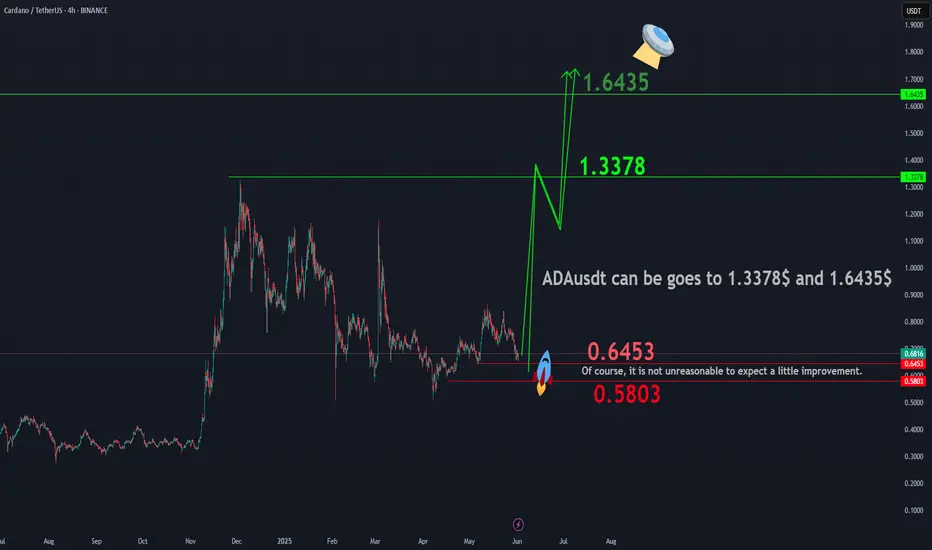
ADAUSDTBINANCE:ADAUSDT shows potential for an upward movement towards the targets of $1.3378 and $1.6435, making the current price zone attractive for long-term investment . While a correction towards $0.6453 or even $0.5803 is possible, these levels present favorable buying opportunities for investors with a long-term perspective. Even if a deeper correction occurs, the market geometry suggests that reaching the aforementioned targets is a likely outcome.
Economic Cycles
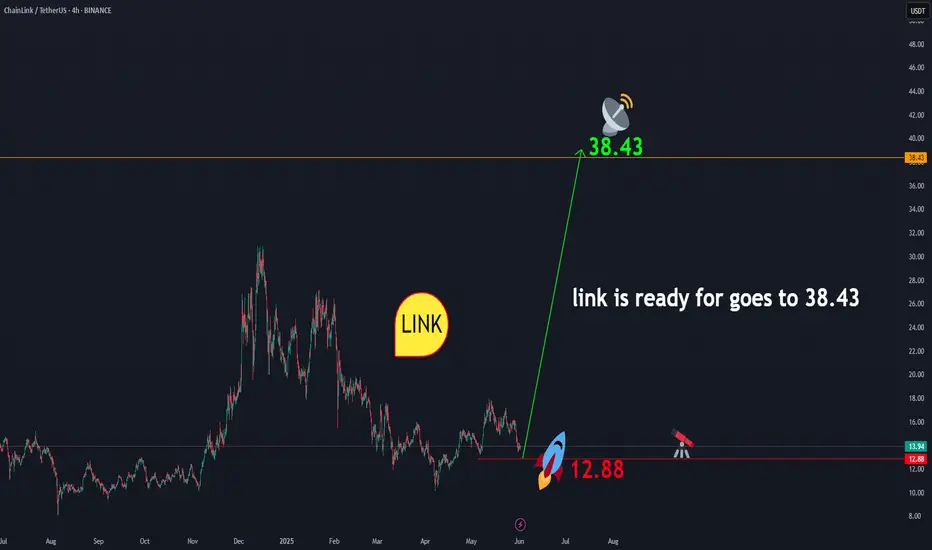
linkusdtLINK is showing readiness to initiate an upward movement towards $38.43. From the current price range of $13.93, a correction down to the $12 area is possible. This zone presents a favorable opportunity for long-term investment . In any case, according to the geometry that has formed in LINK, the price level of $38.43 is expected to be achieved. And this is certain.
BINANCE:LINKUSDT
Sleep Number Company | SNBR | Long at $6.99Sleep Number Company $NASDAQ:SNBR. Closed all existing open price gaps on the daily chart below its current rice. The overall downward trend is starting to flatten. They make all their products in the US and have minimal exposure to international markets (reduced risk around tariffs). Understandably, recession risks are high and such a company would be impacted. Plus, their debt is pretty high. This is a risky investment, but from technical analysis perspective, there could be a future rebound in the near-term. Thus, at $6.99, NASDAQ:SNBR is in a personal buy zone.
Targets:
$10.00
$12.00

[ TimeLine ] Gold 26-27 May 2025Hello everyone,
📅Today is Sunday, May 25, 2025
📌 Upcoming Signal Dates:
• May 26, 2025 (Monday)
• May 27, 2025 (Tuesday) (using 2 candles)
🧠 Trading Plan & Notes:
✅ Gold has experienced a sharp bullish move of over 1000 pips, breaking out from the ranging area 3255 to 3366
⚠️ If the upcoming Hi-Lo range is wide and shows bullish continuation, consider entries on corrections after breakout or setups based on Fibonacci retracement
✅ I will be trading both signals as part of my ongoing research and strategy
⚠️ If you're feeling risk-averse or uncertain, it's totally fine to skip the May 26 or May 27–28 (2-candle) signals
📋 Execution Plan:
🔹 Wait for the Hi-Lo range from the selected candles to fully form. These will be initially marked with purple lines on the chart, and I’ll update the chart with additional indicator lines once the range is fully confirmed after market close
🔹 Entry will be triggered on breakout, with a 60-pip buffer
🔹 If the trade hits Stop Loss (SL), cut/switch and double the position on the next valid setup to attempt recovery
📉📈 Chart Reference:
🔗 Copy & paste this code into TradingView URL: TV/x//BjdZ9IgR/

THE WALES ARE BUYINGAs you'll know there is no movement without correction, It seems we will hit new ATH (120k) by middle of the June

XAUUSD Sideway in Price range?Long entry: 3280 - 3290
SL: 3273
TP: Daily Open Price, 1.5R:R
Short entry: Supply Zone or Caution message
SL: 3360, Upper Swing
TP: Lower Low, 2 R:R

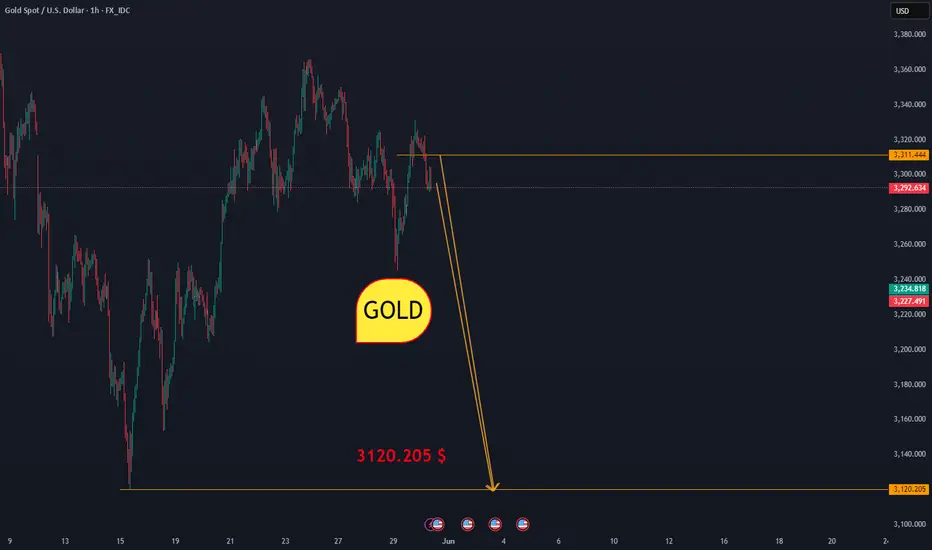
GOLDThe possibility of a fall to 3120.20 is smooth and the situation will only become critical when the price crosses above 3325. This fall may have traps.
CMCMARKETS:GOLD
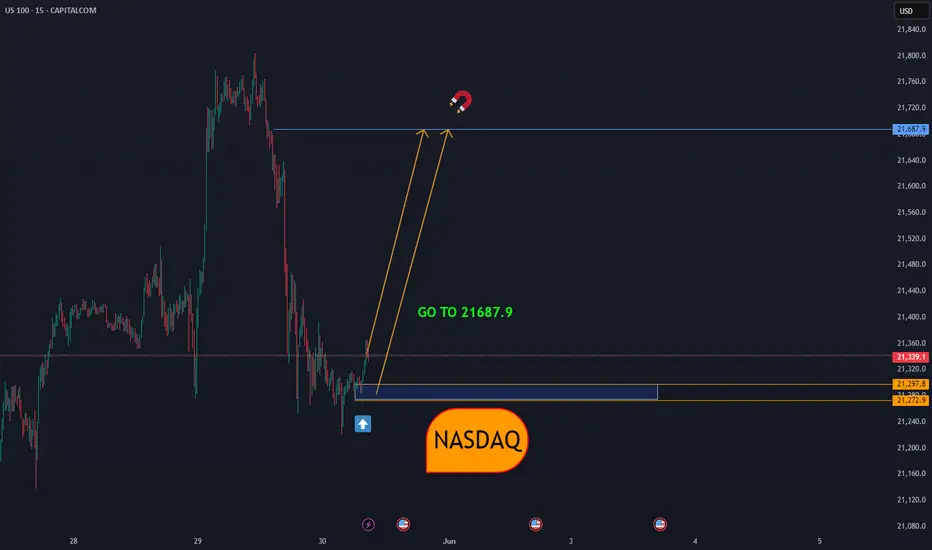
NASDAQGiven the geometry that has been created, there is a possibility of a correction towards the price of 21687.9, either from the current price or from a little lower, if the bottom of 21219 is broken, another decision must be made.
NASDAQ:NDX
ETH | New ATH on the cards | Fibonacci $7K TARGET Ethereum is gearing up towards the upside and we're seeing another resistance zone being crushed.
While BTC is trading sideways, we can expect ETH to play catch-up:
Don't miss yesterday's update on DOT:
_____________________________

NASDAQThe target is for the price of 21272.4 to fall, with any correction if the ceiling of 21802 is not broken, a short trade can be made.
CAPITALCOM:US100

ETHUSDTEither from the current price or from the price of 2653.06, the areas worth buying are at $2852, in either case the price will reach 2852. BINANCE:ETHUSDT

What is Happening to Puma?Puma's stock has experienced a significant decline, dropping nearly 50% year-to-date and reaching its lowest levels in almost a decade . This downturn is attributed to several factors, including underwhelming financial performance, escalating competition, and macroeconomic challenges.
Financial Performance:
In 2024, Puma reported a 4.4% currency-adjusted increase in sales, totaling €8.82 billion . However, profitability did not keep pace; net income declined by 7.5% to €282 million, and EBIT remained flat at €622 million, falling short of analyst expectations . The company's P/E ratio stands at 17, which some analysts consider high given the current earnings yield of 2.8% .
Debt and Balance Sheet:
Puma's financial health shows a debt-to-equity ratio of approximately 48.2%, with total debt at €1.3 billion and shareholder equity at €2.7 billion . While the company has a solid capital base, increased interest payments have impacted income .
Competitive Landscape:
Puma faces intense competition from industry giants like Nike and Adidas. Nike holds a significant market share, while Adidas has recently increased its share to 8.9% . Puma's market share stands at approximately 4.94% . The company's efforts to boost sales through new product lines, such as the Speedcat trainers, have yet to yield significant results .
Macroeconomic Challenges:
Global economic factors have also played a role in Puma's struggles. Trade disputes and currency volatility have negatively impacted sales, particularly in key markets like the U.S. and China . Additionally, new U.S. tariffs on imports from China, where Puma sources 28% of its products, have created further uncertainty.
Strategic Response:
In response to these challenges, Puma has announced plans to cut 500 corporate positions globally by the end of the second quarter of 2025 to reduce costs . The company has also appointed former Adidas executive Arthur Hoeld as its new CEO, effective July 1, 2025, aiming to revitalize its performance .
In summary, Puma's recent stock decline reflects a combination of internal financial challenges and external market pressures. While the company is taking steps to address these issues, including leadership changes and cost-cutting measures, it remains to be seen how effectively Puma can navigate the competitive and economic landscape moving forward.
- *Disclaimer: This is just my personal opinion and not financial advice. I am not a professional financial advisor. Please do your own research before making any investment decisions. Any losses incurred are solely at your own risk.The figures that i found might not all be correct, as I do sometimes make mistakes, so do your own due diligence.*

Skeptic | USD/JPY Analysis: Bearish Momentum Fuels Short Setups!Hey everyone, Skeptic here! I know some of you might’ve missed our last USD/CHF short signal that hit a sweet 3:1 R/R—no worries! 😊 The market’s always here, so missing a trade isn’t the end of the world. I’m not here to push FOMO; my goal is to take you on a long-term trading journey, and I’m stoked to have you along for the ride! :))) Let’s get back to USD/JPY and break down the latest action. 📊
Daily Timeframe: The Big Picture
First, let’s zoom out and talk about the DXY (US Dollar Index), which recently broke the 99.005 support and turned bearish. This puts USD-based pairs like USD/JPY in the spotlight for short opportunities this week. Here’s what’s happening with USD/JPY:
Trend Context: The major trend is bearish. Last week, sellers showed no mercy to buyers, and with DXY’s bearish move, we’re likely to see more of the same this week.
Key Level: We’re currently reacting to a major daily support at 142.305. Expect a range or reaction here, so we must wait for confirmation before shorting.
Recent Correction: The prior correction reached the 0.50% Fibonacci retracement and seems to have resumed the major bearish trend.
With this in mind, let’s zoom into the 4-Hour Timeframe to hunt for long and short setups.
4-Hour Timeframe: Long & Short Setups
The 4-hour chart is giving us some clear signals to work with. Here’s the plan:
Short Setup:
Key Level: The 142.338 level is critical, as it formed a ceiling at 148.569 in the past and acted as support before.
Trigger: If we form a lower high and then break below 142.305, open a short position.
Confirmation: Use RSI to back up the breakout, ensuring momentum aligns.
Why It Works: A lower high signals increasing weakness in this support, making a break more likely.
Long Setup:
My Take: I personally don’t have a long trigger right now. Both the major and minor trends are downtrends, so going long doesn’t make sense in these conditions.
If You Insist: If you’re set on a long, wait for a break above 144.125. But keep it tight—low risk, small stop loss, and take profits quickly once you hit a decent R/R.
💬 Let’s Talk!
If this analysis sparked some ideas, give it a quick boost—it really helps! 😊 Got a pair or setup you want me to dive into next? Drop it in the comments, and I’ll tackle it. Thanks for joining me—see you in the next one. Keep trading smart! ✌️

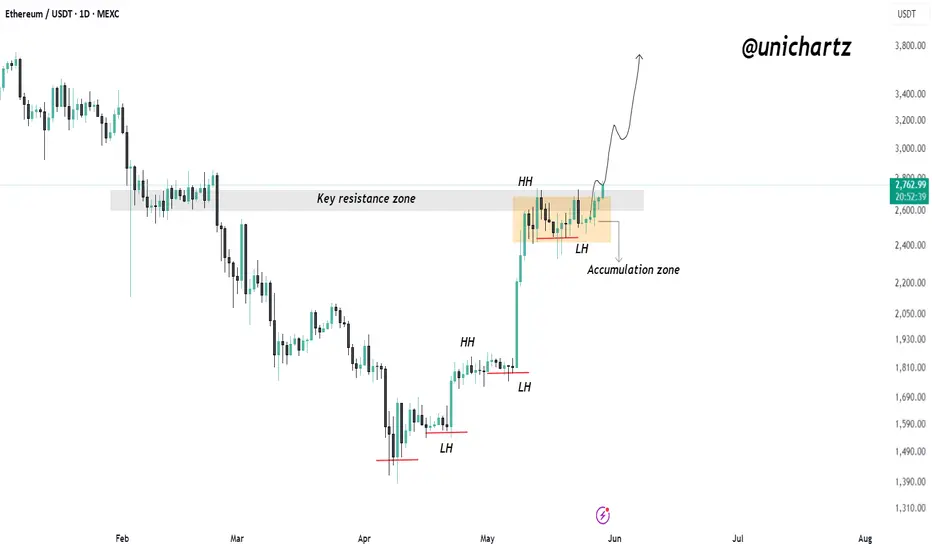
ETHUSDT Bullish Structure Intact: Higher Highs Continue#ETHUSDT – 1D Chart
Ethereum is in a strong uptrend, consistently forming higher highs (HH) and higher lows (LH).
Price recently broke above a key resistance zone after consolidating in an accumulation range. This breakout confirms bullish strength.
If ETH holds above this zone, we could see a continuation move to the upside in the coming days.
Structure remains bullish — trend is intact.
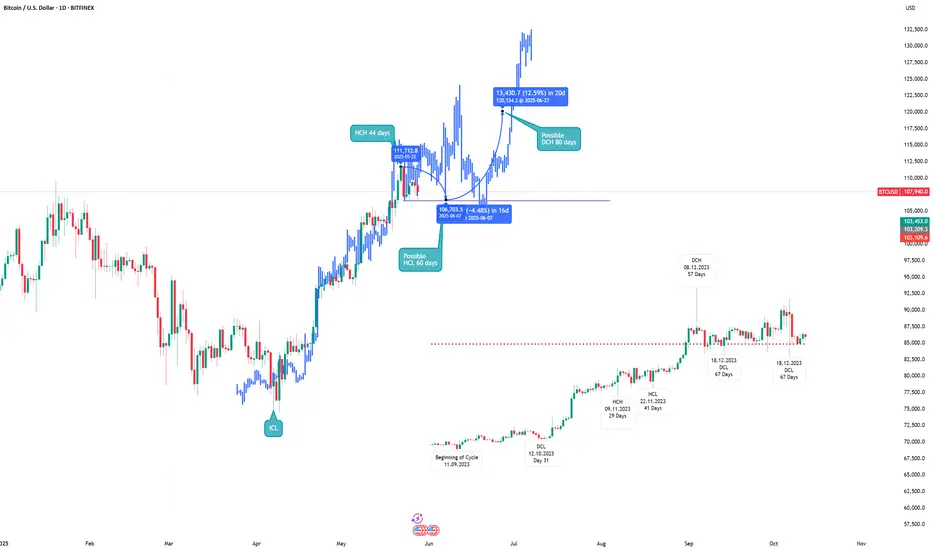
BTC bullish idea (based on 2023 pattern)Until 10th of june it needs to print DCL. If we follow the same pattern with 2023 a close range then an inefficiency can be expected to reach daily cycle high.
GBP/USD Bearish Signal | Technical + Custom AlgoSmart Sell Signal | GBP/USD – Powered by Custom Algorithm & Technical Precision
This sell signal is generated by a proprietary trading system I’ve developed, combining pure technical trend logic with automated decision-making.
The algorithm:
Confirms reversal signals through layered filter logic
Defines clean entry, stop-loss, and target zones — all fully automated
No human judgment, no discretionary trades — just objective data turned into actionable analysis.
🧠 Built on precision. Backed by testing.
📉 Current outlook: Bearish sentiment confirmed on multi-timeframe structure.
📌 Disclaimer: This is not financial advice. For educational and analytical purposes only.

XAUUSD Bullish Signal | Technical + Custom Algo📈
This signal is the result of a fusion between classic trend analysis and a proprietary algorithm I’ve personally developed.
First, the system identifies the market trend strictly through technical indicators — no emotional bias, no subjective interpretation.
Next, a custom-built intelligent algorithm analyzes the data to pinpoint optimal entry and exit points, then generates the signal.
🔍 The outcome? A fully data-driven signal — no guessing, no personal bias involved.
📌 Note: This signal is intended for educational and analytical purposes only. Trading is at your own risk.

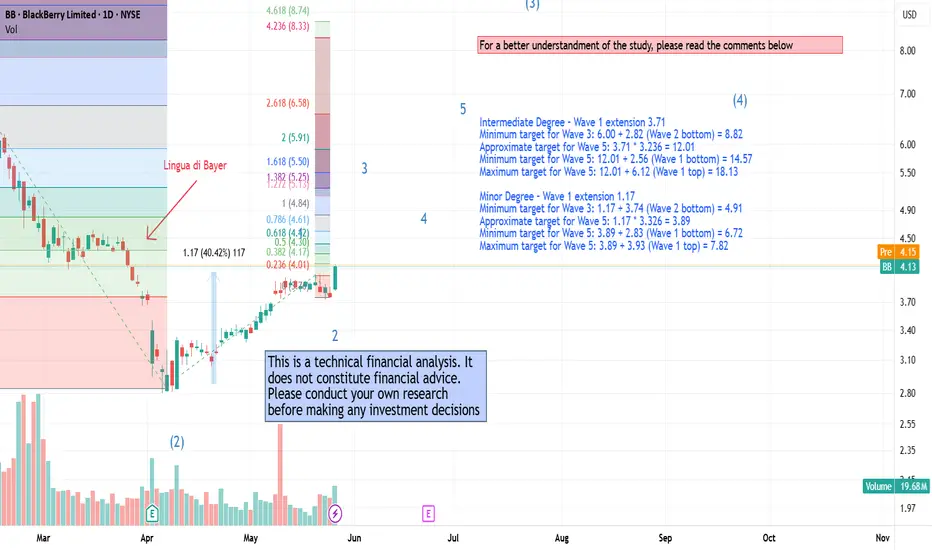
Blackberry Update-Review - Let the Bulls drive in !In the previous analysis, we observed the formation of an impulsive 1-2-3-4-5 structure of a cycle according to Elliott Wave Theory, which was invalidated by a downside breakout (caused by tariff-related uncertainties).
After a period of consolidation, during which trading was mostly driven by algorithms, it now appears that technical analysis has once again become relevant.
In this study, we examine the targets of an Minor-degree impulsive wave, typically lasting up to 6 months, as well as those of a Intermediate-degree wave, which can span 2–3 years and is considered to have started in November 2024.
These are probabilistic scenarios, and it is important to remember that Elliott Waves were originally developed for analyzing stock market indices.
Personally, I believe Blackberry is the most undervalued tech stock on the market!
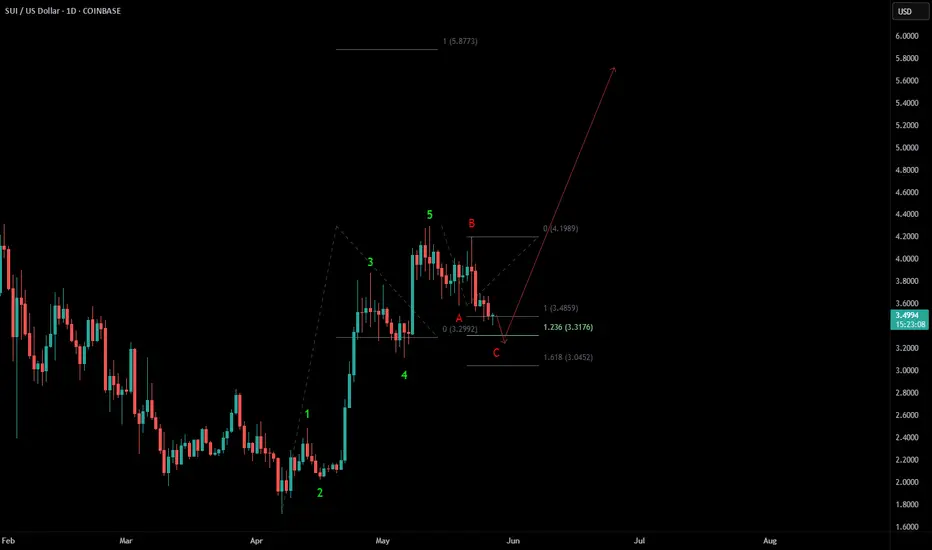
Bullish sequence in SUIUSD Since 4.07.2025 low, SUIUSD is showing the 5 swing bounce, which indicates that it will extend higher, once the pullback ends in 3, 7 or 11 swings pullback. Short term, it favors 3 swing pullback in A-B-C between 3.4859 - 3.0452 area before it resume higher. Further upside above 5.12.2025 will confirm the rally towards 5.85 or higher levels. But it and do double correction, if fail to break above 5.12.2025 high after ending the current pullback.
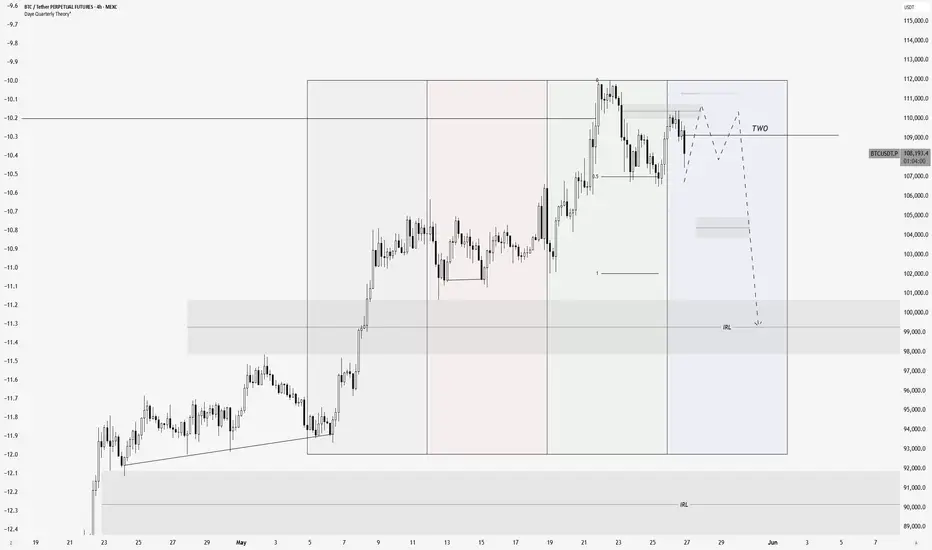
QT - BTCPlan for BTC,
Since the Draw On Liquidity is met, a reversal is likely to become before a next expansion until the end of 2025. However, this reversal would likely to be a small retracement on a HTF trend. Another reason is that QE has not been eased, leading to the fact that this pump is just a pump by retails not Whale or Smart Money. On chain data shows that people who hold from 100-10k BTC has been in a neutral state while under 1 BTC has been extremely bullish.
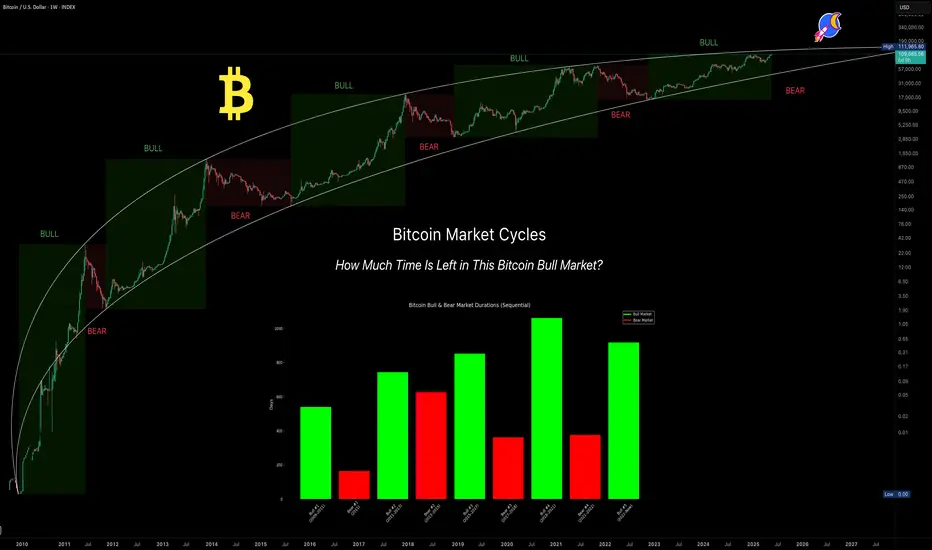
Bitcoin's Market Cycles — Are We Nearing the Top?Bitcoin is approaching a critical moment and the signs are everywhere.
After more than 900 days of steady bull market growth, BTC now flirts with all-time highs (ATH) while momentum stalls, liquidity thins, and emotions run hot. You might be asking:
Are we nearing the cycle top?
Is now the time to de-risk or double down?
What comes next?
This isn’t just a question of price. It’s about timing, structure, and psychology.
In this analysis, we’ll break down Bitcoin’s historical cycles, the current macro structure, the hidden signals from Fibonacci time extensions, and how to think like a professional when the crowd is chasing FOMO.
Let’s dive in.
📚 Educational Insight: Understanding Bitcoin Cycles
Bitcoin doesn’t move in straight lines, it moves in cycles.
Bull markets grow slowly, then explode. Bear markets fall fast, then grind sideways. These rhythms are driven by halving events, liquidity expansions, and most importantly: human emotion.
Here’s what history tells us:
Historical Bull Markets:
2009–2011: 540 days (+5,189,598%)
2011–2013: 743 days (+62,086%)
2015–2017: 852 days (+12,125%)
2018–2021: 1061 days (+2,108%)
2022–Present: 917 days so far (+623%)
Bear Market Durations:
2011: 164 days (-93.73%)
2013–2015: 627 days (-86.96%)
2017–2018: 362 days (-84.22%)
2021–2022: 376 days (-77.57%)
💡 What does this tell us?
Bull markets are growing longer, while bear markets have remained consistently brutal. The current cycle has already surpassed the average bull run length of 885 days (cycles #2–#4) and is quickly approaching the 957-day average of the two most recent cycles (#3 and #4). That makes this the second-longest bull market in Bitcoin’s history.
⏳ 1:1 Fibonacci Time Extension — The Hidden Timing Signal
In time-based Fibonacci analysis, the 1.0 (1:1) extension means one simple thing: this cycle has now lasted the same amount of time as previous cycles — a perfect time symmetry.
Here’s how I measured it:
Average bull market length #2–#4(2011–2021): 885 days
Average bull market length #3–#4(2015–2021): 957 days
Today’s date: May 27, 2025 = Day 917
✅ Result: We are well inside the time window where Bitcoin historically tops out.
You don’t need to be a fortune teller to see that this is a zone of caution. Markets peak on euphoria, not logic and this timing confluence is a red flag worth watching.
🗓️ "Sell in May and Go Away" — Not Just a Meme
One of the oldest market adages is showing its teeth again.
Risk assets — including Bitcoin — tend to underperform in the summer months. Why?
Lower liquidity
Institutional rebalancing
Exhaustion from prior run-ups
Vacations and reduced trading volumes
And here we are:
Bitcoin is hovering near ATH
It's been in an uptrend for 917 days
We just entered the time-extension top zone
Liquidity is thinning across the board
You don’t need to panic. But you do need to think like a professional: secure profits, reduce exposure, and wait for structure.
😬 FOMO Is a Portfolio Killer
This is where most traders make their worst decisions.
FOMO (Fear of Missing Out) isn’t just a meme — it’s the reason so many people buy tops and sell bottoms.
Before entering any trade right now, ask yourself:
Where were you at $20K?
Did you have a plan?
Or are you reacting to headlines?
📌 Clear mind > urgent clicks
📌 Patience > chasing green candles
📌 Strategy > emotion
Let the herd FOMO in. You protect your capital.
Will This Bear Market Be Different?
Every past cycle saw BTC retrace between 77%–94%. That was then. But this time feels… different.
Here’s why:
Institutions are here — ETF flows, sovereign wealth funds, and major asset managers
Regulation is clearer — and risk capital feels safer deploying in crypto
Supply is tighter — much of BTC is now held off exchanges and in cold storage
While a massive crash like -80% is less likely, that doesn’t mean a correction isn’t coming. Even a 30%–40% drop from here would wreak havoc on overleveraged traders.
And that brings us to…
🚨 Altseason? Or Alt-bloodbath?
Here’s the hard truth:
If BTC corrects, altcoins will crash — not rally.
Most altcoins have already seen strong rallies from their cycle lows. But if BTC drops 30%, many alts could tumble 50–80%.
Altseason only happens when BTC cools off and ranges — not when it dumps. Don’t get caught holding the bag. Be tactical. Be disciplined.
So Where’s the Next Big Level?
You may be wondering: “If this is the top… where do we fall to?”
Let’s just say there’s a very important Fibonacci confluence aligning with several other key indicators. I’ll reveal it in my next analysis, so stay tuned.
🧭 What Should You Do Right Now? (Not Financial Advice)
✅ Up big? — Take some profits
✅ On the sidelines? — Wait for real setups
✅ Emotional? — Unplug, reassess
✅ Are you new to Trading? — study, learn (how to day trade) and prepare for the next cycle
The best trades come to the calm, not the impulsive.
💡 Final Words of Wisdom
Bitcoin rewards discipline. It punishes emotion.
Right now is not about catching the last 10% of upside — it’s about:
Watching structure for potential trend change
Measuring risk
Avoiding overexposure
Protecting what you’ve earned
📌 The edge isn’t in indicators. It’s in mindset. Stay prepared, stay sharp because in this market…
🔔 Remember: The market will always be there. Your capital won’t — unless you protect it.
The next big opportunity doesn’t go to the loudest.
It goes to the most ready.
_________________________________
Thanks for reading and following along! 🙏
Now the big question remains: Is a bear market just lurking around the corner?
What are your thoughts? Let me know in the comments. I’d love to hear your perspective.
_________________________________
If you found this helpful, leave a like and comment below! Got requests for the next technical analysis? Let me know.
Great Many Trades in AdvanceThis chart contains the timings for several turns and accelerations in Bitcoin for intraday setups.
Make sure the price is at a meaningful support or resistance when coincident with a vertical line.
This technique also derives some horizontal lines for support and resistance, but you should use your levels as well.

Bitcoin to 140k - 170k (26MAY2025)On monthly timeframe we have few trendlines which show us, 140 to $170,000 is likely according to the 100% of Fibonacci Extension as well, but above that is unlikely IMO.
