Altcoin Market (OTHERS) Cycle Analysis: To the Moon !Let’s take a closer look at the previous bull cycle of the Others (Altcoin Market Cap excluding BTC & ETH) chart.
Before the major upward move, the market declined for months, eventually finding strong support around the $170B level.
After forming a higher low and a clear change of character (CHOCH), the market entered a sustained bullish phase. For 124 consecutive days, we witnessed a strong altcoin rally.
As of now, price action appears to be mirroring that same structure — but with a potential to push even higher than the previous ATH.
In this scenario, the target stands around the $470B level. As long as OTHERS holds above the $170B support, the altcoin market remains in recovery mode, and further upside is very much on the table.
— Thanks for reading.
Economic Cycles

Big, but biggerIn fact, I think it's possible that BTC will leave a CME gap (yellow box) unfilled for the first time since October 2020, and that we're repeating the marked 2020 fractal in a much bigger way.

The curve is about to break (the yellow one)I think it's inevitable and what happens next could be beyond imagination. No financial advice!


New York All Transaction House Price Relative Strength IndexAdding a relative strength index calculator to FRED's Quarterly New York All Transaction House Price index reveals similarity between the state of the current housing market to periods preceding previous housing bear markets.

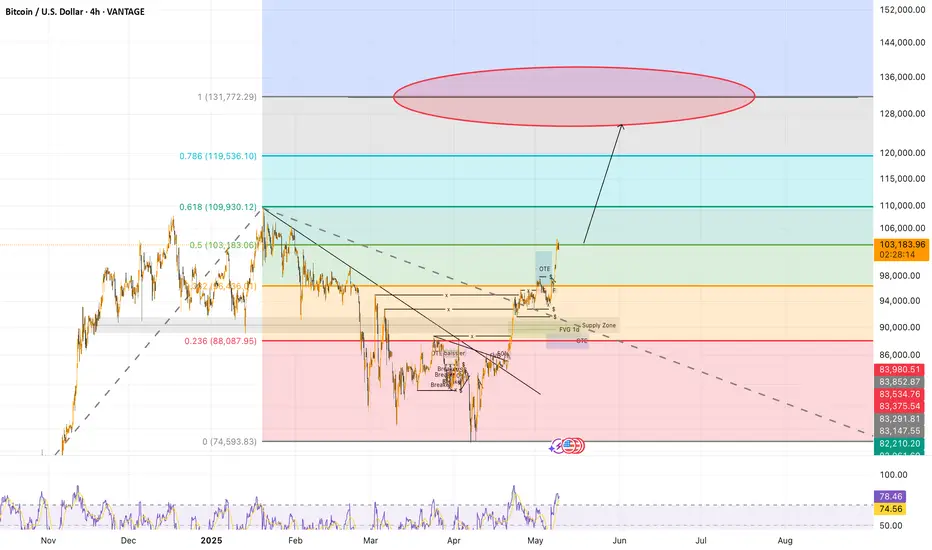
BTC/USD – 4H Quick AnalysisBTC just broke above the bearish OTE zone from the major retracement between 109K and 74K, confirming a strong bullish breakout.
📈 This aggressive move has shifted the market structure firmly to the upside, with momentum clearly in favor of buyers.
🔎 If we extend the Fibonacci levels from this breakout, the next major targets could be around the 130K region and potentially higher, assuming the current momentum holds.
💥 This breakout also indicates that liquidity has been reclaimed without a deep pullback, suggesting that buyers are confidently stepping in without waiting for lower prices.
⚠️ Key observations:
No significant liquidity sweep below recent lows before the breakout – a sign of aggressive buying.
Strong rejection of the FVG 4H, now acting as support if retested.
Clear break of the bearish OTE, removing a major supply level from the market structure.
👉 As long as the price holds above 100K, the path to 130K+ seems increasingly likely, with minimal resistance in the way.
BTC to create a low and then a new ATH!BTC may go low around 95k before pushing for a new ATH. This analysis is based on past price action as seen in red lines and previous circles. It confirms to the basic market structure analysis of HH, HL and HH.
However, do note that past price actions do not indicate certainty of future price. DYOR

[ TimeLine ] Gold 5-6 May 2025📅 Today is Friday, May 2, 2025
📌 Upcoming Signal Dates:
May 5, 2025 (Monday) or
May 5 & 6, 2025 (Monday & Tuesday)
🧠 Trading Plan & Notes:
✅ Gold has undergone a significant reversal of over 2000 pips, from its ATH of 3500 down to 3200
⚠️ If the upcoming Hi-Lo range is wide, consider reversal entries or setups based on Fibonacci retracement levels
✅ I will personally be trading both signals as part of my research and ongoing strategy
⚠️ If you're risk-averse or uncertain, it’s okay to skip the May 5–6 signals
📋 Execution Plan:
🔹 Wait for the price range from the selected candles to fully form (marked by green lines on the chart)
🔹 Entry will be triggered upon breakout, including a 60-pip buffer
🔹 If SL is hit, cut/switch and double the position on the next valid setup for potential recovery
📉📈 Chart Reference:
🔗 Copy & paste this code into TradingView URL: TV/x/C5zZyXar/

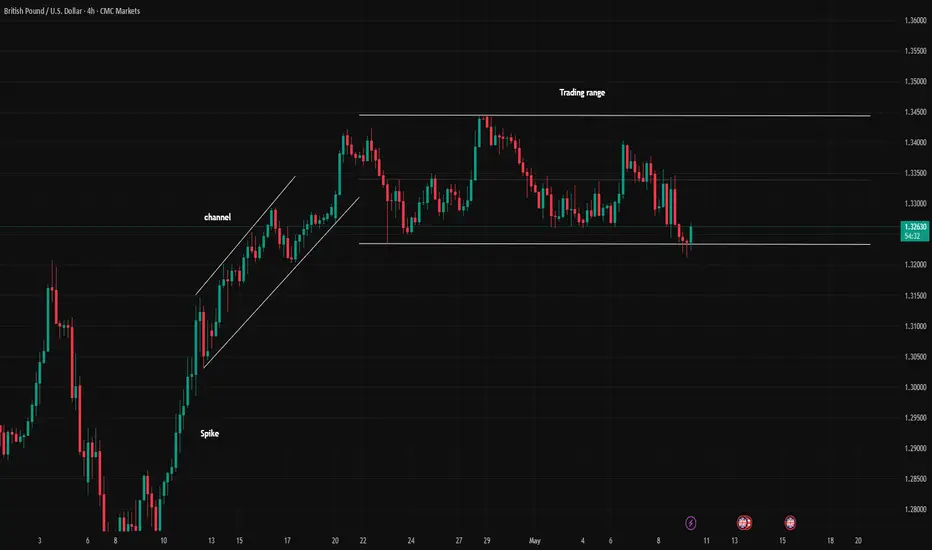
Spike to Range: A Complete Market Cycle UnfoldingPrice has reacted to the bottom of the trading range, forming a signal bar and a key bar, indicating a potential reversal. If confirmed by a breakout on a lower timeframe, this could present a good long opportunity. However, with the Bank of England Governor’s speech scheduled for today, it’s wise to wait for the event before entering any trades. Always apply proper risk management!
EUR/USD Breakdown - Lesson in IDMTook a Loss here by misreading IDM on the 4H.
Price was Breaking Highs, so I leaned bullish, but didn't wait for that full IDM sequence to confirm.
Lesson: Take a few extra minutes to read the Higher TimeFrames Properly. No Rush.
This week's blueprint is simple: patience, clean structure, strong inducement first.
Also noting pair correlations: XAU/USD, EU, AND GU tend to move together. GJ/UJ on their own rhythm.
#SmartMoneyConcepts #IDM #ForexDiscipline
#ChartStudy #GrowthMindset

BTC Elliott wave analysis 5/9/2025 (Big Picture)For me, I think that we are going to the End the wave 5 of the BTC Supercycle . As you can see , the wave that we are now have very small accumulation making it should be wave 5 rather than the begining of new cycle or the correction wave since both usually have large accumulation.The Gann fan suggest that the End of the wave 5 should be around 128,000$-132,000$. And after the time that it finish the wave 5 it would be coincided with the depression that many economist suggest that it would happen.Surprisingly, It also coinside with the Modern Elliott Wave theory suggesting that a Grand Supercycle wave five is nearing completion in the 21st century, likely leading to the deepest economic downturn since the 1700s.

BTC.D done or not?I like to think that 65% may be the top for BTC.D, but it cannot be ignored that BTC.D has gone to around 72% in the last three cycles. Will it do the same this cycle?

XTZ/USD Main trend. Downward channelLogarithm. Time frame 1 week. Main trend.
Idea for understanding the local work zone for traders in the main trend. It will also be useful for investors to understand the cheap/expensive zones for investing.
Linear price chart.
Secondary trend. Downward channel. Area to work. Time frame 3 days.
XTZ/USD Secondary trend. Downward channel.

Bitcoin to Gold RatioOver the long term, Bitcoin and gold have generally moved in the same direction: up. But in the short term, they often behave differently, which creates trading opportunities. The Bitcoin to Gold ratio illustrated here expresses the value of one Bitcoin in ounces of gold.

Temporal Aspect of FractalityIn this publication, I would like to bring some clarity to the series of my unconventional analysis.
At this stage of my research I have no doubt that market's natural growth patterns can be defined by historic range and power exponents of Phi. Essentially, it's just two overall fib channels that cover structural boundaries of bullruns from ATH to new ATH mapped to bottom as 3rd coordinate. When we have angle of fibs derived from chronological highs, the ratios would cover the levels of oscillation from price scale perspective.
Whereas the temporal aspect of fractality, requires looking for frequency of reversals in price dynamics. So instead of connecting pivots of same classification, we interconnect opposite points of extremes in order to tune fib direction to the angle of trend and map 3 coordinate to next swing point. This way the spacings that come with the fib proportions would indicate rhythm of trend occurrence.
The primary objective of this publication is to expose traders to the forces underlying market behavior. Specifically for illustrating temporal rhythms, the end result seen in interactive chart looks like a more simplified version of works i've shared earlier.

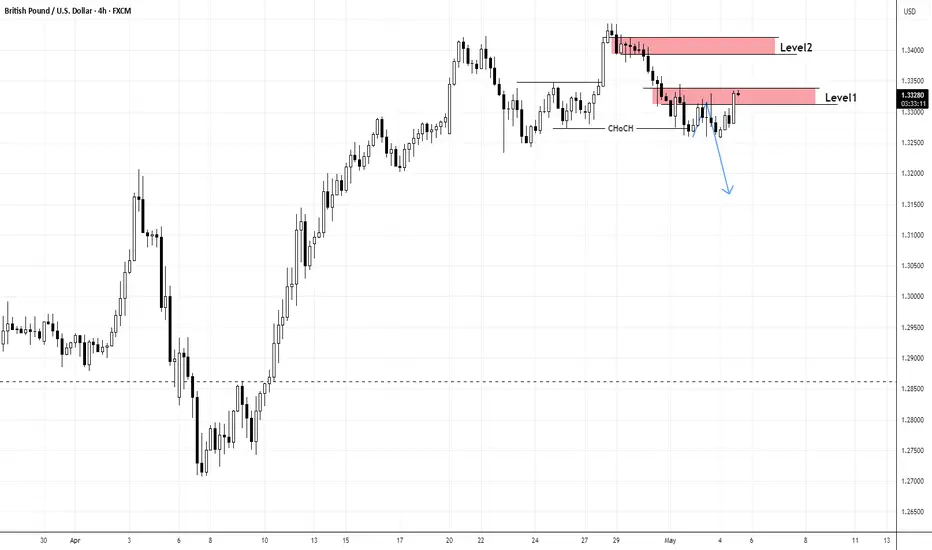
Level 1 Or Level 2, GBPUSD Is Likely Going DownGBPUSD!
N.B!
- GBPUSD price might not follow the drawn lines . Actual price movements may likely differ from the forecast.
- Let emotions and sentiments work for you
- ALWAYS Use Proper Risk Management In Your Trades
#gbpusd
Now That Gold Ended Bearish Weekly, What Next?After the indecision in the upper week, XAUUSD resumed its sell‑off this the trading week and closed below the prior week’s low, locking in a bearish weekly close. With momentum skewed to the downside, a mean‑reversion likely to occur over the next few weeks.
N.B!
- XAUUSD price might not follow the drawn lines . Actual price movements may likely differ from the forecast.
- Let emotions and sentiments work for you
- ALWAYS Use Proper Risk Management In Your Trades
#gold
#xauusd

Gold sellIn my opinion, there is a lot of liquidity in gold at the bottom, and currently, by collecting liquidity at 42, a very good short trade can be made on its re-fall.

People can't imagine what's coming...The last time the monthly MACD for ETHBTC made a bullish cross, ETH went from around $175 to almost 5k. At that time the monthly RSI for ETHBTC was at 46. Now it is at 24 and the monthly MACD is still trending downwards but could turn anytime. Glorious times ahead! No financial advice!
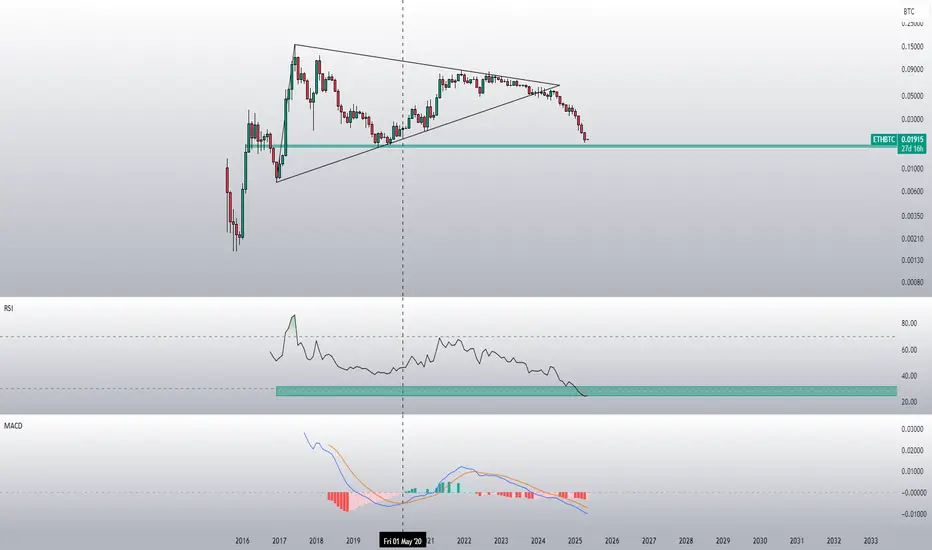
The smell of Altseason...The weekly RSI for ETHBTC is the lowest it has ever been. I expect one last liquidity grab at 0.01615 before the tide turns. No financial advice.

SP500 ETF: Fibonacci MappingAs you may know, Williams Fractals indicator identifies potential reversal points by marking a high (or low) surrounded by two lower highs (or higher lows) on each side, forming a five-bar pattern that signals possible turning points in price. Unfortunately, the simplicity of such indicator provides just tiny perspective, undermining broad implication of the concept.
Before I begin diving into processing geometric narrative of emerging price via fibonacci channels, I want to explain how I interpret fractals.
When I use the term "fractal", I'm not just talking about the points alone. Market continuously corrects itself, so analyzing it by price alone can bring more confusion than help. The object of observation shouldn't be limited to quantifying just by a single property. Chaos by default requires awareness from both price and time aspects. The easiest way to root it in my vision was through realization that price is a function of trading time intervals. Its activity can be described as cyclical progression, as if it is wired by multiple "springs" of different tensions.
Classic TA patterns known to literally anyone are great for anticipating a move in surface level forecasts. Since my line of work focuses on prediction over forecasts, it requires deeper structural awareness behind complex oscillations.
Let's observe the way selloff scales from ATH and how it impacts fractal hierarchy.
The first corrective bullish wave can be explained as a reaction to initial impulsive bearish wave. The bigger scale drop from ATH to a lower point explains why the corrective bullish wave looks the way it is. And so on:
In fractals, scaling laws describe how key properties change with size, typically following power-law relationships that reflect the structure’s self-similarity, where a characteristic scales with the size raised to an exponent.
To build a probabilistic model, we must keep in mind how the smaller bits make up bigger scale picture. ATH, established bottom and angle of progression defined by pullback highs, all those points have structural weight. Since psychology of masses that shapes price dynamics is governed by mathematical sequences found in nature, it's fair to use Fibonacci Channels to map the geometry of interconnectedness.
Similarly, all of those points can be referred by another fibonacci channel with opposite direction.
From my perspective, traditional TA patterns reflect just phases of cycle, this is why I unify those fragments into broader scalable shapes. This distinctive branch of Fractal Analysis allows to track systematic aspects of market behavior and explains how a pattern replicates itself in rhythmic continuity.

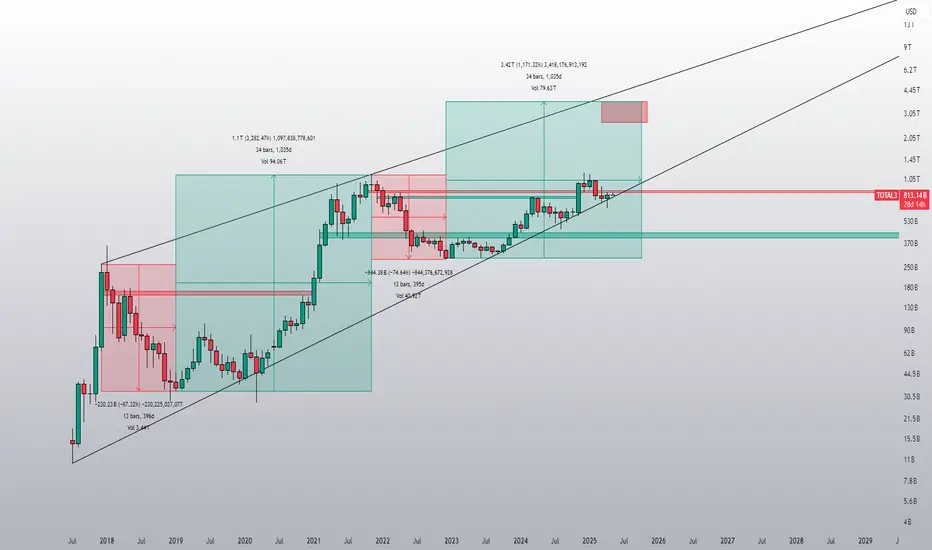
Are small caps about to bounce?TOTAL3 looks poised for a major upturn. Don't give up on Altcoin Season! No financial advice!
Bearish forecast for DXYWith regards my previous forecast, we have a strong reaction from Weekly and daily premium arrays.
On the weekly TF, we have IOFED of the SIBI and BSL above previous 2 weeks' highs was taken.
Tf: time frame
IOFED: Institutional Order Flow Express Entry Drill
SIBI: Sellside Imbalance, Buyside Inefficiency.
BSL: Buy side liquidity
