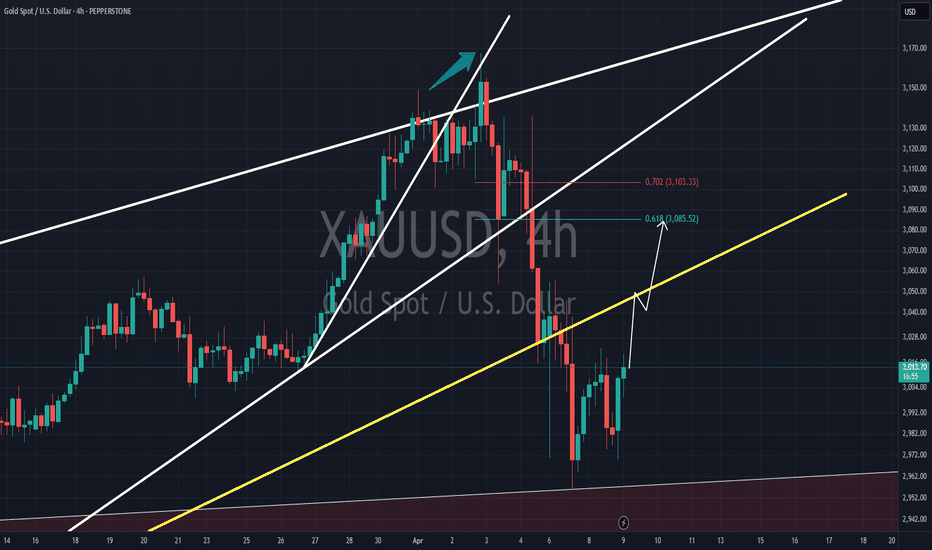
Gold touches all-time high. Overbought or poised for more upsideGold ( OANDA:XAUUSD ) has soared to a new all-time high, marking the launch of its next bullish phase. This powerful uptrend began on September 26, 2022, and is unfolding as a five-wave Elliott Wave pattern, a technical framework traders use to predict market movements. The first wave (I) climbed to 2081.82, showing strong momentum. Then, a corrective wave (II) pulled back to 1810.58, setting the stage for more gains. The third wave (III) was the most explosive, rocketing to 3167.74, driven by global demand for the safe-haven metal. Wave IV followed, forming a zigzag pattern—a typical correction where prices dip before resuming the trend. This correction found its low at 2954.62 after a structured decline.
Now, gold is advancing in wave V, the final leg of this impulse. The first sub-wave, wave (1), hit 3132.59, with smaller waves within it showing steady progress. A brief wave (2) dip ended at 3103.17, and now wave (3) is pushing prices higher. As long as the key support at 2954.6 holds, pullbacks should attract buyers, particularly in 3, 7, or 11 swings—technical levels where dips often reverse. This suggests more upside ahead for gold, appealing to both traders and investors watching this historic rally.
Economic Cycles
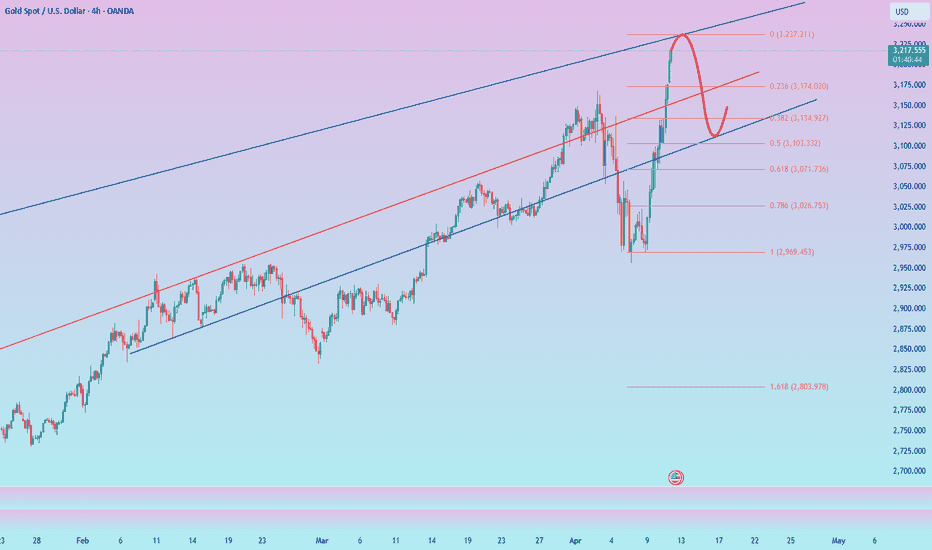
After the gold frenzy, there will soon be a sharp correctionTo be honest, I must admit that I still hold a short position. I think there should be many people holding short positions now, but they are unwilling to admit that they hold short positions because they are losing money.
I think it is not shameful to hold a short position now. Although gold has violently risen to around 3220, from the perspective of trading volume, gold is rising without volume. Without the support of trading volume, gold is destined to usher in a round of correction in the short term.
And I have reason to believe that the accelerated rise of gold is suspected of being manipulated by large institutional funds. There are two purposes. One is to accelerate the rise to attract more retail funds to flow into the market to take over; the other is to raise prices arbitrarily to make it easier to sell. So the faster gold rises, the easier it is to collapse! We first aim at the retracement target: 3150-3130 area,or even 3120.
So for short-term trading, I think we can still continue to short gold, and I am optimistic about the short position of gold! The trading strategy verification accuracy rate is more than 90%; one step ahead, exclusive access to trading strategies and real-time trading settings
ETH | Ethereum Hits 2 YEAR LOW - What's Next?Could it be that ETH bottoms out here?
Low from March 2023:
Interestingly enough, it could be said that it was the previous cycle's accumulation zone. Considering the previous cycle's price action, this isn't a ad zone to load up - for the longer term.
From here, although the price bounced high, and low, it was the 8-month price action before the next bullish cycle started. This gives us perspective in terms of time
___________________
BINANCE:ETHUSDT
PEG @ 0.22 DEBT/ASSET @ 0.09 NVIDIA LOOKS CHEAP WITH SELL-OFFFundamental metrics favour NVIDIA and with the company's return on equity (ROE) stands above 119%, NVDA stock price looks irresistible below 105.
N.B!
- NVDA price might not follow the drawn lines . Actual price movements may likely differ from the forecast.
- Let emotions and sentiments work for you
- ALWAYS Use Proper Risk Management In Your Trades
#nvda
#nasdaq
#nyse
$NIO You're updated roadmap for $NIOcopy & paste from twitter & stocktwits:
We have to see how it develops, but expecting to see an expanded flat with a 5 wave impulse to complete this sideways correction that started April 15, 2024 before we make the final move down to complete the macro structure and unfortunately filling gaps below....cont
The TVC:HSI & NYSE:BABA appear like they will make new lows over the next 24 mo. paying closer attention when new lows are made on TVC:HSI and around 12k. I thought we found the bottom going into March/April last year but wrong as this developed into a corrective flat for NYSE:NIO
lastly the volume profile isn't capturing the correct data - if we view only $66.99 to the current low, there is a massive volume gap at the ~0.382 fib correcting wave W (the 5-3-5 structure) at $11.02 which is the highest tgt for this bounce & HSI finishing correction from 2007
SP500 may have already hit the low In the video I have shown an interesting relationship between past crashes on SP500 which shows we might have already hit the low are very close to it before we start next major rally.
Note: Even though the relationship I have shown holds true so far doesn't Guarantee it will in future as well as all patterns no matter how convincing get invalidated at some point.
Bitcoin Cycle Rhythm: Same Downtrend, New Quadrant.Cycle Comparison – From Halving to Halving
We're seeing a striking similarity between the current downtrend and the one that followed the 2020 halving. The slope, structure, and emotional impact on price are almost identical. However — here's the key difference:
It's all about Quadrant Timing.
In the previous cycle, the sell-off happened during Quadrant 2 — traditionally the euphoric blow-off and start of distribution.
In this cycle, we’re seeing the same type of correction in late Quadrant 1, a phase typically associated with accumulation and early markup.
Before this correction began, Bitcoin rallied 120% from turning point 10 to turning point 1 — a textbook markup leg that aligns with early-cycle behavior.
Now, we've seen a retracement of approximately 32% from turning point 1 to 2, closely mirroring the structure seen in the prior cycle.
This suggests that while the pattern is repeating, the context has shifted — this drawdown could be a shakeout, not a cycle top.
If the 4-quadrant structure continues to play out, Quadrant 2 may still lie ahead, potentially setting the stage for a much stronger upside continuation.
Let me know what you think — is this setup still bullish in structure, or are we seeing the beginning of a deeper phase?
$SPX Flirting With a Bear Market alongside $QQQ NASDAQ fell another 4% touching down 26%
S&P 500 walking a tight rope falling 21% to play with the idea of a Bear Market, but has rebounded a bit.
NASDAQ:QQQ did have a stronger response from buyers than SP:SPX
Nonetheless, we would need several WEEKLY closes sub 20% losses to enter a textbook Bear Market.
Critical zone for Bitcoin – Pump or Dump!(Mid-term Analysis)Today, I want to analyze Bitcoin ( BINANCE:BTCUSDT ) on a weekly time frame so that you can take a mid-term view of BTC. On November 12, 2024 , I shared with you another weekly analysis in which we found the All-Time High(ATH) zone well.
Please stay with me.
Bitcoin has been on an upward trend for the past 27 months , increasing by about +600% . Have you been able to profit from this upward trend in Bitcoin?
During these 27 months , Bitcoin has had two significant corrections , the first correction -20% and the second correction -33% (interestingly, both corrections lasted about 5 months ).
Another thing we can understand from the two main corrections is that the second correction is bigger than the first correction , and since Bitcoin is currently in the third correction , we can expect the third correction to be either equal to the second correction or greater than the second correction . Of course, this is just an analysis that should be placed alongside the analyses below .
It seems that the start of Bitcoin's correction can be confirmed with the help of the Adam & Adam Double Top Pattern(AADT) . Bitcoin also created a fake breakout above the Resistance lines .
Educational tip : The Adam & Adam Double Top (AADT) is a bearish reversal pattern characterized by two sharp, ^-shaped peaks at nearly the same price level. It indicates strong resistance and a potential trend reversal once the price breaks below the neckline between the peaks.
Bitcoin appears to be completing a pullback to the broken neckline .
According to Elliott's Wave theory , Bitcoin seems to have completed its 5 impulse waves , and we should wait for corrective waves . It is a bit early to determine the structure of the corrective waves , but I think it will have a Zigzag Correction . The structure of the corrective waves depends on the news and events of the coming weeks and months.
I think the Potential Reversal Zone(PRZ) will be a very sensitive zone for Bitcoin.
I expect Bitcoin to start correcting again when it approaches $87,000 or $90,000 at most, and fills the CME Gap($86,400_$85,595) , and at least approaches the Heavy Support zone($73,800_$59,000) AFTER breaking the uptrend line .
In your opinion, has Bitcoin finished its correction or created an opportunity for us to escape again?
Note: If Bitcoin goes above $90,500, we should expect further increases and even make a new All-Time High(ATH).
Please respect each other's ideas and express them politely if you agree or disagree.
Bitcoin Analyze (BTCUSDT), Weekly time frame.
Be sure to follow the updated ideas.
Do not forget to put a Stop loss for your positions (For every position you want to open).
Please follow your strategy and updates; this is just my Idea, and I will gladly see your ideas in this post.
Please do not forget the ✅' like '✅ button 🙏😊 & Share it with your friends; thanks, and Trade safe.
CROUSD _SPOT ONLY !!!just forecast call SPOT ONLY.
DISCLAIMER:
what I share here is just personal research, all based on my hobby and love of speculation intelligence.
The data I share does not come from financial advice.
Use controlled risk, not an invitation to buy and sell certain assets, because it all comes back to each individual.
[ TimeLine ] Gold 31 March - 1 April 2025Hello everyone,
Today is Thursday, March 27, 2025.
I will be using the high and low price levels formed on the following dates as entry points for my trades:
March 31, 2025 (Monday), or
March 31 & April 1, 2025 (Monday & Tuesday)
Trading Plan:
✅ Wait for the price range from these candles to form (indicated by the green lines).
✅ Trade entry will be triggered if the price breaks out of this range, with a 60-pip buffer.
✅ If the price moves against the initial position and hits the stop loss (SL), we will cut/switch the trade and double the position size to recover losses.
📉📈 Below is the chart with the estimated Hi-Lo range of March 31 & April 1, 2025.
You can copy the unique code and add it to the TradingView URL.
🔗 TV/x/IaLLLLcp/


