Squawk! Bitcoin Longer, Larger, and Exponentially Growing Cycle!Squawk! Bitcoin Longer, Larger, and Exponentially Growing Cycle!
Bitcoins market cycle is expanding, lasting longer than most anticipate! As price channels widen over time, the scale of each move grows exponentially, extending both the peaks and the troughs! It’s Squawktasticly bigger!
Economic Cycles

The Fed Cuts Balance Sheet Runoff by 80% - BULLISH!RISK-ON 🚨
I’m seeing so many people incorrectly analyzing the September 2019 emergency repo OMOs, which were short-term liquidity injections from the Fed, and then comparing it to the price of BTC going down, before QE officially started in March 2020 because of the pandemic.
Here’s what really happened.
September 15, 2019 was a tax deadline, pulling ~$100B out of markets as large corporations paid the IRS and funds flew into the TGA.
Meanwhile, the Treasury issued new T-Bills to rebuild cash reserves following the post-debt ceiling resolution in August, draining another $50-100B as big banks and institutions absorbed the securities.
During this time, the Fed continued reducing its balance sheet (QT) down to $3.76T, but the balance sheet did not leave enough slack for unexpected cash drains to the system, such as corporate taxes and Treasury issuance.
Unfortunately, the Fed was flying blind and did not have a hard number estimate for “ample reserves” in the banking system.
These reserves were largely hoarded by a few of the larger banking institutions due to Liquidity Coverage Ratio (LCR) rules and a higher IOER at 2.1% vs the ON RRP rate of 1.7% - a 40 bp spread.
This caused a liquidity crisis in the US repo market because bank reserves held at the Fed ($1.36T) were too low and repo lending dried up. Banks weren’t able to access each other’s reserves to fund daily operations.
SOUND FAMILIAR !?
The US just resolved its CR to avoid a government shutdown, and they will be refilling the TGA by issuing new T-Bills. The reverse repo facility is also nearly drained.
Today, we heard the Fed will be reducing its securities runoff from $25B - SEED_TVCODER77_ETHBTCDATA:5B on April 1st, an 80% adjustment.
One of the main drivers is they wanted to get ahead of another 2019-style repo crisis (although they won’t say this), rather than being reactive and having to perform emergency OMOs once again.
Now to go back to my original point with people saying the Fed reducing its balance sheet runoff is a big nothingburger based on BTC price action in 2019.
BTC dumped because of the repo crisis, NOT because markets needed QE.
By early 2020, the liquidity crisis was resolved, and BTC pumped ~45% before the pandemic hit in March and nuked the chart.
Proof is in the pudding - just look at the 2017 bull market.
QT started in October 2017, and the market ripped until early 2018.
The Fed reducing its balance sheet runoff by 80% is definitely a signal of risk-on for educated market participants, as it leaves more reserves in the financial system, which gives banks more liquidity to loan the market.
i.e. M2 go up.
But keep listening to your favorite large accounts who are all of a sudden macro gurus, what do I know 🤓

WILL AUDUSD STRUCTURE LEADS TO A LONG TRADE?With AUDUSD making HH and HL with this bullish trend results into a long trade for the pair?
N.B!
- AUDUSD price might not follow the drawn lines . Actual price movements may likely differ from the forecast.
- Let emotions and sentiments work for you
- ALWAYS Use Proper Risk Management In Your Trades
#audusd

The Bitcoin Google trends wedge pattern. Good day traders & investors,
Is the Google trends search for Bitcoin about to explode ?! The chart pattern is a bullish one. The Google trend search topped out back in 2017 and has been in a wedge pattern since then. The search/interest recently broke out of this 8 year wedge pattern and this month retested the breakout. This is typically a bullish pattern and shows the interest and search volume is picking up and could very soon explode again.
The settings for this search was world wide , bitcoin and a custom time interval set from Jan 1st 2009 to Mar 19th 2025
Since inception the interest for Bitcoin gained volume/growth until it peaked in 2017. Ever since then the interest and searches has been making lower lower highs until very recently (last Oct) where it made a higher high as it broke out of this wedge. Also, since 2017 while making lower highs the google trend has been making higher lows, thus forming this wedge pattern. The break out and retest of this pattern is what shows the signs of strength and a possible explosion of interest in the near future.
I have underlaid both timelines of the price and the Google trend to match, and we can clearly see that when the search trend rises, so does the price which shows a strong correlation.
All of my other cycle analysis shows that May/June time could see higher prices, so you could say this is a sneak peak or confluence to other indicators.
Let me know what you think in the comments below what you think. Does Google trend holds any weight? Do you think this wedge pattern and break out could lead to anything big?
Please like and share. My socials are listed in the bio
Kind regards,
WeAreSatoshi

AMD: Fibonacci Framework (Fractal Analysis RECAP)In this idea, I’d like to share a quick recap about my unconventional approach to understanding the chaos of the market.
Price movements don’t just mirror fundamentals, they also reshape them in continuity. Relating recent fluctuations to historic swings is crucial, because markets operate within a structured, evolving framework where past price proportions subtly wire the future. The interplay between bulls and bears doesn’t unfold randomly — it reflects recurring behavioral cycles encoded in historical patterns. Each swing carries the imprint of collective psychology, liquidity dynamics, and structural forces, which tend to repeat in varying scales. In Fractal Analysis, I recognize 2 key aspects of price dynamics: magnitude (price) and frequency of reversals (time).
For example, capturing the direction of past bullish wave can be used to define boundaries of future bearish waves. In logarithmic scale, the movements exhibit relatively more consistent angle (as percentage-based distance factors in natural growth).
To build structural framework, we need another 2 chart-based frames of reference because having multiple Fibonacci channels layered across cycle creates a collective framework of confluence zones, where price reactions become more meaningful. When several channels align or cluster around the same price levels, those zones gain credibility as potential support/resistance, because independent measurements are pointing to the same structural levels. This is why by analyzing price within a broader historical context, we gain perspective on where current price action fits within the larger market narrative.

The Elliott WaveThe chart above shows the 5 waves which has been travelled by nifty
As per the Elliott wave pattern the coming waves will be a major correction waves with 'ABCDE' pattern most probably, of which wave 'A' has been made by nifty.
NSE:NIFTY

Eur/UsdUtilizing the M30 FVG alongside +OB as our defense area for support and resistance proved to be a strategic move. Running Asia set the perfect stage to effectively target those buy stops.

HBAR AnalysisSummary:
HBAR (Hedera Hashgraph) is the native cryptocurrency of the Hedera network, utilizing Hashgraph technology instead of a traditional blockchain. It is known for its high speed, low transaction fees, strong security, and energy efficiency. HBAR is widely used for smart contracts, fast payments, and enterprise-level decentralized applications (dApps).
Technical Analysis:
HBAR has shown strong resistance during recent market downturns and is currently in a consolidation phase. It has formed a well-structured setup suitable for both long and short trades.
The price is currently forming a Descending Triangle, maintaining a flat support level while making lower highs.
• After breaking the trigger level, it could move up toward the triangle’s resistance.
• There is a possibility of a trading range forming, but if the price confirms a breakout above the triangle, a bullish move may begin.
• If the price loses support and breaks downward, we could see a continuation of the bearish wave.
This setup provides clear trading opportunities depending on the direction of the breakout.

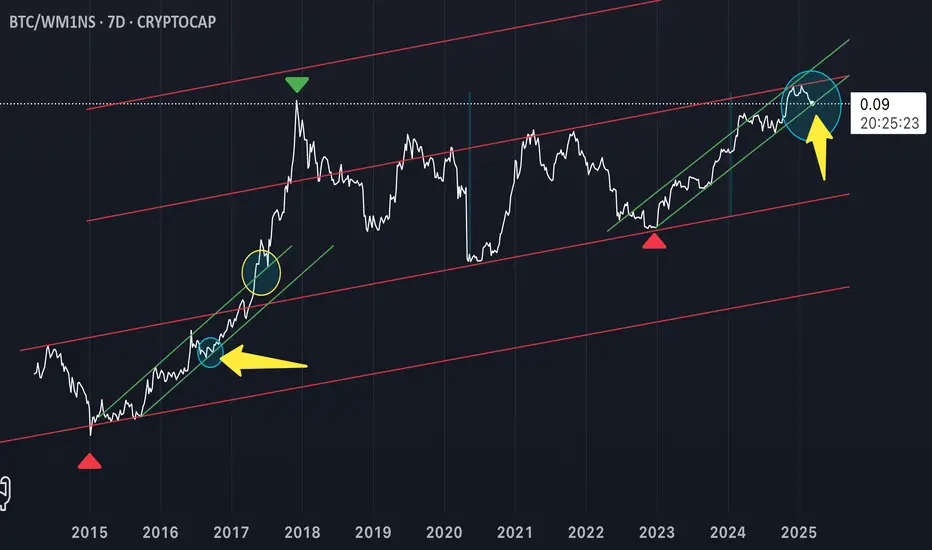
Where is Bitcoin?Squawk! Currently Bitcoin is at the 2nd yellow arrow! Compare to the first arrow for the roadmap my Squawky friends!
Eur/UsdI was hoping for a deeper move below Asia into H1 +OV to target the previous week's high as buy stops.
Missed opportunity, move on to the next day!

Short Idea on EURNZDBased On
- Williams POIV Divergence on 4H
- Interest rate and real rate differential increased
- Cycle analysis and quantitative data
- Overvalued Conditions

COOKIE’s Sweet Potential: Bullish Continuation Ahead?COOKIE 🍪 has shown strong momentum, and if the bull run isn’t over, we could see another leg up. Price action is forming a structure that suggests further upside potential, with key resistance levels in sight. If volume supports the move, a breakout could lead to new highs. 📈
Watching for confirmation signals—higher lows, strong demand zones, and bullish indicators lining up. A healthy pullback could offer prime entries before the next push. Stay cautious, but don’t ignore the signs of continuation.
I’m bullish on $COOKIE. What’s your take? Let’s discuss potential targets and invalidation points! 🍪

Long BTC, Long MSTR, Neutral to XAUExpecting BTC to consolidate relative to Gold for a few more days and then breaking out and outperform Gold. The ratios make it a more attractive trade with more upside potenial. Im buying NASDAQ:MSTR because of it´s leveraged bet in Bitcoin. I believe Microstrategy will outperform BTC in this scenario breaking out to new all time highs.
CME:BTC1!
COINBASE:BTCUSD
BINANCE:BTCUSD
BITSTAMP:BTCUSD
FX_IDC:XAUUSD
OANDA:XAUUSD
NASDAQ:MSTR

Q4 effects on BitcoinTIME BASED LONG TERM BITCOIN SPECULATION
First of all,
This analysis is not about to tell you that the bottom is in or not, this is a fun theory which has no confirmation for the future.
As i see every time Bitcoin enters the November zone, it starts to make a bigger move.
In this analytics maybe not the november month is what matters, it can be analysed by quarters or yearly periods too, but i chose the november zone.
2014 november: (A)
-top of the bull market
2015 (little bit after) november: (B)
-bottom of the bear market
2016 november: (C)
-breakout and retest to the fibonacci zones then rally
2017 (little bit after) november: (A)
-Top of the bull market
2018 (little bit after) november: (B)
-bottom of the bear market
2019 november: (C)
-breakout and retest to the fibonacci zones then rally
2021 november: (A)
-Top of the bull market
2022 november: (B)
-Bottom of the bull market?
We can also identify a gap between C and A period because the rally doesn't end in the next november cycle.
This analytics does not say that the bottom is in, but it can be already in or days/weeks away from the current price.
The structure has to be analysed by self, and this chart could give us a clue where should we see the price a year after.
The price should be in the 30k region to see a retest or a breakout from the zone.
in 2024 we should see 30k usd / BTC, but we don't know that if we will have a rally before it.
Hope i gave you something interesting.
Thanks for reading and have a nice trading carrier:)
(Always bullish on BTC)

Bitcoin Green Channel Are Telling!Waiting for Bitcoin to meaningfully breakout up through this 2nd green channel and confirm, followed by a steeper angle of attack move up! BTC/ WM1NS 7 Day Chart.
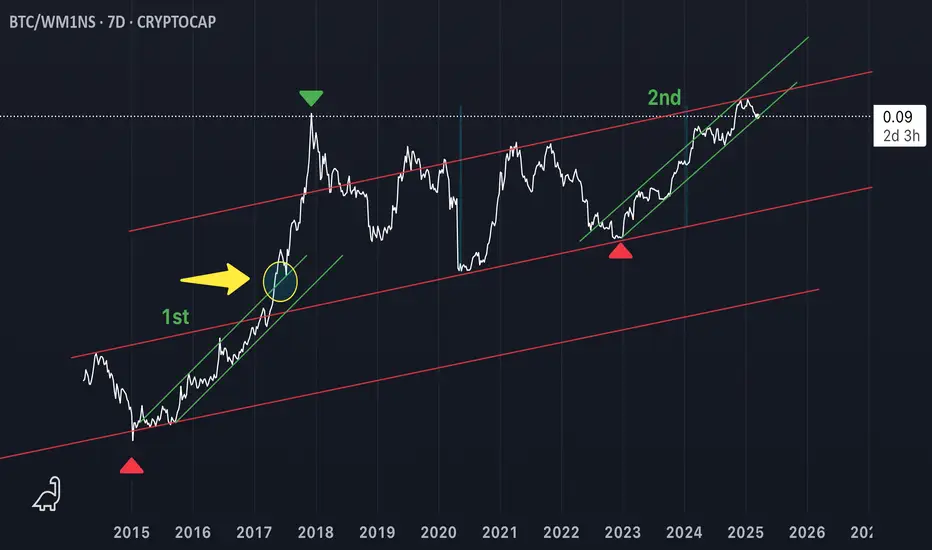
Bitcoin green channels are telling!Waiting for Bitcoin to breakout from the 2nd green channel and confirm meaningfully off of this channel top, higher at a steeper angle of attack! BTC/WM1NS 7 Day Chart

XAU to..... 3k++ ?Upgrades upgrades upgrades. Welcome to fake forex forecast analysis.
I see a huge LQ pool for a DOL to spool her price higher.
With Potus and his tariffs, who knows what may happen.

WIF/USDTHello friends
According to the market cycle, the price decline is ongoing and is expected to continue.
Now the only important support is the green area, which the price reaches there and we will see what reaction we get from the buyers.
Will they support the price or will the decline continue...
If you want to be with us in this alt season, send us a message.
*Trade safely with us*

AmazonAmazon should definitely reach 151.37 (even if it moves up again, it will start to move down again)

[ TimeLine ] Gold 6 March 2025Hello everyone,
I will be using the high and low price levels formed on the following dates as entry points for my trades:
March 6, 2025
We will wait for the price range from these candles to form as indicated with blue box. The trade entry will be triggered if the price breaks out of this range, with an additional buffer of 60 pips.
If the price moves against the initial position and hits the stop loss (SL), we will cut or switch the trade accordingly.

[ TimeLine ] Gold 27-28 February 2025Hello everyone,
I will be using the high and low price levels formed on the following dates as entry points for my trades:
February 27, 2025
and/or
February 27 + 28, 2025
We will wait for the price range from these candles to form as indicated with blue box. The trade entry will be triggered if the price breaks out of this range, with an additional buffer of 60 pips.
If the price moves against the initial position and hits the stop loss (SL), we will cut or switch the trade accordingly.

Integrating Modified ElementEarlier identified angle that maps growth cycle.
It has a strong frame of reference because:
Building blocks are arranged into their Fib orbit.
Direction of Cycle of Highs and Lows match
To validate the angle we can extend to the left to confirm prices respected that angle.
We can see it interconnects entire previous fractal cycle confirming angles credibility and therefore can be further utilized for building predictive modeling.
Relating
⬇︎
Applied

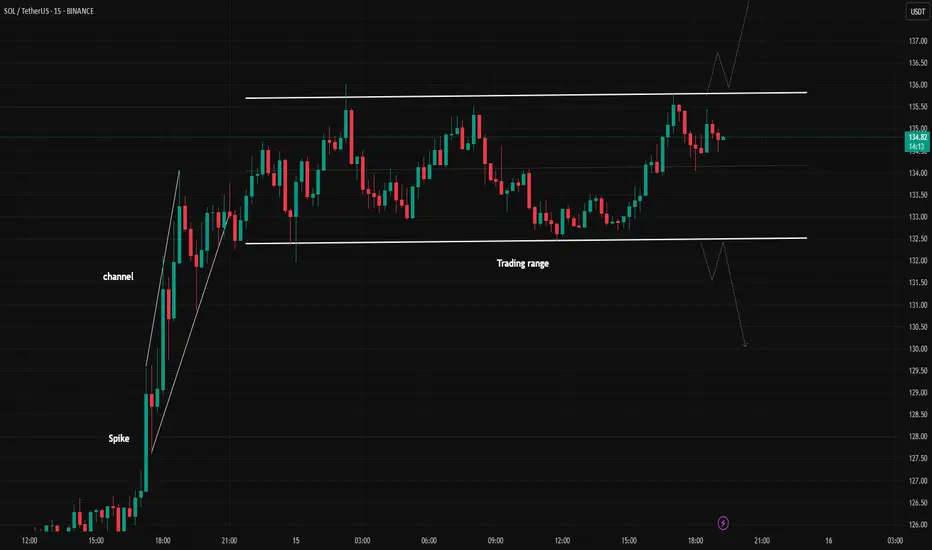
SOLUSDT Upward or downward?Hello,
In the 5-minute timeframe, you can sell at the top of the trading range and buy at the bottom of the trading range (by observing reversal candles and patterns).
Alternatively, you can wait for a breakout and enter in the direction of the breakout.
Be mindful of fake breakouts.
May your trades be profitable!