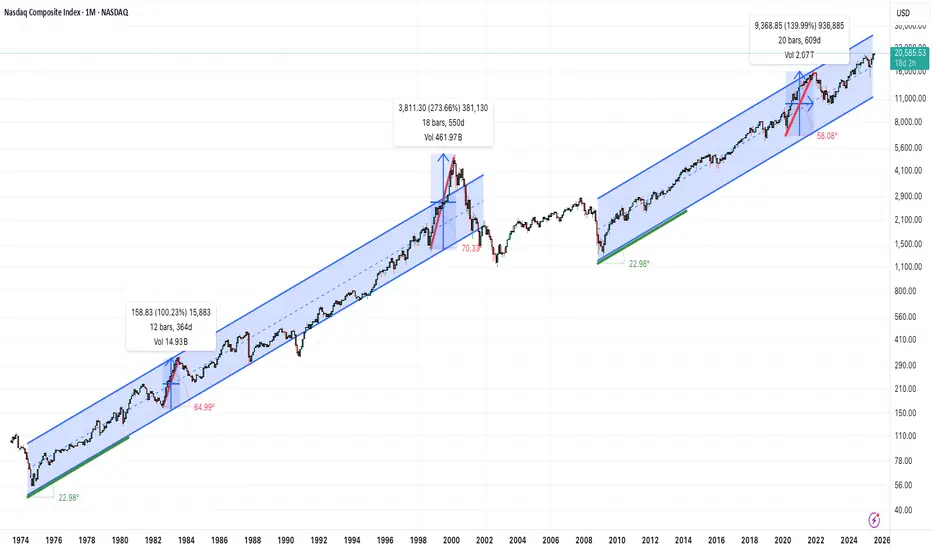
Is the Nasdaq in a bubble?On the monthly timeframe, there are no signs of an over-extended, parabolic condition for the Nasdaq Composite(IXIC).
It's interesting to note that for a 25 year period from 1974 to 1999 the overall trend was roughly a positive 23 degree angled climb. We see that again in the current 16 year trend that started in 2009.
Much steeper parabolic periods can be seen in shorter time frames like the 1998-2000 move, where the angle reached 70 degrees. That didn't end well. It's also worth noting that in 1982 and 2020 we saw similar behavior, though slightly less frothy. Both of those periods were also followed by significant retracements.
Maybe we are at the beginning of one of those multi-month, over-extended runs. But not seeing it today. If we are trading at 45,000 or more in 2026, that's a different story...
Economic Cycles
Microsoft from 2000 to 2017 - Ranging Moments - 13/07/2025A lot of patience is required by Investors.
Stakeholders' Trust and good faith are required in company products & services. Also Board of Directors and Company Management play a big role in growing the company.
An amazing point I can notice,
During this period, Steve Ballmer was from 2000 to 2014.
The CEO plays a crucial role in determining the company's hard pocket returns for investors or the highest risk for investors.
After Stever Ballmer left his position, Microsoft did 10X in stock price.
From approx $50 to $500 within the period of 8 years only.
So What made Microsoft in ranging price points for that period?
Innovation?
Bad Choices of Acquisition?
If you have any good points to connect, comment down on this post?
Happy trading.

Is SP500 / US M2 Money Supply telling us a story?Historically this ratio has inflected from key levels. Last week the upper boundary of what 8 would call a normal range has acted as support. If history rhymes to dot com bubble, this AI bubble can bounce from these levels and see an increase until Q4 2026, then a sharp fall will follow. To the lower boundary of that normal range.

Altseason 2025 - Wave 3Bitcoin is approaching its next destination between $125K and $250K, and that means its time to shift focus to altcoins. We’re not in full-blown altseason yet, but the foundations are forming. BTC dominance needs to drop fast, that’s the key trigger. Once it does, the rotation into alts could accelerate quickly.
Favorites so far this cycle:
🥑 POLONIEX:GUACUSDT 🧱 MEXC:YBRUSDT ⛏️ MEXC:KLSUSDT
🌐 HTX:SYNTUSDT 🧪 POLONIEX:DEAIUSDT *⃣ MEXC:SAIUSDT
🔗 POLONIEX:LLUSDT 🎮 KUCOIN:MYRIAUSDT 🤖 COINEX:ENQAIUSDT

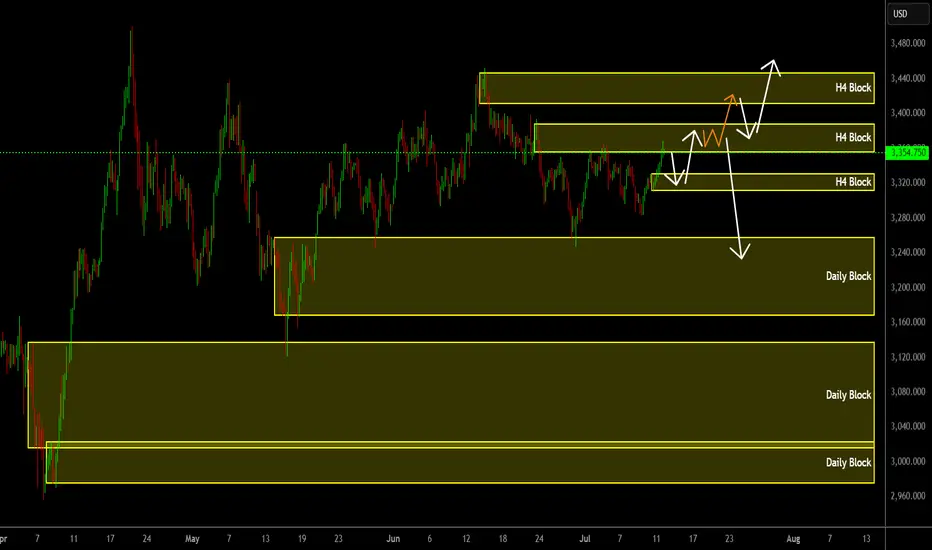
Gold Analysis H4/Daily🧠 Order Block-Based Market Structure Analysis
In this analysis, we leverage Smart Money Concepts (SMC), focusing on the interaction between order blocks and market structure on the H4 and Daily timeframes. This hybrid approach enables a high-probability forecast of price action within a strategic framework.
🟢 Market Structure Overview
The current structure is forming an ascending range with higher lows, suggesting bullish intent — but with no clear breakout above previous structural highs yet. The market is essentially building liquidity traps around premium zones, setting up for a potential expansion move.
🔶 Key Zones Identified
H4 Supply Blocks (Upper Resistance Areas)
Three H4-level order blocks are stacked above the current price, each representing potential points of liquidity absorption or reversal:
First Block: Minor resistance, likely to be breached.
Second Block: Main liquidity zone where sellers may become active.
Third Block: Final trap or target zone in case of aggressive bullish expansion.
Daily Demand Blocks (Deeper Support Areas)
Three major Daily order blocks are marked below. These are institutional accumulation zones and key areas for potential price reaction or reversal:
Zone 1: Short-term support
Zone 2: Mid-term support with stronger price memory
Zone 3: High-confluence zone likely to be defended if reached
📈 Scenario Projections
✅ Bullish Scenario (Primary Path - White Arrows)
Price may first revisit a minor H4 OB below.
If price breaks the local high, we expect movement toward the second and third H4 OBs.
A clean break of those zones confirms a bullish continuation structure.
⚠️ Bearish/Corrective Scenario (Alternative Path - Orange & White Arrows)
If price fails to break above the second H4 OB and shows signs of exhaustion or liquidity sweep:
We could see a sharp rejection.
Breakdown of support may lead to a drop toward the Daily OB at 3240, or even deeper levels near 3080 or 3000 if momentum strengthens.
🔍 Key Trading Insights
Wait for confirmation candles (impulse + volume spike) around order blocks before execution.
Monitor volume behavior at key zones — strong volume without movement can indicate absorption.
Daily blocks are ideal long entry zones if structure and reaction confirm institutional buying.
🎯 Conclusion
This dual scenario strategy based on H4 and Daily order blocks provides traders with a clear directional roadmap. The reaction to the middle H4 OB will be the turning point — either leading to a breakout rally or a breakdown into deeper institutional zones.
📌 Stay patient and let price reveal its intent around these engineered liquidity levels.
$VIX Volatility Extremes, Narratives, Booms & Busts!TVC:VIX volatility index extremes have always been an important factor when assessing the cyclical nature of financial markets.
I demonstrate in this chart what values and narratives to look out for at these extremes. This can help ignore the noise when buying during low social mood / fearful events when everyone else is panic selling, and, selling during exuberance and booms when everyone else is FOMO buying.
This is the cyclical nature and intertwined relationship between media, events and financial markets that traders and Investors want to take advantage of.
Good times create positive social mood, exasperating over leveraging and booms with extreme positive news / silly price targets 'New Golden Age / Paradigm shift' style reporting.
This unwinds aggressively creating negative social mood which the media exasperate with 'fear and doom' reporting.
VIX is a useful tool to hedge against market uncertainty.
Safe trading

$AAPL: Breaking Down Broader Cycle via FibsPublishing separately a specific interconnection type mentioned in idea below:
Testing this particular way of mapping the multi-scale cycles:

Altseason 2025 - Wave 3Bitcoin is approaching its next destination between $125K and $250K, and that means its time to shift focus to altcoins. We’re not in full-blown altseason yet, but the foundations are forming. BTC dominance needs to drop fast, that’s the key trigger. Once it does, the rotation into alts could accelerate quickly.
Favorites so far this cycle:
🥑 POLONIEX:GUACUSDT 🧱 MEXC:YBRUSDT ⛏️ MEXC:KLSUSDT
🌐 HTX:SYNTUSDT 🧪 MEXC:DEAIUSDT *⃣ MEXC:SAIUSDT
🔗 POLONIEX:LLUSDT 🎮 KUCOIN:MYRIAUSDT 🤖 COINEX:ENQAIUSDT

Altseason 2025 - Wave 3Bitcoin is approaching its next destination between $125K and $250K, and that means its time to shift focus to altcoins. We’re not in full-blown altseason yet, but the foundations are forming. BTC dominance needs to drop fast, that’s the key trigger. Once it does, the rotation into alts could accelerate quickly.
Favorites so far this cycle:
🥑 GUACUSDT 🧱 YBRUSDT ⛏️ KLSUSDT
🌐 SYNTUSDT 🧪 DEAIUSDT *⃣ SAIUSDT
🔗 LLUSDT 🎮 MYRIAUSDT 🤖 ENQAIUSDT

Altseason 2025 - Wave 3Bitcoin is approaching its next destination between $125K and $250K, and that means its time to shift focus to altcoins. We’re not in full-blown altseason yet, but the foundations are forming. BTC dominance needs to drop fast, that’s the key trigger. Once it does, the rotation into alts could accelerate quickly.
Favorites so far this cycle:
🥑 GUAC/USDT 🧱 YBR/USDT ⛏️ KLS/USDT
🌐 SYNT/USDT 🧪 DEAI/USDT *⃣ SAI/USDT
🔗 LL/USDT 🎮 MYRIA/USDT 🤖 ENQAI/USDT
