When is a stock too high to buy? (Example: IHG)How do you know when you’ve missed the boat?
A stock has already gone up a tonne, so bascally you are too late!
Sometimes, you just have to let go, right?
Sometimes yes, but not always - let’s look at an example.
International Hotels Group (IHG)
Back in 2020, LSE:IHG IHG shares were trading down at ~2000 GBX, now they are a hairs breadth from 10,000 - that’s 5X in about 4 years. Not bad.
Can you really even think about buying shares at 10,000 that were 2,000 only 4 years ago. 🤔
We’re saying YES.. if you follow some guidelines.
Clearly this is not a value investment - this is a momentum trade.
To be buying IHG shares up here, one is basically arguing that the price at new highs indicates and buyers are in charge and the price is going to keep going up for the time being.
This helps define the trade risk very well.
If the trade is that IHG has broken out over the previous peak at ~8,800. We don’t want to be owning shares below this level - if they’re back below 8,800 the momentum has stalled and we need to be out.
To put it another way, we are not buying just under 10,000 and willing to hold the shares all the way back down to 2,000 again - no. We want to ride the momentum up - not down !
From here there’s a pretty good chance that momentum takes the price up to the 10,000 level. As a big round number, there is also a good chance that profit taking takes place here too.
That creates our buy zone between 8,800 and the current market price (9,750).
So what might a trading strategy look like to capture this situation?
The following is a way to have:
An intial risk of £1000 to test the waters
A total risk £3000 if/when the trade starts working
A 2X profit potential (with the opportunity to capture more)
Spread Betting Strategy: Target £6000+ Profit with £1000 Initial Risk
Entry Points and Stops
9000 GBX Entry:
Stop Loss: 8600 GBX.
Bet Size: £2.50 per point.
Risk: £1000.
9200 GBX Entry:
Stop Loss: 8800 GBX.
Bet Size: £2.50 per point.
Risk: £1000.
9400 GBX Entry:
Stop Loss: Trailing 400 points.
Bet Size: £2.50 per point.
Initial Risk: £1000.
Profit Targets
First Position (9000):
Gain: 1000 points.
Profit: £2500.
Second Position (9200):
Gain: 800 points.
Profit: £2000.
Third Position (9400):
Trailing Stop Profit Example:
10,400 GBX: Profit = £2500.
11,000 GBX: Profit = £4000 or more.
Summary
Total Risk: £3000.
Fixed Profit (First Two Positions): £4500.
Potential Profit (Third Position): Variable, based on trailing stop.
Reward-to-Risk Ratio: 2:1 or higher, depending on trend continuation.
Economic Cycles

Litecoin | LTC | Long Position at $65Technically (believe it or not), Litecoin COINBASE:LTCUSD is in the early stages of an upward trend based on my selected simple moving averages. One could argue it's in a consolidation phase. The last time this happened was in the mid- to late-2020s before it soared. While history may not repeat, it is currently in a personal buy zone in the $60s.
Target #1 = $120
Target #2 = $195

Standard & Poor's: Time is running outIn this idea i will share you the details from an Italian traders that let me think about an important correction from a technical and cyclical point of view:
1) On the max side: We are going to close a 3+ month cycle that could be the final part of the maxi cycle (max side) started at the end of 2021 and now, approaching to a close. Now we are in the third time of the 3+month cycle and we can have just another long try in the zone of the purple trendline (as drown by the zig-zag line), but i don't expect an important raise of the price. Then we can see the test with the trendline and understand better. But surely, max after the first 10 days of december we can start the descendig phase. Yes Sir, no Chrimtas Rally this time.
2) On the min side: We are on the second 3+month cycle, currently counts 18 daily bars and thinkig that we did not found a close for the first half cycle for the first month, and for what we discussed above for the max side cycle close, I expect that the time is running out and we're gonna to find a minimum also because I rember you that we are in 3rd time of the cylce started in Nov 22: first time oct 22, ott 23, second time oct 23, ago 24, third time ago 24 - ???. Then, I remember you that also this cycle, is part of the mega-cycle started after the covid-pandemic in march 2020, and that in this march it turns 5 years. So, I expect that starting shortly, we are going to start a bug desending phase with min target correction 20-25% I expect that the first interesting target from the descending point of view will be in the area of 5,702.86, low of Nov. 4,.
3) Moreover, there is an important divergence between the price and the RSI, an additional sign to support the shift in the market paradigm that I expect.
If u find interesting my idea, please support me with a boost and feel free to ask questions in the comment.
Thanks in advance for the attention.
Hasta la vista!
Omar Lima

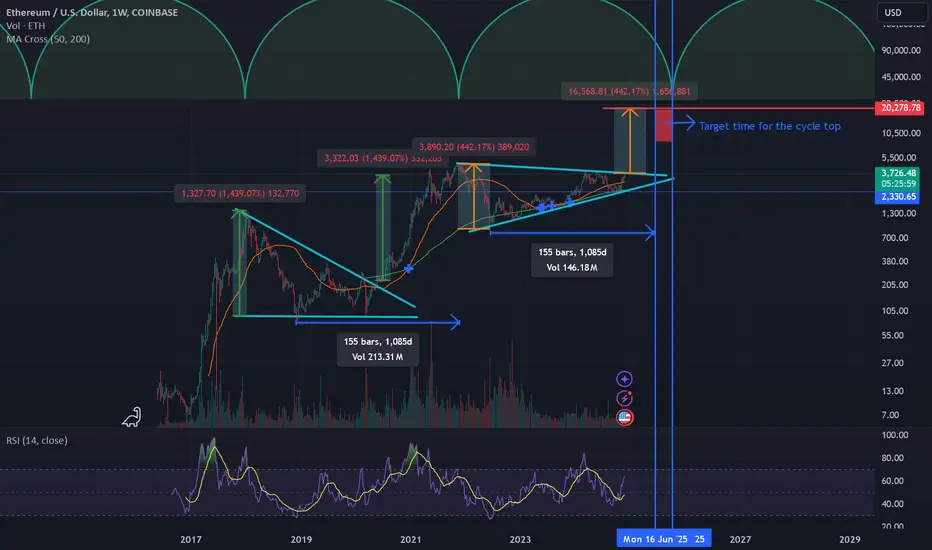
Ethereum potential move to 20,000Hi everyone,
Pattern: Ascending triangle is formed in weekly time frame for Ethereum (2022-2024). The triangle pattern was formed in the previous cycle (2018-2020).
Pattern breakout and target price: Once the price break out of the triangle pattern the target will be the triangle height, measured from break out point. This happened in the last cycle and the target price was reached. If happens in this cycle, we are looking at target price of 20K after the breakout.
Time analysis: If we are analyzing the time from cycle top to cycle top, we will be looking at end of Sep 2025 as the target time for the target price. If looking at cycle bottom to cycle bottom, the target will be mid June 2025. So, we can set our target time anywhere from June to Oct 2025 for this cycle top.
Let me know what you think! Cheers!
BTC Dominance is Cracking – Altcoin Season IncomingBTC dominance hit a brick wall at key resistance levels (58%-61%) and is starting to crumble. The rejection is loud and clear: the spotlight is shifting to altcoins.
Get ready for altcoins to take the stage. As dominance falls, expect explosive moves across the board. The charts are screaming one thing – altcoin season is here, and it’s about to get wild.
Which altcoin is your favorite?

UP OR DOWN
Cycles:
HWC:uptrend
MWC:uptrend
LWC: weak uptrend
So I am not talking about the shorts position because all the cycles are dry
Important points; 🤔
1.The number of hits weakens that level and shows its strength
Three hits to the top line and four to the bottom line
2.The volume is also decreasing, which I think we are naturally correcting
I don't see it as a weakness😉
You can enter depending on your strategy
If you want me to analyze a coin, tell me in the comment🫡
⚠️ Do capital management to survive ⚠️

Reality & FibonacciParallels between Schrödinger’s wave function and Fibonacci ratios in financial markets
Just as the electron finds its position within the interference pattern, price respects Fibonacci levels due to their harmonic relationship with the market's fractal geometry.
Interference Pattern ⚖️ Fibonacci Ratios
In the double-slit experiment, particles including photons behave like a wave of probability, passing through slits and landing at specific points within the interference pattern . These points represent zones of higher probability where the electron is most likely to end up.
Interference Pattern (Schrodinger's Wave Function)
Similarly, Fractal-based Fibonacci ratios act as "nodes" or key zones where price is more likely to react.
Here’s the remarkable connection: the peaks and troughs of the interference pattern align with Fibonacci ratios, such as 0.236, 0.382, 0.618, 0.786. These ratios emerge naturally from the mathematics of the wave function, dividing the interference pattern into predictable zones. The ratios act as nodes of resonance, marking areas where probabilities are highest or lowest—mirroring how Fibonacci levels act in financial markets.
Application
In markets, price action often behaves like a wave of probabilities, oscillating between levels of support and resistance. Just as an electron in the interference pattern is more likely to land at specific points, price reacts at Fibonacci levels due to their harmonic relationship with the broader market structure.
This connection is why tools like Fibonacci retracements work so effectively:
Fibonacci ratios predict price levels just as they predict the high-probability zones in the wave function.
Timing: Market cycles follow wave-like behavior, with Fibonacci ratios dividing these cycles into phase zones.
Indicators used in illustrations:
Exponential Grid
Fibonacci Time Periods
Have you noticed Fibonacci ratios acting as critical levels in your trading? Share your insights in the comments below!

Crypto Money Flow CycleHello,
The Crypto Money Flow Cycle is a flow model that discusses the route of investments from fiat to Bitcoin, from Bitcoin to altcoins, and backward into fiat, booking profit at every step. The model theorizes that most Bitcoins in circulation aren't mined but are bought for fiat. Before every bull run, investors don't necessarily buy mining equipment but purchase Bitcoins from their fiat money. As more and more money flows from fiat into Bitcoin, Bitcoin price rallies. At this phase, Bitcoin usually pumps more than most altcoins. At the end of the phase, investors buy altcoins from their Bitcoins.
They prioritize large caps like Ethereum. So, the price of large caps rallies compared to fiat and Bitcoin. Usually, these rallies outperform Bitcoin because the investors can afford to invest not only the initial fiat value but all the profits so far. That is Bitcoin's performance on fiat compounded by the large caps' performance compared to Bitcoin.
Over time, investors move the value from large caps to medium caps and from medium caps to small caps, pumping the markets in this order. Since the investment in medium caps is larger with the profit than the large caps, medium caps usually pump more, and similarly, small caps pump even more when money from medium caps flows into them.
To realize all the profit so far, investors can exchange small-cap altcoins back into Bitcoin, which means Bitcoin will pump once again. Then all the money so far, which is the initial fiat value compounded by the profit from each phase can return into fiat. Usually, this is when Bitcoin suffers correction and drags altcoins with itself.
That's how the Crypto Money Flow Cycle usually works. It's a model, which might or might not be true. However, I can say AI could trade the estimated phases with a success rate of over 71.23%, which means there might be more to this model than luck.
Regards,
Ely

XLM short term trade idea!Not financial advice! Not a professional! Just trying to learn? lol
Now I will try to get in around 0.42?
Ride it up to around 0.80 maybe 0.93+ lol
XLM smokes XRP! lol
XLM will eventually flip XRP!
Remember the economist magazine January 1988

BTC Harmonic Elliott Wave and Hurst Cyclic AnalysisFirst, let's analyze the wave structure for BTC. I am considering the entire bullish move from November 2022 to the present as a 5-wave impulsive move, and we are currently in wave (5). More specifically, we are in wave IV of A of (5).
Wave IV could develop as a flat correction, and considering a shallow retracement of wave III, a pullback to around 84,064 is possible.
When we look at the Hurst cycles, the trough from August 2024 marked a significant 80-week (80W) cycle low, which led to a strong bullish push. The first 20-week (20W) cycle trough of the current 80W cycle is expected in the third week of December 2024, which could align with wave IV in our wave analysis. The next major trough is the 40-week (40W) cycle low, expected in May 2025, which is currently labeled as wave B of (5).

UBL, Weekly Bullish Channel, Investor's Trade PlanPrice has touched weekly bullish channel
very prominent rejection candle seen
Similar pattern is also seen last year
correction expected
Accumulation opportunity for traders and investors
around 100 to 120 days cycle of accumulation box expected
major bullish activity expected around March
Buying recommended around 295-320 levels

ETH x5 | FIBONACCI | 3.618 = (15K) | FIB LEVELS Long Term TargetI made an update on the coming ATH on Ethereum, and unfortunately it posted on the BTC chart. I specifically discussed WHY I see that the ATH for Ethereum is not yet in, and what we need to see in order to know that will happen.
Today's update is more specifically on targets for the near and long term, based on the Fibonacci trend form the previous cycle.
_________________________
BINANCE:ETHUSDT


BTC's Accumulation Phase: Identifying Cycles and Support ZonesH ello,
BTC has been in accumulation since spring this year. The white dotted lines show the accumulation curves. There are multiple cycles, each with a pump and a dump arm. The cycles might be different in size, but they share the green bottom support zone where large investors prefer to buy.
Bitcoin has a bullish cross signal from the MACD indicator at the bottom. However, the current price is far above EMA 20/50/100/200. Thus, a dip might manifest to correct the price per the EMAs. There's a high probability that players will buy the dip, though and the bull run can continue.
I wouldn't buy now because of the potential dip and because the price's at the falling trendline resistance. I aim for long positions, but I'd wait for a correction first and closely monitor how the price reacts around the falling resistance.
Regards,
Ely

the midwit perspectiveThe +4std and the -2std iq crowd are currently shaking hands in agreement that the cycle is right translated and will top in Nov-Dec 2025.
These people are most probably correct, however...
Here's the +1std iq (midwit) take:
last top to bottom was left translated by over a year
117 months from Dec 2017 top to Mar 2020 bottom
52 months from Nov 2021 top to Nov 2022 bottom
last bottom to top was left translated by 35 weeks
122 months from Aug 2015 bottom to Dec 2017 top
87 months from the Mar 2020 bottom to the Nov 2021 cycle top
If we were to see the same type of left translation of 35-60 months after the Nov 2022 bottom, we would have seen the top already between Jul 2024 and Dec 2024 meaning either:
December 2024 could still be the December of dreams
or
$99.9k was the left translated top in Nov 2024 and we're about to enter the downtrend part of the cycle..
..OR..
it's right translated and is going to top next Nov.
p.s. just to validate my credentials here as a midwit, I meant to use the btcusd coinbase chart but accidentally used bitfinex and didn't want to redraw all the lines.
Happy Thanksgiving

Trade Recaps: GBPJPY-SHORT, EURUSD-SHORT, 28/11/2024GJ Bias Analysis: The bearish pro-trend was clear with price trading lower from a premium. After printing the weekly low and beginning to correct higher, price mitigated the 50% equilibrium during New York Killzone where I waited for further confirmation by way of a LTF TBL sweep before executing a short position.
EU Bias Analysis: The 4H had established a counter trend as price pulled back into the 1D OB and while short entries were not in line with the bullish range, IPDA was clear. Liquidity was being generated to the upside as price corrected and after a TBL sweep to the upside during New York killzone, a short entry was executed.
Grade:
- UJ: High Risk
- EU: Low Risk
