NZDUSD | MY PERSPECTIVE FOR THE WEEKThe NZD/USD pair is struggling to make a decisive move in either direction amid a lack of significant fundamental drivers in the latter part of the week. I am keeping a tab on a possible driver this week as we await Monetary Policy, RBNZD Rate and Interest rate decision on Wednesday for a possible headway. The NZD/USD pair closed the third straight day in the positive territory on Thursday but failed to preserve its bullish momentum on Friday which is a signal of a strong move coming in the following week(s).
With over 80pips in our direction (see link below for reference purpose) before experiencing a decline later in the week; insinuates a weakness of Buyers to push the price to complete Harmonic expectations (AB =CD) hereby making 0.66000level my Key level again for this week as I shall be looking at price reaction at this juncture in the market.
Tendency: Downtrend ( Bearish )
Structure: Channel | Trendline | Breakdown
Observation: i. A Breakdown (0.66375) and Re-test of Current Bullish Trendline (0.66900) on 4H gives a clue in the direction of a shift at the moment that drives towards a Bearish bias.
ii. I was expecting the price to make a Harmonic move (AB = CD) last week but unfortunately, it didn't as the 0.66900 level appears to be a level packed with Selling Pressure driving price further down.
iii. A significant Breakdown of my Key level in the following week(s) shall be a Bearish signal for me as I will be anticipating a hit of my Daily Trendline (seen on the chart) which also coincides with the nearest major Support @ 0.64000 (a psychological level).
iv. It is worthy to note that the economic news coming up mid-week shall be a significant driver in the direction of market participants in the following week(s).
Trading plan: SELL confirmation with a minimum potential profit of 250 pips.
Risk/Reward: 1:3
Potential Duration: 5 to 10 days
NB: This speculation can be considered to make decisions on lower timeframes.
Watch this space for updates as price action is been monitored.
NirvanaForex
Risk Disclaimer:
Margin trading in the foreign exchange market (including foreign exchange trading, CFDs, etc.) has a high risk and is not suitable for all investors. The content of this speculation (including all data) is organized and published by me for the sole purpose of education and assistance in making independent investment decisions. All information herein is for your reference only and I take no responsibility.
You are hereby advised to carefully consider your investment experience, financial situation, investment objective, risk tolerance level and consult your independent financial adviser as to the suitability of your situation prior to making any investment.
I do not guarantee its accuracy and is not liable for any loss or damage which may result directly or indirectly from such content or the receipt of any instruction or notification therewith.
Past performance is not necessarily indicative of future results.
Economicdata

SPX at the crossroad- Macro overview and economic indicatorsPlease click like and follow me if you like my post. Much appreciated!
SPX has been going on a W ride for a while and is currently only down around 15 percent from its mid Feb high, putting it in the midpoint of the correction and recession phase. If this trend continues on, it is safe to expect that SPX will more likely to challenge its mid Feb high than retest its March 23 low.
However, the current resistance lvl seems to have stalled its momentum somewhat as the weekly candle indicates an indecisive market sentiment.
It is worth to see if there is an accelerating net inflow into bond and equity fund and net outflow from liquid assets such as money market fund & saving deposits and total deposits at US commercial banks in the upcoming weeks. In order to sustain the rally, more investors need to to put their money back into the equity market.
Some encouraging news and signs are already happening-
*Stocks have vastly outperformed bonds by 11.92 percentage points during the last 20 trading days
*Call options far outnumbered put options
*VIX is steadily declining and briefly went below 40 few days ago.
*Remdesivir- Early result of severe clinical trial is encouraging. Few caveats- Still wait for the result of full clinical trial and more data from randomized controlled trial is needed. Also, the severe trial was conducted without the placebo group, meaning researchers don't not know what would have happened to these patients had they not been given the drug.
*Abbott recently announced new coronavirus antibody test that could do up to 20 million screenings in June. This antibody testing allows us to know if someone has been previously infected, if recovered from the infection provides the immunity and how long antibodies stay in the body.
*Exponential growth has slowed down a little bit the past few days, but the fatality rate is still climbing. Hospitalized # seems to have flattened the past few days even though the positive testing rate has gone up to nearly 20%. Overall, the growth rate has gone down to the average of single digit 7 % compared to the double digit growth rate few weeks ago. It is safe to assume that US is potentially transitioning from the stage of slowed down exponential growth to the stage of flattened curve.
On the other hands, all economic indicators and warning signs point to the rather bleak outlook-
*Vast majority of stocks is still below SMA200 and SMA50
*The number of stocks hitting 52-week lows exceeds that of hitting 52-week highs
*Retail sales tanked 8.7% in March, the largest decline since the government started tracking retail sales in 1992
*March CPI fell 0.4%, the largest monthly decline since Jan.2015
*Industrial production dropped 5.4% in March, largest drop since 1946
*The March PMI registered 49.1 percent, an 1 percentage drop from the February. The New Orders Index suffered a drastic decline of 7.6 percentage due to the export contraction, suggesting a weakening demand from customers.
*Initial claim is down from its peak while continuous claim continues to surge
*unemployment rate is projected to be as high as 20%
*Crude Oil declined 67.50% since the beginning of 2020
*The NAHB/Wells Fargo Housing Market Index (HMI) Builder confidence in the market for single-family homes plunged 42 points to 30 in April, the lowest point since June 2012
*Building permits in the United States fell 6.8 percent, the sharpest drop since July 2015
*Housing starts in the US plunged 22.3%, the biggest decline in housing starts since 1984
*Small business rescue loan program already hit the $349 billion limit
*Massive credit downgrade as corporate earning approaches and many corporate bonds fall to distress lvl
*Market-cap to GDP is still in the overvalued zone
In the midst of the Covid-19 crisis, central bank launched its latest program that allow foreign central banks to convert their Treasury securities into dollars in order to alleviate the USD shortage problem. This was a response to the ever-increasing liquidity crunch that is rarely seen in traditionally the most liquid market in the world. In recent days, treasury yields have not fallen like they usually do in the past during the event of massive sell-offs in equities. Other worrisome signs are the elimination of reserve requirement and the inclusion of previously excluded category of less-than-investment grade corporate bond to the Fed asset purchases. The result of these drastic measures is sure to ballon the Fed balance sheet, federal deficit and debt-GDP ratio in the near future, further compounding the U.S Debt dilemma.
Lastly, the potential danger of second wave infection in China cannot be overstated. The fragility of the global supply chain is already being exposed during the pandemic and the problem will be further exacerbated if the world's second largest economy fails to prevent the re-emergence of virus.
Overall, I am cautiously optimistic. There are many potential events and developments to pay attention to such as the serious supply chain bottleneck and essential worker shortage that could trigger the massive sell-off. Also, I am waiting to see how the market will react to the upcoming quarterly GDP, unemployment # and corporate earning.
Stay safe out there my friends!
Please do your own due diligence. Not the investment advice, just my personal take on the current situation.

Worse-than-expected economic data implies S&P 500 downturnRetail sales data, industrial production data, and capacity utilization data for March all came in quite a bit worse than analyst forecasts today. The Empire State manufacturing index for April also hit a record low, falling nearly 40 points more than expected.
Bankruptcies are also piling up this week at a much faster pace than last week. Publicly traded companies that declared bankruptcy include FTR , HOSS , and LKSD . Also at imminent bankruptcy risk are JCP , CLUB , and I . Lots of private companies have also gone into bankruptcy, including the XFL, True Religion, FoodFirst, Fairway, Pace Industries, Longview Power, and lots of small farmers in Wisconsin. The cities of Vancouver and El Cerrito are also on imminent bankruptcy watch.
These metrics suggest to me that the jobless claims numbers Thursday are going to be bad again. I also think the market is overly optimistic about the long-term economic outlook and the return to normalcy once the economy reopens. Zacks, for instance, is forecasting that most of the lost jobs will return once this is all over. I'm less optimistic that companies, having burned a ton of cash, will be able to rehire the people they laid off. Some jobs are also being automated as we speak.
Here's one example of the economic ripple effect the shutdown is going to have. Cities will lose 25-50% of their revenue this year, and they will somehow have to make up their budget shortfalls. Most of them will raise taxes, perhaps in the form of a temporary coronavirus tax. That will be a drag on economic recovery, which will take a lot longer as a result.
In terms of technicals, I expect at minimum a near-term test of the 20-day moving average, and possibly the ten-year trend line.

BTC- Volume, derivative, macro... Decoupling finally?For the first time since the corona virus started to ravaging the market in late Feb, BTC's price decouples from that of stock market.
Please click like or follow me if you like my post! Really appreciated it.
A lot of people think BTC failed its role as the recession-proof safe heaven. What they fail to understand is the true purpose of BTC, which is created to resist the unlawful seizure and confiscation, to avoid the loss of purchasing power typically associated with fiats due to their inflationary nature and to avoid the defunct that comes with the sovereign debt risk.
BTC never claimed and nor does it ever try to be the safe-heaven asset during the recession. In order to make that assertion, it needs to be the asset that has the low volatility because investors tend to hold the low-volatility assets during the time of uncertainty.
Few Macro list to go through
#1. Recession is overdue for the U.S economy and Coronavirus could just be that catalyst that pops the debt bubble. The recession talk is, perhaps, premature, but not unwarranted. All three major stock market indexs' SMA 50 are ready to cross below their SMA 200. On the bright side, SPX and DOW have bullish divergence on the daily timeframe while Nasdaq does not.
#2. If you believe the stock market will not fall below S&P's 2017 high, then we are near the bottom. IF you think we will go below 2017 high, then we still have the room to go even lower.
#3. Pay attention to this moth's unemployment related indicators, retail metrics, manufacturing-related indexes and housing-related signals. Reports about rising jobless claims along with the potential 20% unemployment figure, if proven true, could further dampen investor's confidence.
#4. Market will not fully recover from the coronovirus panic until the exponential growth slows down. Currently, U.S is approaching 10000 cases and the exponential growth does not seem to be slowing down even with the social distancing measure in place. Next week will be critical because spring break is just right around the corner...
#5. It was a little disconcerting to see 1.5 trillion stimulus package to have a very little to no impact on the market. However, you can count on president Trump to do everything he can do rescue the freefalling stock market. U.S senate just passed the coronavirus relief bill and a larger aid package is expected to follow. Moreover, ECB just announced the stimulus package as well. The effect of all these measures will be determined once we get the more definitive timeline.
#6. Did all the big players get out of their underwater positions in time or are they waiting to sell into the next rally before the market dips even further?
If BTC continues to move on its own, then we can ignore everything I said above! If not, the strength of the U.S economy will determine which kind of halving we will see.

Week Results: China, the euro and oil problemsThe past week has already habitually passed in the analysis of news around the coronavirus. The main result was the restoration of economic activity in China, which greatly reassured investors, and they returned to the usual occupation in recent years - the purchase of risky assets. As a result, US stocks updated historic highs.
At the same time, one cannot but note the opposite trends - gold was in stable demand, but oil was under pressure. This already indicates that investors are seriously worried about the consequences of the epidemic, which are primarily manifested in a sharp decrease in demand for energy assets (the International Energy Agency even predicted the first quarterly decline in oil market demand in 10 years).
Investor fears are much easier to understand than optimism in stock markets. Fears are something rational: it is not clear what real economic damage China and the world as a whole will be caused by the epidemic. Do not forget that the root of the problem may lie not even in the fact of a slowdown in economic activity, but in the ability of China to service its debts, which have already reached 300% of GDP. And the epidemic is still only growing: the number of deaths has approached 1700, and the number of infected has exceeded 50,000 (according to WHO).
But optimism is something from the field of irrational and emotional. Since we believe that, in the long run, proponents of a reasonable assessment of the markets will be right, we, therefore, continue to recommend sales on stock markets as well as purchases of safe-haven assets.
Speaking of sales in the US stock market. The Federal Reserve Bank of New York announced that they will reduce the volume of interventions in the repo market. That is, cash injections will decrease. Which is very likely to provoke a decrease in demand in the stock market.
In addition, this week we will look for opportunities for sales in the oil market. At least, if there is no news that Russia has decided to support Saudi Arabia and agrees to increase the volume of reduction in oil production. Well, or the epidemic will rapidly decline.
In addition, this week we will continue to look for points of sale for the euro. The single European currency after a series of weak economic data, including a failure in industrial production, and close to zero GDP growth Euro zone looks extremely vulnerable.
As for macroeconomic statistics this week, on the whole we are waiting for a relatively calm period. So, the markets will continue to follow the news from China and work out them first of all.

GBP/AUD Short DailyGBP/AUD Short Daily in ob levels cci and rsi in my os/ob setup
GBP will be bear at interest rate economic calendar release
AUD release will be bullish CPI QoQ and MoM

Real Estate sector in an up-channelEWRE has been in an upward channel vs. the S&P 500, and is currently near the bottom of the channel. That makes it an attractive buy today, especially after last week's extremely positive housing report that showed rents and property values rising and mortgage rates and inventory numbers falling.

The news is all bad for the economy, good for goldThe economic news this week is pretty much all bad, with payroll data, manufacturing data, and non-manufacturing data all showing a broad slowdown across the whole economy. The dollar is showing real weakness amidst the slowdown. Both the dollar's weakness and the return of fear to the economy should be good for gold.
Here are the critical levels to watch in the dollar. A break below the channel/trend line would signal an upward breakout for gold.

ORBEX: EURUSD, USDJPY, GBPUSD On The Move!In today's #marketinsights video recording I analyse EURUSD, USDJPY and GBPUSD
#Euro down on:
- Disappointing German Manufacturing PMI (actual 41.4 vs expected 44.1 vs previous 43.5)
- ECB could have made a mistake talking somewhat 'neutral'
- Draghi's speech hinted to high uncertainty, decision-making harder and harder
#Yen down on:
- Disappointing Japanese Manufacturing PMI (actual 48.9 vs expected 49.8 vs previous 49.3)
- Potential stimulus measures
- Potential US-Iran deal
#Dollar up on:
- Trade talk optimism
- Markit Manufacturing PMI (actual 51 vs expected 50.4 vs previous 50.3)
#Pound down on:
- Thomas cook sentiment
- Parliament prorogation sentiment
- Barnier's pessimistic comments
Stavros Tousios
Head of Investment Research
Orbex
This analysis is provided as general market commentary and does not constitute investment advice

Getting ready for a volatile day: pound and dollar have the bullLabor Day in the US and Canada led to a relatively calm day on the financial market. But today everything can change radically.
On the one hand, Hurricane Dorian threatens to become the most powerful in history. This means that the potential damage could also become the most significant. Yesterday we promised to show the way how to make money on this kind of natural force majeure.
Here are a couple of facts. Irma was the first Category 5 hurricane (like Dorian) provoked a sharp decrease in the number of new jobs created out of a farm sector in the United States (NFP indicator) in September 2017. With an average 200K number, its September figures were (the peak activity of Irma in the month of August) -33K (!). In 2018, hurricanes were less destructive, but the September NFPs came out below forecasts 30% (!)and much lower than the average.
Thus, if the hurricane turns out to be quite destructive, we can expect weak figures for the US labor market for September-October. Accordingly, it will be possible to prepare in advance for the failed data and make money on it.
But the consequences of Dorian are not clear yet and will manifest after some time, but in the UK everything can be much more dynamic. Today, the UK Parliament is returning from recess with the understanding that they have less than 10 days to stop Johnson, because on September 12 his activities will be suspended until mid-October (the UK will leave the EU on October 31).
That is, today all sorts of sensational news are possible to happen. There are a lot of development options of events, starting from the law prohibiting exit without a deal, ending with the resignation of the Government or early elections.Thus, the dynamics of the pound so far seems completely unpredictable - it will be entirely determined by the results of the parliamentarians activities.
Let's try to give an approximate plan for working with the pound, depending on certain results. We sell the pound if the Parliament can accept nothing, as this is likely to mean a "hard" Brexit. We buy the pound if a law is passed to ban the exit without a deal or if a vote of no confidence is put forward to the Government. We regard early elections as a neutral option with positive for the pound since it will at least delay the “hard” Brexit.
Also, today it is worth paying attention to the ISM index of business activity in the USA, Michel Lagarde speech, as well as the index of business activity in the UK.
Speaking of our other trading preferences for today, we note that we will continue to sell the euro, buy gold and the Japanese yen, sell oil and the Russian ruble.

Johnson's insidious plan, US GDP and dollar’s reactionBoris Johnson asks Queen to suspend parliament.
The decision will cut dramatically the time MPs will have to take action to prevent no-deal Brexit. he is going to ask the Queen to suspend parliament for five weeks from mid-September.
It seems like the Queen is ready to be in. And this means that the opposition will have time until September 12 to prevent the "no-deal" Brexit. The value of the pound has fallen by 1% following news that Prime Minister Boris Johnson is planning to suspend parliament
The signal is more than alarming. Chances of the "no-deal" Brexit have increased dramatically. And this means that you need to be careful. Now we consider such pound descents of 150 points as an opportunity for cheaper purchases. But with stops. Once again, we note that events are developing against the pound, for now.
Data on US GDP for the second quarter will be the main event. Experts expect a slight downward revision. The GDP growth rate is expected to remain at 2 %. Our expectations are more pessimistic. The fact is that the global economy as a whole and individual countries are increasingly showing signs of a slowdown. Very indicative is the data on German GDP, which, recall, showed a decrease in the second quarter. And most importantly, the decrease was due to the slow negative dynamics of exports. That is the direct evidence of the destructiveness of a trade war. There are reasons to expect further deterioration of the situation.
Thus, we will not be surprised if the data is reviewed for the worse, but not by 0.1%, but more for example 1.5%. That will shock markets and the dollar will inevitably suffer. Moreover, the dollar will be under double pressure: the reaction to weak economic data will be multiplied by the growth of confidence in the Fed rate cut in September. So today we will sell the dollar across almost the entire spectrum of the foreign exchange market.

Arrangements, collapse in Germany and data from the USAThe China-United States Trade War is an ongoing economic conflict between the world's two largest economies. Two countries cannot even agree if they are talking. According to Trump, he got a call from Chinese officials, however, China did not confirm that yet. Well, quite possible that there was no call. this means that we are in a situation where the parties are in the active phase of the confrontation. In the light, we will continue to look for points to buy for safe-haven assets (the Japanese yen in the foreign exchange market and gold in the commodity market).
Yesterday extremely weak data on the business climate in the largest economy of the Eurozone came out, today German GDP in the second quarter fell by 0.1%. Another quarter with a minus mark and the recession will be announced officially. Recall recession is a period of general economic decline, defined usually as a contraction in the GDP for six months (two consecutive quarters) or longer. An extremely alarming signal was the decline in German GDP mainly due to a sharp drop in the country's exports (it took 0.5% of GDP growth, actually leading it into the negative zone). This is an example of how the trade war could hurt.
This news confirmed our recommendation to avoid buying euros. Instead, we suggest selling the euro against the Japanese yen and the British pound. This trading idea this week works just great.
As for the dollar, not everything is that simple. Yesterday's data on orders for durable goods, consumer confidence and business activity in the US came out better than expected, which suggests that the US economy is getting better. But, our position on the dollar is unchanged - we are looking for points for its sales. First of all, against the pound and the Japanese yen. Also, on Thursday, revised data on US GDP for the second quarter will be published. Weak data may trigger a short dollar.

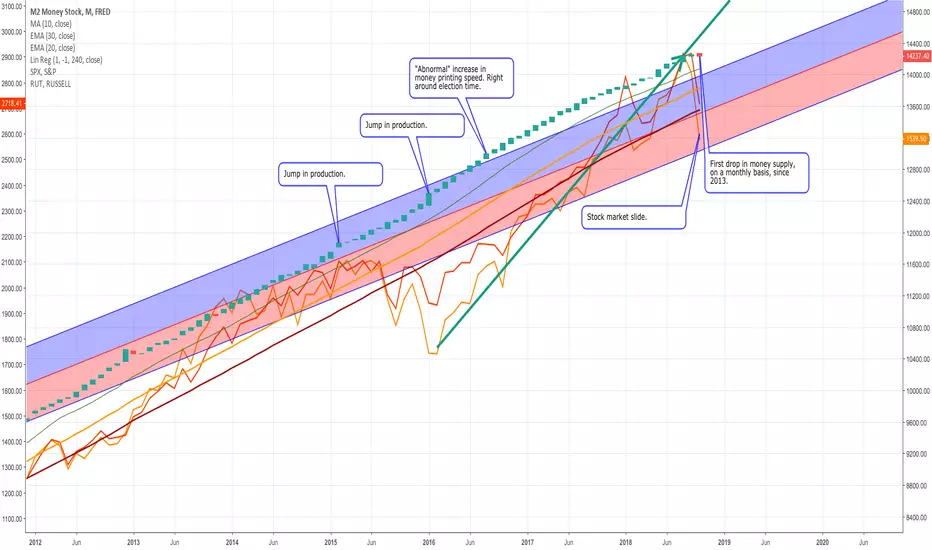
Printing Money, Interest Rates, and Equity MarketsI'm neither economist nor investment advisor, but the rise of cryptocurrency got me thinking about physical currency in America.
Most of us know the U.S. Treasury prints money. Here's a chart, roughly, of how much they've been printing:
There are several measures of money supply, but FRED:M2 is a fair picture of how much cash is out there. As you can see, it's a fairly consistent uptrend.
Most of the charts in this article will have three moving average lines, inspired by Dave Landry. As Dave writes, they aren't magic; they just give us some help visualizing trend. But if we add regression channels over the last 20 years...
...we see that the trend is almost straight-line. The channels are a best-fit straight line with lines drawn 2 standard deviations on either side, which, for normally distributed events should contain 95% of population. Look how narrow the channels are when compared to something a little less predictable, S&P 500 :
Just for kicks, let's tighten the channels to 1 standard deviation on each side, which should contain 68% of the bars:
The only time the money supply growth dips below the channels is May 2006 through Nov 2008 and Sep 2009 through July 2011. Just to jog our memories, I'll overlay the SP500 and the Russel 2000 .
Notice how, even though the money supply is always rising, when the pace of that supply drops a little bit, it precedes significant market drops, which "recover" when the pace of printing money returns to "normal."
Of course, this isn't they only way to look at market events in those periods. There were real fiscal crises that happened. There may be other causes. I'm only asking a question of myself,
"Is it possible that the extended bull markets we've seen are funded by the treasury's printing presses?"
And remember, we're not just talking about how fast those printing presses run; we're talking about how fast the Treasury adds printing presses, especially when we see the velocity of money production increase along with the recent bull market:
In 2014 the markets started to flatten out a bit. Feb 2014 saw a spike in money printing speed (notice the gapped bar.) A long bar show another spike in production Jan 2016, and a continued increase in speed through Sep 2018 when the stocks started sliding.
This month, October 2018, we see the first decrease in money supply since Jan 2013 (if you compare end-of-month to end-of-month).
Notice also the green, and drawn line marking the 2016 bull run.
I believe people can predict the markets. Anybody who tells you for sure the market will do a certain thing by a certain date is, IMHO, viewing you as a market. I sure can't time the markets; I just like thinking about charts and asking questions.
These charts leave me asking:
To what extent is market recovery and growth funded by the manufacture of currency?
Can that manufacture continue indefinitely?
Who decides to slow down that production, and why?
What does a drop in money supply mean? I assume it's the Federal Reserve "paying off" the Treasury Bonds it used to create the money, simultaneously lowering its debt and increasing the value of money.
Should this affect my market bias?
Should that affect my investing?
EURUSD at 20 day Exponential Moving Average support.The 20 day moving average is a strong point which plays big part in how the future trend is set and detected. Setting up for a trade, short term selling from under 1.23 to 1.2270 may play a good trade short term trade, below it is stronger support directly to the 1.2200/1.2190 trend line support where more buyers are emerging. Be careful and follow also everything connected with news and don't forget next week is NFP's week.
--------------------------------------------------------------------------------------------------------
Trading carries a high level of risk to your capital and may result in losses that exceed your initial deposit. Supplied information is not advice.

GBPAUD Forecast for the week Long Entry: break of 1.82865
SL: will be right under the breaking point
Short: Entry: 1.82865
SL: just above the resistance at price: 1.82865
Also a Bearish divergence, have formed. the price will go up a little before confirming the divergence
Look in the RSI and the orange line in the chart, divergence is marked with cirkels
Description:
An long entry can be taken, when a break of the rising wedge above the resistance/support line (1.82865)
A Short entry can be taken when the price hits the resistance/support line. This is risky, and therefore I will wait for the confirmation, when the price breaks the support line in the rising wedge.
Historically there is a 69% chance for a breakout of the support line in the rising wedge. This is because a rising wedge is formed after a longer decline in price, and therefor the rising wedge can be seen as a consolidation formation, before further downside.
Breakouts above the resistance line, is occurring 31% of the time historically. In a consolidating rising wedge.
Also there is coming more this week about brexit, and can perhaps give more information about the prices direction
Also there is a great deal of economic numbers with high importance coming out this week for Britain. That needs to be taken in considering.
www.fxpro.co.uk

The Big Short | Putting Economic Data to the TestHello Traders,
I have been fiddling with the idea of applying the same model used to predict Financial Markets to Economic Data.This is my first attempt at applying the model to such data publicly. Consider this post an experiment.
Taking into consideration some fundamentals (and a little bit of rationalizing); Since the auto industry bail outs of 2008-2009 interest rates have been at a record lows(0%). Car sales reacted accordingly making a full recovery into pre 2008 levels. Now that QE and 0% interest is over (interest rates are likely to rise in the next few years), there is a bit of stagnation in the car industry as a whole. Once attractive lease offers and 0% financing is off the table a decline in sales should occur. Overall, when interest rates are high people buy less as a whole.
Questionable Lending Practices: The use of Sub Prime loans in the auto industry and selling those loans as bonds has an all too familiar ring to it. Granted, it is not as rampant as it was in the mortgage industry, but the same practices of junk loans being sold as junk bonds is occurring. One does not need to be a prophet to know what the end result of that is. Take a look at this satirical piece by John Oliver for more detail: www.youtube.com
Self Driving Cars: It is imminent, self driving cars are the future and can reach the everyday consumer as soon as 2020.
www.nissanusa.com
Why is this important? The idea of self driving cars also brings up the idea of not having to own a car to get around in one. Cars being able to move around without a driver + (UBER + Car Manufacturer Collaboration) = Less consumers having to own cars to get around in one. www.wired.com
The Model: The most important aspect here is the model. Time and time again it has proven to predict and forecast financial markets with pin point precision. Here, the model points to 5.26 as the highest probability target.
So...what does this all mean? If the model is successful in predicting the outcome of auto sales, it means that there will be a massive decline in auto sales. It also means that there is a great recession looming over us like a dark cloud.
The ideas discussed in this thread are purely conversation topics that help "aid" the rationale behind the targets defined by the model. I do not consider myself an economist, nor do I think I have the full range of ideas listed in this thread. If you feel like you have a different outlook or if I missed something please feel free to discuss it in the comment section(with sources to back up your view).
Best,
Chartistry

EURUSD outlook for the next week, waiting for NFPThe next targets could be fibo50%, to 1,120, and the next test of the trendline at 1,129, close to the 0.618 fibo important to understand if this bullish sprint really hiding something more than just a swing upward in a movement facing down...
RSI+ MA seems now near a new attempt for a bullish momentum and direction..
The market movers that await euro-dollar in the coming week could therefore play a crucial role, just as has happened with the US GDP previous week..

GBPUSD Forecast for May, 18 2016 upon Unfavorable DataIf GBPUSD data unfavorable at London times then I am short at 1.4420 aiming for 1.4350 on hourly based Chart. And on long side I am aiming for 1.4280. Let's See
