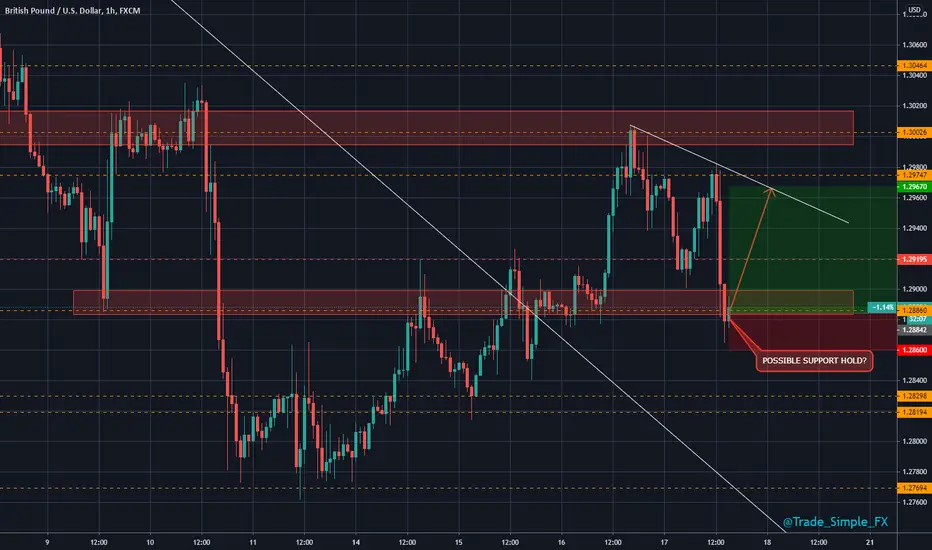
GBPJPY Setup IdeaWith just one month left to reach a deal protecting ~$1 trillion worth of trade between the EU and UK, this will probably be a critical week for Brexit negotiations.
UK and EU haven´t reached an agreement over the Fishing Rights and Competition (EU loves its single market so it wants UK to play by the same rules). The fact that an agreement on such an important matter haven´t been reached might encourage speculation regarding the Sterling Pound and provoke a slight slip in the price of the Pound against other assets.
Economics

Debt / GDP and other economic dataAll series are on their own scale. This chart serves 1 purpose, to see change in the values relative to their own range, over time and thereby giving a visual way to see how they moved versus one another over time.
The chart is broken down by presidential terms. This chart does not imply that any one president caused or did something, it's simply a good way to get an idea of what was happening as the executive budget and current ideology has an impact on debt levels.

Amazon's CollapseHow are giants/bosses defeated in video games? There's always a weak spot. Amazon's weak spot happens to be in its core foundation. This essentially means they're founded on demand-side economics. However, in the real world, the economy can only function off of supply-side economics. But with the role Big tech, the Deep state, the Liberal agenda, and all of these business tycoons are playing in our politics, they may be able to synthesize a false reality & force us into a Socialist state. That's a BIG "if" though, and in the end, nature ALWAYS wins. They may be successful at doing this in the beginning, but it will be short-lived and we will rotate back to Capitalism as it's the only way reality (on God's terms) works. A rotten pillar will always be a rotten pillar, no matter how much you bandage it up. And you can't buy an apple, without that apple first being grown. 1+1 always equals 2 and NOTHING can change that. The bigger they are, the harder they fall. Remember this a few years from now.


USDCHF D1 - Short SetupUSDCHF D1 - Here is the update on USDCHF, the big daily resistance is approaching, we can see where the fundamental spike started, but are we going to exhaust where we would expect? Simple react to what we see unfold. These higher timeframes do a bit more time to unfold (for obvious reasons), but they do provide a bit more protection against false sense of confirmations.

EURJPY H4 - Short SetupEURJPY H4 - Little bit of a relief rally yesterday from our identified support zone, recent H4 candle has closed to break support, potential rejection of weekly key level and retest of that broken zone before possible short continuations, simply support turned to resistance. Very similar to DXY where resistance turned to support.

GBPCHF H1 - Long Trade SetupGBPCHF H1 - Lower timeframe analysis on GBPCHF, double bottom on support, key support zone as indicated with the white horizontal line, this is the start of the 2 stage reversal! Those that have got the advanced course, keep an eye on this! This would effectively act as the confirmation for this setup for intraday trading.

March 24 low thru today = bullgasmIn March 2020, the stock market melted down due to a run on securities, which started in the repo markets, dollar-funding markets, and entered every market. This was a liquidity crisis that unfolded faster than the world had ever seen before. Then, governments stabilized the markets with monetary and fiscal policy. Today, liquidity looks OK. Banks look OK. The economy bounced upward in Q2 and Q3 (although I think this was more technical due to pent up demand and stimulus).
With liquidity OK, some are calling the coast clear. Liquidity is OK because governments have been able to engage in QE, essentially printing money and borrowing to stimulate their economies. But bad things can still happen to undermine confidence in currency, which would likely cause another run on the markets.
Here are 3 bad things to think about:
Bad Thing #1. China could invade Taiwan, calling the US alliance system into question. (Bearish USD)
People want USD. Why? Because it's what people use. Why? Because it's backed by the faith of the US government. Why does that matter? Because the US government maintained what Peter Zeihan calls "the global order" or the alliance system. As a result of WWII and the Cold War, the US bribed and prodded other countries to get along as best they could. The resulted in an era of continuity that allowed trade to flourish. Everyone did business with the US and bought dollars for this. When countries did business with each other, they also used dollars.
SCENARIO 1. US does nothing about China invading Taiwan.
Japan, S. Korea, Vietnam, Australia, India, and our other partners in the region would realize they're on their own. This would signal the American abandonment of the global order. That would mean less security on the seas, less international trade and less demand for dollars. With less demand for dollars, the US Treasury wouldn't be able to print as many dollars without moving the dollar down. The consequences of QE would devalue the dollar quickly. QE would have to be reduced, and then individuals and companies would be forced to bail themselves out by going through bankruptcy or modifying loans or pumping the bakes on spending.
Scenario 2. US goes to war with China over invading Taiwan.
In this scenario, the US government defends the alliance system. But then has to focus on fighting a war. The economy becomes a war-driven economy, with factories producing things needed for the war. Stimulus checks - bye bye. All resources go toward crushing China. Meanwhile, the economy stagnates because anything that isn't war-driven becomes non-essential. The record levels of corporate debt (yes, the same companies on SPX), would be called into question by bond investors (great job, bank passing the risk onto the bond market due to post-2009 financial rules). That would mean a run on US debts, which would of course, mean lights out for stocks – since stocks are give last priority in a bankruptcy.
Bad Thing #2. US companies become insolvent
What is all of this chatter on the internet that Biden's tax plan wouldn't make much of an impact on the economy overall? In aggregate, maybe not. But when it comes to the specific companies on SPX with high debt service payments and low EBITDA, higher Taxes would suffocate earnings growth to the point of insolvency and push stock prices down.
Bad Thing #3. No more debt financing
There's all this talk about "low interest rates are causing investors to pour into stocks because it's the only area that will get a return." If that's the case, then why would anyone want to loan companies money? Why not just buy their stock – an action that, most of the time, results in no inflows of cash to the companies? In other words, fine – no more credit. We'll just trade your stock. And then companies will be left to figure out how to service their massive amounts of debt while figuring out how to grow revenue. They'll likely make more job cuts, which will spiral into less consumer spending and we know where that leads. The same idea applies to an inflationary scenario. If there's inflation, why should I settle for today's low bond yields? Inflation ticking up would either drive up real interest rates or dry up supply of capital for bonds. For SPX companies, many of which require massive inflows of debt financing to grow, this wouldn't help them grow earnings to say the least.
There are many more bad things that are likely to happen like no stimulus before the election and then political drama dragging it out until February 2021, No Deal Brexit, CLOs (oh they're doing just fine – really?), and many more wars raging across the world that could accidentally drag superpowers into them. WWI started by an accident. In 1914, British Foreign Sec., Sir. Edward Grey, said "The Scene has never looked so calm." By the summer of 1914, Chamberlain was announcing over the radio that Britain has gone to war. It took 1 month for Europe to go from peace to all-out war.

EuroStoxx bearish ideaWell, the situation in Europe isn't pretty. Let me highlight a couple of issues.
Slowed economic growth
The Euro zone had registered slowed manufacturing growth way before COVID19 hit. The pandemic just hit the nail on the head. The region is now experiencing an economic slow down compared to the 2020 summer season and this is going to affect the recovery in Europe.
Second wave of Covid19 cases
It's already officially that the continent is in the second wave of the pandemic. Lockdowns will further hurt supply chains in the region. However, a full scale lockdown may not happen as governments focus on specific localised targeting. Bars in France have been closed and Madrid is in lockdown (sort of).
Trade issues including Brexit
First, Europe is in the middle of a trade spat with the US. Well, Donald Trump has bully tendencies and hopes to reorganise the world trade order. Whether it's working for the US on not, we'll look into it on another day. However, it is hurting EU exports to the US. Exports to China, Europe's second largest export market, are not growing as expected as China has sort of refused to open up their market as agreed in an agreement between the two parties. China still has protectionist tendencies of it's steel and agricultural industries which the EU may be targeting.
This is just a few of the factors I'm following up with in Europe.
Technically, this index is slowly losing momentum after failing to recover fully from the February drop. On the Monthly chart, the 0.618 level is acting as a strong support.
It has been ranging in the lower timeframes hoping not to slip lower.
However, data may not give investors enough reason to hold on to the equity markets. We could see lower prices soon with the grim data. ECB intervention may stop this slip, but my money is on 3100 target 🎯.

State of Everything - HTF Technicals and Econometrics (Oct '20)In this analysis I'll be evaluating 12 different econometric and technical indicators to see if we can get a feel for BTC's direction over the coming days/weeks/months. This is part of a regular series that I post whenever a significant shift is apparent within a net total evaluation of these metrics.
Note - Some of these indicators are not widely known. At the bottom of this analysis I'll post references to educational articles that describe some of the more exotic indicators.
____________________________________________________________________________
PAGE 1 - Headline Photo (Shown Above):
____________________________________________________________________________
Top left - Golden Ratio Multiplier (info in "resources" section below): The golden ratio multiplier has been one of the strongest indicators for spotting opportune buying/selling opportunities as well as key dynamic support and resistances. During the great 'rona selloff of 2020, we spiked down to the 2x 350SMA multiplier, the exact support that reversed the 2018/2019 selloff and launched us into 2019's bull run (and later ruined by the pandemic). We're just launched off 111 DMA, the moving average that is at the core of this indicator's functionality, after consolidating above for over a month. The fact that the 111DMA held as support and provide a launch point to above is overall, bullish.
Top right - Guppy: I use the Guppy as a strong check for bias. Green - I am bullish , gray - neutral, red - bearish. We just flipped green, bullish. Note: check my scripts for this indicator with backtesting
Bottom left - Log channel: BTC has spent almost its entire life between the white log channels. Taking this indicator alone, we are currently backtesting the channel support. Bearish.
Bottom right - Ichimoku Cloud (1d) + significant EMAs + RSI: The current price is above both the Tenkan and Kijun and a green cloud. This is by-the-books bullish. Price is also above the 55 (yellow), 99 (blue) and 200 (red) EMA's. While the 99, my personal favorite, was challenged there, the price ultimately flipped it as support and used it as a launching point for this recent (albiet small) surge. Bullish.
____________________________________________________________________________
PAGE 2:
____________________________________________________________________________
Top left - S&P500 Correlation: Unfortunately, this indicator says more than most at this time. Ever since the pandemic kicked off economic uncertainty, BTC's correlation with the S&P500 has felt unshakeable. The good news is that the SPY is bullish now as traders speculate over a new economic deal, but I can't help but feel bummed that crypto is still being dictated by the greater market with every move. Regardless, bullish.
Top right - Futures premiums: The last few bull runs have been futures-driven rallies where both the quarterly (blue) and weekly (yellow) contracts have been trading at a premium over spot. Recently we had a period where weekly contracts were trading below, but quarterly was trading above - read as confusion in the market and high uncertainty. Good news - we now have both weeklies and quarterlies trading at a positive premium, which is bullish. I would like to the see the weekly premiums a little higher, but still, I'll take it. Bullish.
Bottom left - Puell Mulitple (info in "resources" section): In short, this metric looks at the supply side of Bitcoin's economy - Bitcoin miners and their revenue. Specifically, BTC issuance to miners. When issuance is low, investors during that period historically have outsized returns. At this time issuance is in a slightly low phase, but not outstandingly abnormal. There is a lot of room to run upwards, but still some room downwards as well. We did however have a recent dip to a Puell of 0.55, which was very close to the ideal buy range, and quite a good buy opportunity in and of itself. Even now as we are around 0.85 Puell, we are quite low and indicates that hodlers (multi-year), should be quite fine to accumulate here while staying weary that better buying opportunities may present itself. For scale, 0.5 Puell and below is a near instant-buy for me. Net, neutral, slightly bullish.
Bottom right - weekly cloud, 21 MA, RSI: There's a lot to look at here, let's start with cloud. The weekly cloud is still bullish with the price above both the Tenkan and Kijun and the bullish cloud twist. A cloud enthusiast would have seen the drop to $9.8 as a simple bullish retest of the weekly Tenkan and a good buy opportunity; which sure enough it was. The last thing I want to note with the weekly cloud is that I would like to see the Kijun have a bullish trend of its own, and close the gap between it and the Tenkan. While absolutely bullish overall, with the Kijun where it is, any bearish shifts may have a violent drop, but we'll cross that bridge when we get there - overall the weekly cloud is quite bullish. Next let's take a look at the 21MA on the weekly. Historically speaking, the 21MA has an almost magical effect for spotting good buy opportunities early or even mid-trend. Reading that alone, there is a beautiful confluence of the 21MA with the Tenkan, with the 21MA also indicating the drop to $9,800 as a good buy. Lastly, the weekly RSI is always an interesting one to watch. The 54 RSI value has played a significant role in past bull runs, where every test is bought up and fuels further continuation. While we've only tested it twice now both tests were successful and can only be read as possibly entering another run. I don't consider 2 to be a pattern, but a couple more successful tests would confirm and should make bulls quite happy, a breakdown should make bears happy. In total: Weekly Cloud bullish, 21MA bullish, RSI bullish (with hopes for further confirmation).
____________________________________________________________________________
PAGE 3:
____________________________________________________________________________
Note: With exception to Stock to Flow, this page mostly consists of long term indicators used to spot extremes where buying/selling is most profitable. There is little change from the last BTC State of Everything Address.
Top left - 2y MA Multiplier: We are about 20% of the distance above the 2y MA support. The current price did just proceed a dip below, which historically has sprung a long term (multi-year) bull run. Long term, bullish . Near term, neutral/irrelevant.
Top right - Stock to Flow: This crowd favorite needs no introduction, but info is in the "resources" section if needed. We're currently in the early stage of the orange phase of stock to flow, which has historically been a bullish period with lots of chop along a slow grind up. Yep, that feels about right doesn't it? The read here is that anything can happen on daily or even weekly timeframes. Traders of daily to weekly timeframes have little to get from this, longer term holders (months/years) should perceive as bullish. Near/mid term neutral, long term bullish.
Bottom left - Pi Cycle (info in "resources" section): Fantastic for sniping tops, we can also glean some info about buy timing. Historically speaking, the Pi Cycle is bullish above the 111 DMA (pink), euphoric above the 2x350 DMA (green), and primed to sell when the 111 DMA crosses above the 2x350 DMA. Additionally, when bullish, buying dips to the 111 DMA support has proved profitable. However, the 111 DMA is also the core dependency of the Golden Ratio Multiplier from Page 1, so in this particular scenario should not yield additional weight when evaluating all the indicators as a whole. Bullish, but omitting from net-sum calculation (below).
Bottom right - BTC Network Momentum (info in "resources" section): Our momentum is quite low. In fact, it hasn't been this low since 2015. That said, BTCNM does have clear supports, and we are teetering on one of the supports now. Neutral for now, but a break of that support would be a clear bearish sign.
____________________________________________________________________________
SUMMARY:
____________________________________________________________________________
Golden ratio multiplier: bullish
Guppy: bullish
Log channel: bearish
Daily cloud: bullish
S&P500 Correlation: bullish (but not ideal)
Futures premiums: slightly bullish
Puell multiple: long term bullish, mid term neutral
Weekly cloud: bullish
Weekly 21MA: bullish
Weekly RSI: bullish
2y MA Multiplier: long term bullish, short/mid term neutral
Stock to flow: long term bullish , short/mid term neutral
BTC network momentum: neutral
____________________________________________________________________________
CONCLUSION:
____________________________________________________________________________
Bullish - it's this kind of alignment of indicators that I like to see when determining bias. Right now the net sum of the indicator results are clearly bullish, and despite my feelings (I was leaning bearish previously), the data is clear. Putting my emotions aside and reading this for what it is, it's time to take the short shorts off and put on the long pants.
I hope you guys enjoyed this meta analysis of BTC! I have years of experience trading crypto, but am just now beginning to publish my ideas, secret-sauce scripts and handy tools. If you appreciated this post and would like to see more, a like or a follow would be greatly appreciated 😁.
____________________________________________________________________________
RESOURCES:
____________________________________________________________________________
To stay compliant with TradingView house rules, I am unable to post links to these educational articles directly, but I highly encourage you to google them and seek them out. I have taken steps to ensure these resources are purely educational in nature.
Super Guppy TradingView Strategy: unable to link, but check my scripts for source. Includes backtesting, multiples settings, and different risk profiles.
Golden Ratio Multiplier: "The Golden Ratio Multiplier" by PositiveCrypto
Puell Multiple: "The Puell Multiple Bed" by Unconfiscatable
Stock to Flow: "Modeling Bitcoins Value With Scarcity" by 100trillionUSD
Pi Cycle: There's a good section on this near the bottom of the Golden Ratio Multiplier article.
BTC Network Momentum: "Bitcoin Network Momentum" by Good Audience

GBPJPY - LONGGBPJPY is in the upward trending channel, coming off a HL & a inverted head and shoulders pattern, I expect to see a bullish run after a pullback into previous broken S turned R. Investor fears over the Trump's health are easing while health officials expect to discharge the President from Walter Reed as early as today. Also, optimism over a fresh US fiscal stimulus plan is growing as analysts see increased urgency from both sides, House speaker Nancy Pelosi is pushing for the appeal as well. Asia's MSCI Pacific Index climbed 1.3% while Japan's Topix Index closed 1.7% higher. By 5:50am S&P 500 Futures pointed to plenty of green at the open, the 10-year government treasury bond yields skyrocketed.

DEVALUED DOLLAR & BIDEN WIN?: Watch GOLD & Bitcoin The "collective consciousness" as some have called it in the past, the market is an almost perfect diagnostic tool for determining where we are and where we're going. Millions of minds in their buying, selling, and even political voting decisions determine what we value as a society collective. We can see this everyday on charts — the price of stocks, bonds, commodities, forex etc. all reflect what we value. The needs and wants of society tend to repeat, and charts can illustrate these with the patterns they create. Today we see a pattern that hasn't repeated since 2002.
The US Dollar Currency Index (DXY) broke its uptrend it had been making since March 2008. It dipped below the trend line in July and has attempted to recover back above $95, but has failed to and will fail to recover (see DXY September 2002). Looking at the Dollar in 2002, the same pattern had occurred. The dollar broke its uptrend in June and recovered only back to the underside of the trend line. On October 28th 2002, the DXY broke down and started a six year downtrend. GOLD as a stable store of value started its uptrend on the very same day, the 28th of October 2002 and has climbed from $320 to $1900. This is no doubt attributed to the large amounts of currency printing by the Federal Reserve over the last 20 years. In these 20 years we have experienced 3 major economic crises: the Internet Bubble, the Great Recession, and now the global Covid-19 pandemic. In all of them, printing money has been the solution.
Today a month away from an important presidential election the DXY is a month away from resuming a downtrend, GOLD a month away from resuming an uptrend, and Bitcoin a month away from starting a new bull run. The policy of printing money and devaluing our dollar has been the standard for decades now and presidential candidate Biden hopes to continue that legacy. All eyes will be on this election in November and it will greatly influence the movement of hard currencies and stable stores of value. At this critical economic pivot point it would be prudent of anyone to hold cash, wait, and continue to watch Biden, Gold, & Bitcoin.

GBPUSD H1 - Long Trade SetupAggressive selloff fueled by BOE. Other GBP pairs seem like they want to start correction, we have some sort of support zone here on GU, but still very active with bearish markets, interested to see if current price holds as support.
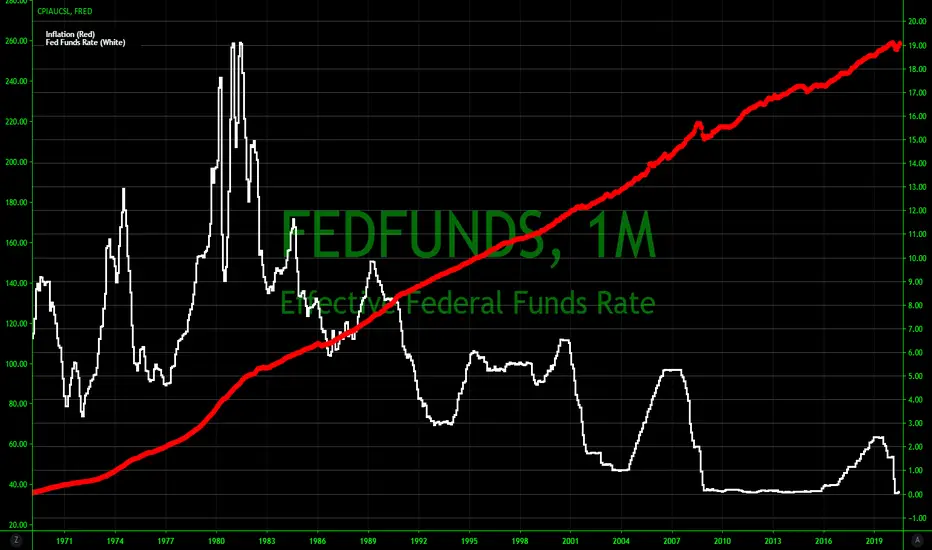
What could go wrong with the yield curve ?New Fed policy will allow inflation to run above its 2% target. To achieve higher inflation the Fed is is expected to hold short-term rates very low for a long time.
A sudden steepening of the yield curve after an inversion almost always coincides with recession.
Aggressive expansion of the money supply through fiscal and Fed policy has led to concerns of rising inflation. The US government needs to fund relief packages and pump money into a weak economy. Excess supply of longer-dated Treasury supply hitting the market may put additional pressure on prices and keep long dated yields moving higher. Institutions may aim to unload expensive long-term Treasuries onto the market which could depress prices and increase yields.
Investors may soon demand higher yields on longer-term debt. But are we ready for higher back-end rates & a steeper curve?
The inflation break-even rate between 10 year Treasury Inflation Protected Securities (TIPS) and regular 10 year Treasuries hit 1.8% last month, the highest since February.

EURJPY H4 - Short Trade SetupEURJPY H4 - Very much the same kind of trading conditions as GBP just a little less aggressive, which we highlighted yesterday. Looking for exactly the same, WAITING for a break downside to clear 124.500 support and then a subsequent retest, this would be the next possible point to jump in with the downside trend hopefully.

The velocity of money is plunging so let's make some coin off itHardly surprising though, this has taken place whenever GDP contracts & unemployment increases as it certainly will this year. I think one would suspect that this could lead to risk of deflationary effects - which I know sounds odd when one thinks and sees first hand the rampant money printing and radical expansion of money supply, and inflation increasing. I am still heavily biased towards inflation arising over the next few years, with rates eventually rising to combat inflation - but I do want to be on the lookout for any hints as swiftly as possible that my ideology may be wrong.
I suspect this drop within the velocity of money is especially pronounced in hospitality industries, restaurants, hotels, aerospace, airlines, tourist destinations - where capital is not being exchanged as freely. We also have unemployment up so some individuals simply are being much more wary of purchasing wants, with potential needs still needing to be met on the horizon.
I think mfg's as well have had supply issues coupled with demand issues, with inventories only now ramping back up. With the low demand, and low supply this is a sour recipe that creates less opportunities for transactions, again hurting the velocity of money.
What does all of this mean? I think one needs to carefully weigh the proper strategies in the event inflation or deflation where to occur. In the event of the dreaded stagflation again, the writing will be more clear if that is to occur, but again we need to plan accordingly and develop strategies for each.
A simple strategy I am doing even outside of the fixed income corporate debt/Div yield strategies etc is within actual real estate.
If one were to acquire a home in this environment and inflationary affects play out, you essentially get to double dip on the inflationary affects in a favorable manner. the devaluation of the dollar will be an effect of the inflation. What does this mean for your mortgage?
The dollar amount of the debt side of the mortgage will decrease in value, relative to the purchasing power of the dollars within the debt. The debt itself gets eroded away from inflation. Very favorable if you have debt.
We want equity with debt of course though. And much more equity relative to the volume of debt. The equity of the home will actually be continuing to rise because the value of dollars continuing to loose value will require more dollars to purchase the same amount of equity - meaning the equity increases in terms of dollars.
So inflation will result in the loan decreasing in a dollar weighted comparison, while the equity in the home will increase because of the dollar's devaluation.
Equity relative to a home is one thing, but this comparison can be made with equities (stocks) as well, but I think the home comparison may be helpful in getting my logic communicated clearly.
Again, this does not mean to go wild longing equities - just like you do not want to go wild and start buying junk houses in the middle of Antarctica
We need to be tacticians with finesse
***If you have a great strategy please be sure to share it with me.***

Crypto VS Dollar: Are we bearish soon?So to begin with, a negative dollar means a few things;
As the stock market valuations are pegged to the dollar, a weaker dollar will actually PUSH the DOLLAR value of stocks up, so technically the stocks are sometimes not rising on actual value but adjusting their real value to the new dollar rate.
Therefore, this holds true for Bitcoin and Ethereum, if the dollar falls in value, the price of bitcoin has to rise to adjust as Bitcoin /Ethereum has not lost any value, however, we can expect the same adjustment when the price of the dollar rises; unless external circumstances create new market conditions such as the Corona Virus Outbreak.
This may mean a bearish turnover for the crypto market, although we may not want to accept it.
You are all welcome to share your thoughts and opinions on this, and please SHARE & LIKE
-Megalodon
COINBASE:ETHUSD BINANCE:ETHBTC BINANCE:ETHUSDT BITSTAMP:BTCUSD BINANCE:BTCUSDT

Accessing FRED data via TradingViewHey guys.
As a macro trader, I really need to look at a wide variety of indicators and market data, whether economic or price based.
However, I HATE many of the other charts that are out there.
So I'd like to introduce you to a little known trick.
Have you heard of Quandl?
They provide alternate data sets for loads of different types of things, whether it's COT data, corporate debt, carbon emissions... you name it, you can probably find it.
The problem is that many of these cost.
Enter FRED, or 'Federal Reserve Economic Data', compiled by the Federal Reserve Bank of St Louis.
They provide data on their website, but the charts aren't very intuitive and you can't manipulate, compare or add in other assets to try to visualise a thesis.
So, there's a great solution.
In the chart above, I have shown the 10-Year Treasury Constant Maturity Minus 3-Month Treasury Constant Maturity.
This is an interest rate spread - and specifically, it's identifying a steepener trade (this shows that the yield on longer term bonds are rising faster than shorter term bonds, so could be indicative of an increase in inflation expectations).
So what I did was go onto FRED (give it a Google), copy the data code (T10Y3M), head over the Quandl (again, give it a Google), then pop that code into the search box.
You'll then see the data set pop up.
Click through and you will see a standard boring orange line chart.
But over to the right, you'll see 'Excel/TradingView' buttons.
Click TradingView and you can view the data in TV charts!
FRED data is all totally free and it's pretty comprehensive.
Check it out and let me know what you think.


Equities and their relationship to CPI InflationBull markets tend to follow a drop in CPI, once the deflationary relationship ceases and goes back into inflationary mode.
As it takes additional "devalued currency" to acquire the consistent amount of the equity in relation to it.
In addition, with low rates, this creates opportunities to take on debt (with equity as well) such as a home, as the loan itself will be eroded away in terms of the dollars within the loans purchasing power. While the underlying asset will appreciate in comparison to the devalued/inflated dollars relative to it.
So may be time to buy that home you were considering!

Similar chart, but drilled into a bit deeper. Rates/InflationThis chart bodes well for manufacturing, and real estate, equities and commodities.

Unemployment Rate Overlayed Federal Funds RateOne must admit it is remarkable where the unemployment level was pre-covid. There would have been a considerable melt up within the market at peak employment like that.
It is a trying state of affairs as the unemployment rate is viciously targeting various sectors relentlessly.
