S&P 500 Daily Chart Analysis For Week of July 11, 2025Technical Analysis and Outlook:
During this trading week, the S&P 500 Index has shown a predominantly downward/upward course of action and created a new Key Resistance at 6280. Currently, the index exhibits a bullish bias, with the Outer Index Rally objective set at 6420. However, it is crucial to note that the current price action may cause prices to see in a new light from their current fluctuation to push toward the Mean Support at 6200 before resuming their upward movement.
Economy

EUR/USD Daily Chart Analysis For Week of July 11, 2025Technical Analysis and Outlook:
In this week's trading session, as expected, the Euro continued its decline, reaching our Mean Support level of 1.168. Recent analyses suggest that the Euro is likely to experience a further downward trend, with the next target set at the Mean Support level of 1.160. However, it's essential to consider the possibility of a rebound toward the Key Resistance level of 1.181, which could lead to the completion of an Outer Currency Rally reaching 1.187.

Bitcoin(BTC/USD) Daily Chart Analysis For Week of July 11, 2025Technical Analysis and Outlook:
In the last week's trading session, Bitcoin has demonstrated a significant surge, achieving historical prices as anticipated by TSS for an extended period. The cryptocurrency has successfully completed both the Outer Coin Rally 114500 and the Inner Coin Rally 118200. Presently, Bitcoin is poised to celebrate this notable accomplishment with a victory lap, but it may face a potential downward trajectory, targeting the Mean Support level of 112000. This anticipated decline will necessitate the resilience to a retest of Inner Coin Rally 118200. The designated targets for the Outer Coin Rally at this juncture are 122000, 126500, 132200, and 135000.

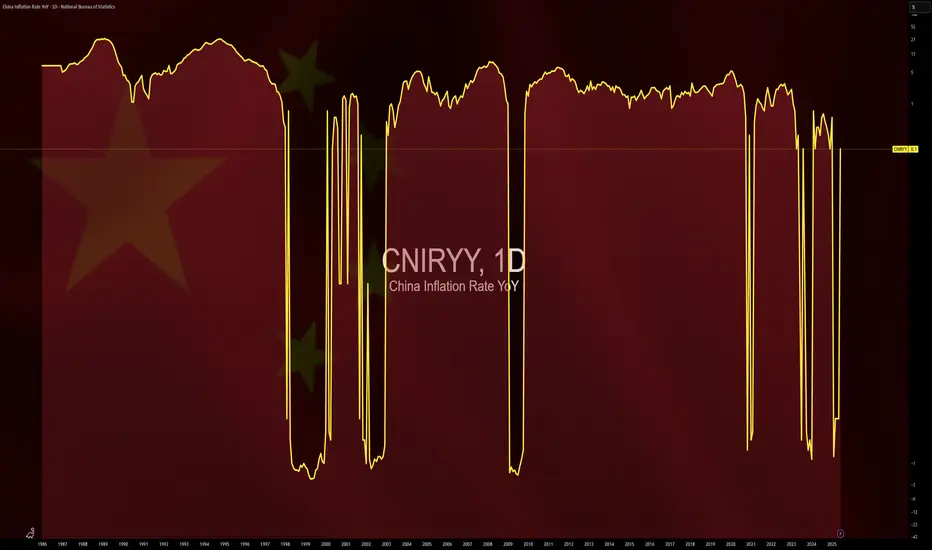
$CNIRYY -China's Inflation Data (June/2025)ECONOMICS:CNIRYY
June/2025
source: National Bureau of Statistics of China
- China’s consumer prices rose by 0.1% yoy in June 2025,
reversing a 0.1% drop in the previous three months and surpassing market forecasts of a flat reading.
It marked the first annual increase in consumer inflation since January, driven by e-commerce shopping events, increased subsidies for consumer goods from Beijing, and easing trade risks with the U.S.
Core inflation, which excludes volatile food and fuel prices, rose 0.7% yoy, marking the highest reading in 14 months and following a 0.6% gain in May.
On a monthly basis, the CPI fell 0.1%, after May's 0.2% drop, pointing to the fourth monthly decline this year.
XAUUSDHello trader
Gold and the recent correction levels
Before the rally and never returning
This is one of the last opportunities to enter gold
In areas below $3,000
The final correction
If it occurs and the price enters the $2,700-$2,800 range
These are ideal buying areas.
Good luck to everyone.

$EUIRYY - Europe CPI (June/2025)ECONOMICS:EUIRYY 2%
June/2025
source: EUROSTAT
- Eurozone consumer price inflation rose slightly to 2.0% year-on-year in June 2025, up from May’s eight-month low of 1.9% and in line with market expectations, according to a preliminary estimate.
The figure aligns with the European Central Bank’s official target.
Among major economies, inflation in Germany unexpectedly declined, while France and Spain saw modest increases and Italy’s rate held steady.

Bitcoin(BTC/USD) Daily Chart Analysis For Week of July 4, 2025Technical Analysis and Outlook:
During this week's trading session, Bitcoin rebounded from our Mean Support level of 104900 and, with significant momentum, subsequently completing the Mean Resistance level of 110300. Currently, the cryptocurrency is poised for a continuation of its downward trajectory, with a target set at the Mean Support level of 105500. This downward trend may necessitate heightened resilience to address the Key Resistance point at 111700 and the emerging historical price action of the Outer Coin Rally at 114500 and beyond. Nonetheless, it remains essential to acknowledge the possibility that current prices may experience an uptick from this juncture, bolstering the rally mentioned above.

EUR/USD Daily Chart Analysis For Week of July 4, 2025Technical Analysis and Outlook:
During the trading session this week, we witnessed the successful completion of the Outer Currency Rally at a level of 1.177. Recent analyses suggest that the Euro is likely to encounter a downward trend, with an initial target set at the Mean Support level of 1.168 and a potential extension to an additional Mean Support of 1.160. Nevertheless, it is crucial to acknowledge the possibility of a subsequent increase toward the next Outer Currency Rally level of 1.187 before any definitive downward movement transpires.

S&P 500 Daily Chart Analysis For Week of July 3, 2025Technical Analysis and Outlook:
During this abbreviated trading week, the S&P 500 Index has primarily shown an upward course, hitting and surpassing our target for the Outer Index Rally of 6235. Currently, the index demonstrates a consistent bullish trend, with the following objective for the Outer Index Rally set at 6420, followed by forthcoming targets of 6620 and 6768. Nevertheless, it is crucial to acknowledge the current price action may cause prices to retrace from their current fluctuation to test the Mean Support at 6200 before resuming their upward movement.

S&P 500 Daily Chart Analysis For Week of June 27, 2025Technical Analysis and Outlook:
During the current trading week, the S&P 500 Index has predominantly demonstrated an upward trajectory, surpassing the Mean Resistance level of 6046, the Outer Index Rally target of 6073, and the critical Key Resistance threshold of 6150. Currently, the index is exhibiting a bullish trend, indicating potential movement towards the Outer Index Rally objective of 6235. However, it is essential to note that there is a substantial probability that prices may retract from their current levels to test the Mean Support at 6136 before experiencing a resurgence.

EUR/USD Daily Chart Analysis For Week of June 27, 2025Technical Analysis and Outlook:
In the course of this week's trading session, the Eurodollar has exhibited a strong rebound, successfully retesting and surpassing the Outer Currency Rally threshold of 1.163. Recent analyses suggest that the Euro is poised for further upward advancement, with the key target to reach the outer currency rally target of 1.177. Nonetheless, it is essential to recognize the possibility of a subsequent decline to the Mean Support level of 1.160 before a definitive upward movement.

Bitcoin(BTC/USD) Daily Chart Analysis For Week of June 27, 2025Technical Analysis and Outlook:
Throughout this week’s trading session, Bitcoin has demonstrated an upward trajectory and is positioned to achieve the specified targets of Mean Resistance 110300 and Key Resistance 111700. This progression may ultimately culminate in the realization of the Outer Coin Rally 114500 and beyond. Nevertheless, it is crucial to recognize the possibility of a subsequent decline from the current price to the Mean Support level of 104900 before a definitive upward rebound.

S&P 500 Daily Chart Analysis For Week of June 20, 2025Technical Analysis and Outlook:
The S&P 500 Index has primarily exhibited downward trends during this week’s abbreviated trading session, narrowly failing to reach the targeted Mean Support level of 5940, as outlined in the previous Daily Chart Analysis. Currently, the index exhibits a bearish trend, suggesting a potential direction toward the Mean Support level of 5940, with an additional critical support level identified at 5888.
Contrariwise, there exists a substantial likelihood that following the accomplishment of hitting the Mean Support of 5940, the index may experience recovery and ascend toward the Mean Resistance level of 6046. This upward movement could facilitate a resilient rally, ultimately topping in the completion of the Outer Index Rally at 6073, thereby enabling the index to address the Key Resistance level situated at 6150.

EUR/USD Daily Chart Analysis For Week of June 20, 2025Technical Analysis and Outlook:
During this week's trading session, the Eurodollar has encountered a significant decline, dipping below the Mean Support level of 1.149; however, it exhibited a modest recovery on Friday. Recent analyses indicate that the Euro is likely to decrease further to the Mean Support level of 1.148, with the potential for extending its bearish trend to reach 1.140. Nevertheless, there remains a possibility that the current recovery will persist, which could result in price movements targeting the Key Resistance level at 1.158 and potentially leading to a retest of the Outer Currency Rally's 1.163 mark.

Bitcoin(BTC/USD) Daily Chart Analysis For Week of June 20, 2025Technical Analysis and Outlook:
In the recent trading session, Bitcoin exhibited an upward trend; however, it subsequently experienced a significant decline from the established Mean Resistance level at 110300. On Friday, Bitcoin exhibited notable price action, characterized by a pump-and-dump scenario. At this juncture, Bitcoin is retracing downwards as it seeks to approach the Mean Support level at 101500 and the ultimate Inner Coin Dip at 96500. It is essential to acknowledge the potential for an upward rally from the Mean Support levels of $101500 and/or the Inner Coin Dip at $96500. Such a rally could culminate in a retest of the Mean Resistance level at $107000.

$JPIRYY -Japan CPI (May/2025)ECONOMICS:JPIRYY
May/2025
source: Ministry of Internal Affairs & Communications
- Japan's annual inflation rate edged down to 3.5% in May 2025 from 3.6% in the previous two months, marking the lowest level since November.
Price growth eased for clothing (2.6% vs 2.7% in April), household items (3.6% vs 4.1%), and healthcare (2.0% vs 2.2%), while education costs fell further (-5.6%). In contrast, inflation held steady for transport (2.7%) and miscellaneous items (1.3%), but accelerated for housing (1.1% vs 1.0%), recreation (3.0% vs 2.7%), and communications (1.9% vs 1.1%).
Meanwhile, prices of electricity (11.3% vs 13.5%) and gas (5.4% vs 4.4%) remained elevated.
On the food side, prices increased by 6.5%, staying at the slowest pace in four months, though rice prices soared over 100%, underscoring the limited impact of government efforts to rein in staple food costs.
Meanwhile, the core inflation accelerated to 3.7% from 3.5% in April, reaching its highest level in over two years, ahead of the summer election.
Monthly, the CPI rose 0.3%, after a 0.1% gain in April.

$GBINTR - Steady Rates by BoE (June/2025)ECONOMICS:GBINTR
June/2025
source: Bank of England
- The Bank of England voted 6-3 to keep the Bank Rate steady at 4.25% at its June meeting, amid ongoing global uncertainty and persistent inflation.
The central bank noted inflation is expected to remain at current rates for the rest of the year before easing back toward the target next year,
indicating that a gradual and cautious approach to further monetary policy easing remains appropriate.

$USINTR -Fed Keeps Rates Uncut (June/2025)ECONOMICS:USINTR
June/2025
source: Federal Reserve
- The Federal Reserve left the federal funds rate unchanged at 4.25%–4.50% for a fourth consecutive meeting in June 2025, in line with expectations, as policymakers take a cautious stance to fully evaluate the economic impact of President Trump’s policies, particularly those related to tariffs, immigration, and taxation. However, officials are still pricing in two rate cuts this year.

GBIRYY - U.K Inflation (May/2025)ECONOMICS:GBIRYY
May/2025
source: Office for National Statistics
-The annual inflation rate in the UK edged down to 3.4% in May 2025 from 3.5% in April, matching expectations.
The largest downward contribution came from transport prices (0.7% vs 3.3%), reflecting falls in air fares (-5%) largely due to the timing of Easter and the associated school holidays, as well as falling motor fuel prices.
Additionally, the correction of an error in the Vehicle Excise Duty series contributed to the drop; the error affected April’s data, but the series has been corrected from May.
Further downward pressure came from cost for housing and household services (6.9% vs 7%), mostly owner occupiers' housing costs (6.7% vs 6.9%).
Services inflation also slowed to 4.7% from 5.4%. On the other hand, the largest, upward contributions came from food and non-alcoholic beverages (4.4% vs 3.4%), namely chocolate, confectionery and ice cream, and furniture and household goods (0.8%, the most since December 2023).
Compared to the previous month, the CPI rose 0.2%.

Mr. LATE drop the RATE!!"Jerome Powell aspires to be remembered as a heroic Federal Reserve chair, akin to Tall Paul #VOLKER.
However, Volker was largely unpopular during much of his tenure.
The primary function of the Federal Reserve is to finance the federal #government and ensure liquidity in US capital markets.
Controlling price inflation should not rely on costly credit.
Instead, it should be achieved by stimulating growth and productivity through innovation and by rewarding companies that wisely allocate capital, ultimately leading to robust cash flows... innovation thrives on affordable capital.
While innovation can lead to misallocations and speculative errors, this is a normal aspect of the process.
(BUT it is crucial that deposits and savings are always insured and kept separate from investment capital.)
By maintaining higher interest rates for longer than necessary, J POW is negatively impacting innovators, capital allocators, small businesses that need cheap capital to function effectively, job creators, and the overall growth environment.
Addressing price inflation is a far more favorable situation than allowing unemployment to soar to intolerable levels.
"Losing my job feels like a depression".
But if I have to pay more for eggs, I can always opt for oats.
$JPINTR -Japan Interest Rates (June/2025)ECONOMICS:JPINTR
(June/2025)
source: Bank of Japan
- The Bank of Japan kept its key short-term interest rate unchanged at 0.5% during its June meeting, maintaining the highest level since 2008 and aligning with market expectations.
The unanimous decision underscored the central bank’s cautious stance amid escalating geopolitical risks and lingering uncertainty over U.S. tariff policies, both of which continue to pose threats to global economic growth.
Tokyo and Washington agreed to extend trade talks after failing to achieve a breakthrough during discussions on the sidelines of the G7 Summit in Canada. Meanwhile, as part of its gradual policy normalization, the BoJ reaffirmed its plan to cut Japanese government bond purchases by JPY 400 billion each quarter through March 2026.
Starting April 2026, it will then slow the reduction to JPY 200 billion per quarter through March 2027, targeting a monthly purchase level of around JPY 2 trillion—signaling a measured but steady path away from ultra-loose monetary policy.

S&P 500 Daily Chart Analysis For Week of June 13, 2025Technical Analysis and Outlook:
The S&P 500 Index has displayed both upward and downward movements throughout this week's trading session, narrowly missing the targeted Outer Index Rally level of 6073. Currently, the index is characterized by a bearish trend, warranting attention towards the Mean Support level of 5940, with additional critical support identified at 5888.
Conversely, there exists a significant potential that, upon reaching the Mean Support of 5940, the index may recover and rise to the Mean Resistance level of 6046. This upward movement could facilitate an interim rally, culminating in the completion of the Outer Index Rally at 6073 and enabling the index to address the Key Resistance level positioned at 6150.

EUR/USD Daily Chart Analysis For Week of June 13, 2025Technical Analysis and Outlook:
During the current trading session, the Eurodollar has exhibited notable volatility, mirroring patterns observed in the preceding week. The currency has surpassed both the Mean Resistance level of 1.145 and the Key Resistance level of 1.151, subsequently retesting the significant completed Outer Currency Rally level at 1.157.
Recent analyses indicate that the Euro is likely to revisit both the Key Resistance and the completed Outer Currency Rally and expand further to the next Outer Currency Rally of 1.177 in the forthcoming trading session(s). However, there exists a potential for a continuation of the downward trend from the current level, which could lead to the price action targeting the Mean Support level at 1.149 and possibly a further extension to the Mean Support level at 1.140.
