Bitcoin(BTC/USD) Daily Chart Analysis For Week of Sep 8, 2023Technical Analysis and Outlook:
This week, Bitcoin churned at our completed Outer Coin Dip 25600, indicating bias to move downwards crucial support targets: Mean Sup 25100 and 24300 along with Next Outer Coin Dip 24200. Pivotal Rebound Retest is also in play.
Economy

BluetonaFX - Forex Weekly RecapHi Traders!
Forex Weekly Recap for 04–08 September, 2023:
Fundamentals
The European Central Bank's (ECB) President Lagarde noted that she is focused on inflation expectations and keeping them in check. She also noted that it will be critical for central banks to keep inflation expectations firmly anchored while these relative price changes play out.
The Reserve Bank of Australia (RBA) left the interest rate unchanged at 4.10%, as expected.
RBA’s Lowe gave his final speech as governor, as Deputy Governor Bullock is due to take over as the new head on September 18. Key mentions from him were:
1. It is possible that Australia can sustain unemployment rates below what they have had over the past 40 years.
Interest rates influence housing prices, but they are not the reason Australia has some of the highest prices in the world.
2. The issue that defined his term more than any other was forward guidance on rates during the pandemic.
The Federal Reserve's Waller changed his stance, and he’s now leaning towards a pause on the next interest rate decision. Other key mentions from him were:
1. The jobs data last week showed the job market is starting to soften.
2. Unemployment is about where it was a year ago, so change isn't that big.
3. The data will determine whether the Fed hikes again.
The Bank of Japan’s (BoJ) Takata noted that he is optimistic about hitting the inflation target but remains wary of downside risks. Other key mentions from him were:
1. Japan is seeing early signs of hitting 2% inflation.
2. Japan's economy is recovering moderately.
3. There are signs of change in Japan's trend inflation as rising wages push up inflation expectations.
The Bank of England’s (BoE) Bailey noted that he is expecting a "marked" fall in inflation by year-end. Other key mentions from him were:
1. Wage bargaining has surprised to the upside.
2. Many indicators are signalling a fall in inflation, which will be marked by the end of this year.
The Bank of Canada's (BoC) Governor Macklem delivered his speech at their policy decision meeting. Key mentions from his speech were:
1. They are concerned that progress in bringing down inflation has slowed.
2. They are prepared to raise rates again but don't want to raise them more than they have to.
3. The longer they wait, the harder it is likely to be to reduce inflation.
4. The weakness in second-quarter GDP largely reflected a broad-based slowing in consumer spending and a decline in housing activity.
5. They will take decisions meeting by meeting.
6. They are expecting growth of 'a little less than 1%' over the next few quarters.
7. They expect headline inflation to go up in the near term before it eases.
Key Data
The Eurozone July PPI came in better than expected across the board:
PPI M/M came in better at -0.5% vs. -0.6% expected and -0.4% prior.
PPI Y/Y came in better at -7.6% vs. -7.6% expected and -3.4% prior.
The Australian GDP Q2 came in better at 0.4% vs. 0.3% expected and 0.4% prior.
The Eurozone's July retail sales came in mixed across the board:
Retail sales M/M came in worse at -0.2% vs. -0.1% expected and 0.2% prior (revised from -0.3%).
Retail Sales Y/Y came in better at -1.0% vs. -1.2% expected and -1.0% prior (revised from -1.0%).
The US ISM Services PMI came in better at 54.5 vs. 52.5 expected and 52.7 prior.
The Eurozone Q2 final GDP reading came in worse at 0.1% vs. 0.3% expected as the previous estimate was revised to 0.1%.
The US jobless claims came in better across the board:
Initial claims came in better at 216K vs. 234K expected and 228K prior.
Continuing claims came in better at 1679K vs. 1715K expected and 1725K prior.
Japan's July average cash earnings growth came in worse, which is some concern for the Japanese economy.
Average cash earnings Y/Y came in worse at 1.3% vs. 2.3% prior.
Real wages Y/Y came in at -2.5%.
Household spending came in worse at -5.00% vs. -4.2% prior.
The Japanese final Q2 GDP came in worse across the board:
Japan's Q2 GDP came in worse at 1.2% vs. 1.3% expected and 0.8% prior (revised from 1.5%).
GDP growth annualised came in worse at 4.8% vs. 5.5% expected and 3.2% prior (revised from 6%).
The Canadian Jobs Report came in better across the board:
Employment change came in better at 39.9K vs. 20.0K expected and -6.4K prior.
Full-time came in better at 32.2K vs. 1.7K prior.
Part-time came in better at 7.8K vs. -8.1K prior.
Technicals
Due to the very strong data out of the US this week, the US dollar strengthened against its major counterparts.
AUDUSD 1W Chart
AUDUSD tested the 2023 low at 0.63646 and went below it by a few pips, but there was a lack of momentum to take it further down. The market is currently holding near the new low and is still nearing its 2022 low at 0.61702. A hold at this area, and there is still a possibility of a possible retest of the triangle trendline support break.
USDJPY 1W Chart
Another strong week for USDJPY, as the pair is now comfortably above the 147 handle. The psychological resistance level of 150 looks to be the next big target level.
EURUSD 1W Chart
EURUSD has continued to head downwards after the support break of the rising wedge. The market has now reached the 1.07000 area and had a small bounce just above the 1.69750 area. The demand zone is around the 1.05000–1.05050 area.
GBPUSD 1W Chart
GBPUSD is continuing to look bearish since the ascending channel break. The market looks to be in a retracement wave; there is a demand zone around the 1.22750–1.23000 area.
The key focus for the upcoming trading week will be:
Tuesday: UK Labour Market Report, German ZEW
Wednesday: Japan PPI, UK GDP, US CPI
Thursday: Australia's Labour Market Report, ECB Policy Decision, US Jobless Claims, US PPI, US Retail Sales
Friday: NZ Manufacturing PMI, Eurozone Wages Data, US University of Michigan Consumer Sentiment
We will be back with another Forex Weekly Recap report next week.
Best of luck for the upcoming trading week ahead. Trade safely and responsibly.
BluetonaFX

Lower High, and probably a Lower Low.The market is showing signs of weakening. After the previous high didn't take out the highest high it made on January 22, the momentum started to weaken. The volume is going through a bearish cycle and the VIX is starting to show signs of waking up. The interest rates haven't receded and there are signs of an economy slowdown with upticks in the unemployment and the reduction of the inflation.
The oil market went high, but along with oil production cuts, which means the oil cartels are trying to keep the prices high not by increasing demand, but by reducing supply. This means the economy is reaching the point where more oil is not needed, it's peaking its recovery cycle.
All these ingredients signal we're reaching a level where the overall economy has peaked. It must slow down to allow the inflation to go down, and the so called soft landing would mean the unemployment would not be harsh while the Fed reaches its economic goals. However that is not a guarantee, let's remember we went through a flood of cash after the pandemic, which was what triggered the worst inflation in decades.
Previous bubbles have been because of different reasons, too much debt to enter the raising market, too much interest in tulips, too much promissory e-commerce, the real estate bubble, ... and the story repeats itself, just with different actors. I would call this one the cash bubble, and it is far from over.
Let's remember the printed bills are endorsed by faith, by the believe that they are worth something and the fact that the only one who can legally print them is the government. But they're worthless by themselves. They are not Money, they are tokens that represent money, the money is produced after the productivity of the economy, how many people are in the workforce, how productive the companies are, how efficient the distribution networks are, and the fact that there are transactions going on in the economy, but if there are more tokens (printed bills) than economic activity their value is reduced, and prices are higher (inflation), until the economy catches up with the amount of currency in the market.
My forecast here is that if the Federal Reserve senses a slowdown in inflation, then they will start pivoting the interest rates, at which point they will keep them like that for a while to see how the overall economy reacts, trying to curve the inflation, while keeping the economy moving, until it reaches levels that show signs of stalling, like higher unemployment and reduction of GDP. A reduction of interest rates will start to make the institutional capitals to exit the market to bet on a big bearish market, and while the media will be ignoring these signs, the institutions will be dumping assets until it's so evident that the market panics.
Once the market has been slaughtered, while a lot of chickens run headless on the street, and there are signs of capitulation, it'll be when the big institution will start accumulating assets at a discount and with a lower interest rate, just like it has always happened before, and the cycle will repeat. This time, pretty much like the way it happened on 2009 and 2020, with a large amount of cash to be allocated in financial assets.
"Patterns repeat because human nature hasn't changed for thousands of years."
~ Jesse Livermore.
“The investor who says, 'This time is different,' when in fact it's virtually a repeat of an earlier situation, has uttered among the four most costly words in the annals of investing.”
~ John Templeton.
"Buy when there's blood in the streets, even if the blood is your own."
~Baron Rothschild.

Gold Next Move ! 💣The Fed is still expecting to maintain its hawkish rhetoric, given that inflation remains sticky and the labor market robust. This notion is largely expected to weigh on gold and other metals for the remainder of the year.

S&P 500 Daily Chart Analysis For Week of September 1, 2023Technical Analysis and Outlook:
The Spooz continued upside bias this week by ending its rally at Mean Res 4520. Continuation to completed the Inner Index Rally 4590 is a work in progress. However, the pullback to Mean Sup 4456 is also within the trading picture.

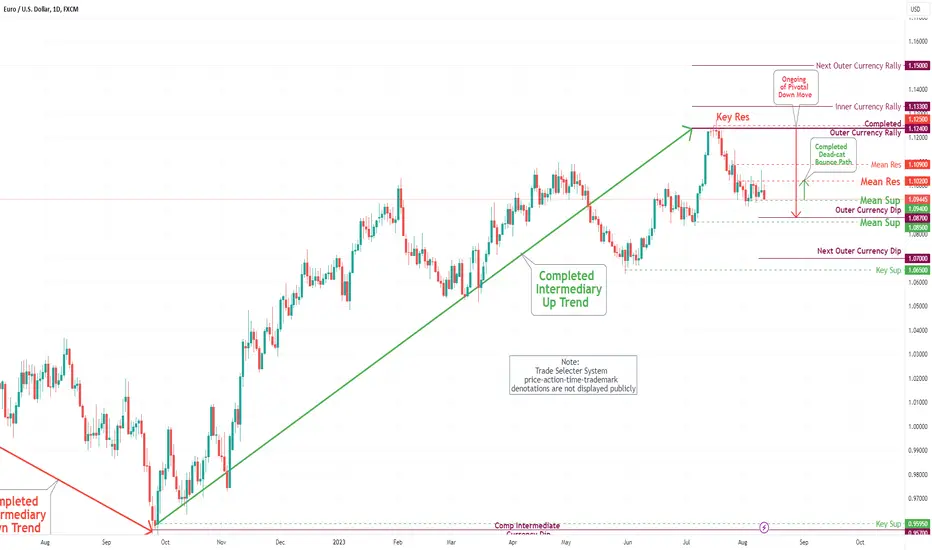
EUR/USD Daily Chart Analysis For Week of September 1, 2023Technical Analysis and Outlook:
The Eurodollar rebounded off to our Mean Res 1.090 and some more; however, as a solid ongoing pivotal move, sentiment mode is dictating the designated target of the Outer Currency Dip 1.070 is inevitable.

Bitcoin(BTC/USD) Daily Chart Analysis For Week of Sep 1, 2023Technical Analysis and Outlook:
On August 23, Bitcoin made a significant recovery and reached our Mean Resistance level. The next target on the downward movement is the Outer Coin Dip, which is at 24200. There is a strong chance that the Mean Resistance 27800 level may be retested.

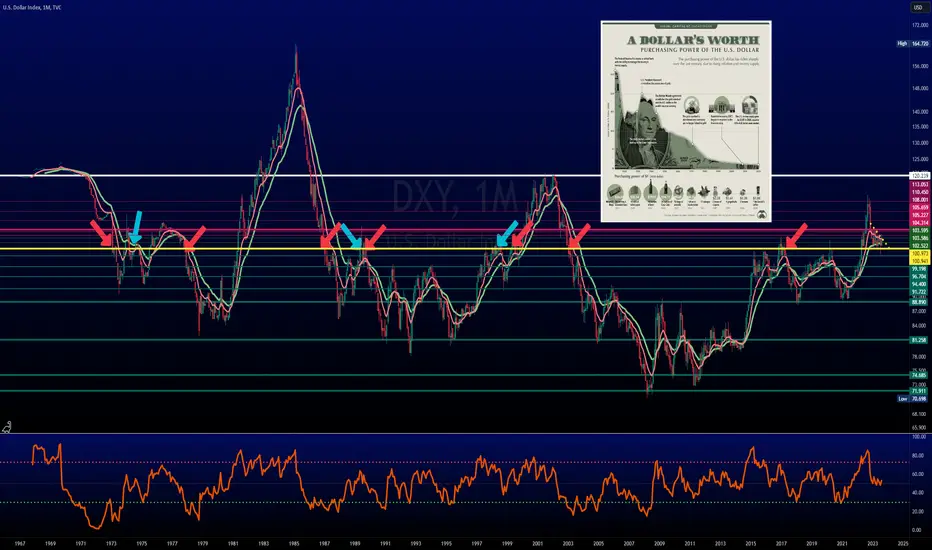
$DXY may be strong vs currencies but it's in trouble longer termWe've stated that TVC:DXY has been in danger for over 2 years.
(Not here but on Twitter)
The real purchasing power of US #Dollar has vaporized and has lost over 95% of its original value!
The current system is on pace for a reset. Whether this is by design or not is irrelevant. There are trillions of dollars in derivatives, almost half was "compressed" recently to hide it, & debt. It's like tiny hole in a dam.
-
The Petro #Dollar could be on its last legs as Saudi Arabia wants to be a part of #BRICS.
This alliance is gaining momentum. They are forming allies & many more want to join.
Not only is #currency at play here but their dominance of the #energy market, which is critical, seems to be their endeavor, .
#CBDCs #CBDC #GOLD #SILVER #BTC #Bitcoin
Shanghai Stock Market (SSE Composite Index): A Closer LookThe Shanghai Stock Market is like a financial puzzle, and right now, it's showing us some interesting moves.
First, the rise in the 10-year yield from 3-year lows suggests that there might be changing expectations about economic growth, inflation, or monetary policy. This could be due to a variety of factors such as improved economic prospects, inflation concerns, or changes in the global interest rate environment. The central bank also did something important by closing a 5-billion yuan money deal. It's like they're keeping a watchful eye on how money is moving around. On top of that, they pumped a massive 385 billion yuan into the system, which can make things more exciting.
Now, let's talk about Ichimoku Cloud analysis. It's like a weather forecast for the stock market. Right now, it's showing that the market might be heading up, which is a positive sign. However, the cloud isn't very thick. This means we should be a bit cautious.
There's another important sign on this chart. Tenkan points up, suggesting the market might go up soon, even though it's under Kijun resistance line. It's a bit like seeing a green light at an intersection, even if the other light is still red.
So, as we decode these numbers and signals, it's clear that the Shanghai Stock Market is in a state of flux, with various factors at play. Investors will need to stay vigilant, considering both the data and the bigger economic picture to make informed decisions in the coming year.

S&P 500 Daily Chart Analysis For Week of August 25, 2023Technical Analysis and Outlook:
The Spooz rock and roll to the upside in this week's price action, hitting our Mean Res 4460 as advertised in Daily Chart Analysis For the Week of August 18 with rinse and repeat, is not out of the question. On the downside, price action continues targeting our completed Inner Index Dip 4340 for a retest and drift further down to the next Inner Index Dip 4212.

EUR/USD Daily Chart Analysis For Week of August 25, 2023Technical Analysis and Outlook:
This week's price action of the Eurodollar turned out to be nothing but down modish as projected, by fulfilling our Outer Currency Dip of 1.087 and drifting to the next Outer Currency Dip of 1.070. However, the dead-cat rebound to Mean Res 1.090 should not be ignored.

Bitcoin(BTC/USD) Daily Chart Analysis For Week of August 25,2023Technical Analysis and Outlook:
This week, Bitcoin surpassed two key targets: Outer Coin Dip 28200 and 26900, indicating that the next Outer Coin Dip 24200 is likely, with the Mean Res 26650 serving as a temporary support for price action. However, an extension to Mean Res 27800 should not be dismissed.

$DJI reached 1k+ point drop & 1st target levelGood Morning!
TVC:DJI reached the level that we called for, the 1k point drop we spoke about.
Now what?
Coincidentally, the index is slight oversold.
#FED can only fight #inflation, it cannot nor will it tame it.
If it insists it will hurt #economy. But, they've been saying they know this!
Since they began to raise we made it clear, they're going to break something, but what?

V shape bounce QQQ NasdaqAs per chart, we have finally moving back up from the first half of bear of August.
Market got its liquidity and moving up now. Great time to buy. Indicator for Rate of Change is also turning up (Top indicator chart

XAU/USD -Facing Local Resistance- Gold is facing a local resistance trendline which previously was acting
as Support trendline within the pattern.
Last 3D candlestick print managed to put a higher high in terms of market structure (BoS).
Entry from here is quite risky, however, spot SL is just about 1% from current price.
Last 3D Candlesticks looks like a Bullish Hammer being printed, yet weak in terms
of price action having experienced rejection from resistance trendline .
Wave 5 anticipation for Gold, headed to NATH, but first, price needs to pick it self back up
and penetrate through the broken trendline in order to continue higher.
Quite some critical moves ahead for Gold's Direction
TRADE SAFE
*** Note that this is not Financial Advice !
Please do your own research and consult your own Financial Advisor before
partaking on nay trading activity based solely on this Idea.

S&P 500 Daily Chart Analysis For Week of August 18, 2023Technical Analysis and Outlook:
This week, the Spooz index finalized its down move by completing the Inner Index Dip 0f 4340. However, a strong rebound is possible with Mean Res 4460 as a primary target. On the downside, price action might churn about the completed Inner Index Dip 4340 and Mean Sup 4330 before taking off to the upside. Notwithstanding, if all fails, the market will take us to the Next designated target of Inner Index Dip 4212.

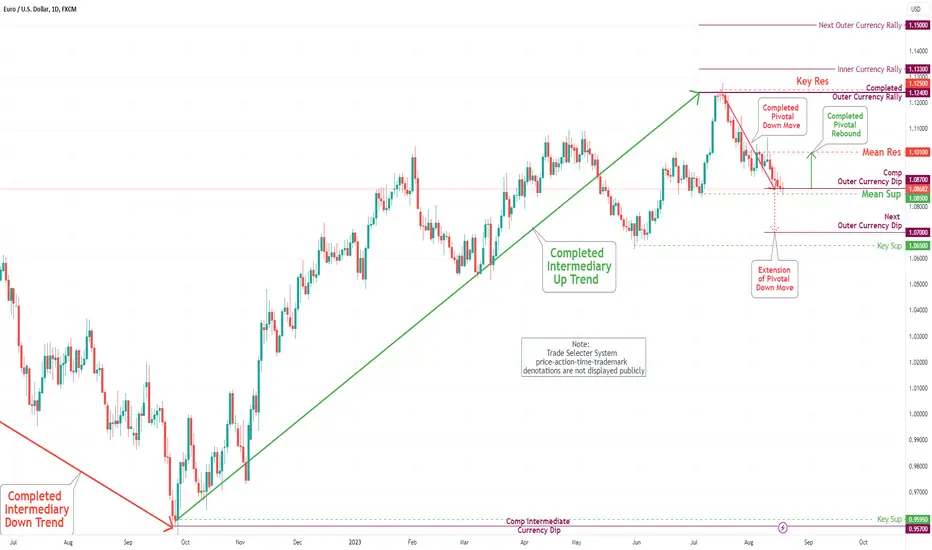
EUR/USD Daily Chart Analysis For Week of August 18, 2023Technical Analysis and Outlook:
The price action of the Eurodollar remained downwards as projected by Trade Selecter by completing our major target Outer Currency Dip 1.087. However, a strong rebound is possible with Mean Res 1.101 as a target. On the downside, price action might take us to the Next Outer Currency Dip of 1.070.
Bitcoin(BTC/USD) Daily Chart Analysis For Week of August 18,2023Technical Analysis and Outlook:
As per Trade Selecter projection, Bitcoin's prices have plummeted, destroying Outer Coin Dip 28900, 28200, and 26900, respectively, and completing Outer Coin Dip 25600. The downward trend continues with Mean Sup 25100 and Next Outer Coin Dip 24200, but a strong rebound is possible with Mean Res 27800 as a target.

Short Dollar Index at Strong Resistance
The US dollar index, technical analysis compared against the seven other major FX currencies(AUD, CAD, JPY, CHF, GBP, EUR, and NZD), is at a strong resistance level, with RSI momentum levels close to being overbought.
Fundamentally and based on the analysis of various economic indicators, the US dollar appears to be leaning towards an inflationary bias, but some conflicting signals suggest potential deflationary pressures. Key points include:
Leading Indicators: PMI and Services PMI indicate a growing economy, potentially leading to inflation. However, momentum is slowing down, which could temper the inflationary outlook.
Money Indicators: M2 is historically low and bouncing higher, coupled with the decreasing interest rates (IRs) and real interest rates (Real IRs) velocity, indicating a possible shift towards looser monetary policy and an inflationary bias.
Inflation Measures: While CPI inflation is now close to average levels, the Core CPI is heading toward normality and decreasing, suggesting some downward pressure on inflation. PPI (Producers Inflation) has shown signs of bouncing higher, indicating potential inflationary tendencies.
Employment: Employment trends point to medium to low inflation expectations, as employment change is within YoY% average levels.
Considering these factors, the ultimate currency bias leans slightly towards an inflationary outlook for the US dollar. However, the mixed nature of the signals suggests a need for continued monitoring of economic indicators and policies to accurately assess the currency's direction.

📈MY TAKE ON THE FED, INFLATION AND CREDIT📊
TLDR: I think the price increase we are seeing is not inflation, the economy is going from bad to worse and the FED's actions don't make any sense.
At the peak of the great inflation of the 70s in USA while both long and short term interest rates were going up together with inflation, so was the aggregate credit.
In fact loans to businesses were growing faster than inflation.
Whereas now, while the short term rates are going up the aggregate credit is going down. Businesses aren’t borrowing and the banks aren’t lending.
And as it was established by Milton Friedman, inflation is exclusively a MONETARY phenomenon.
Therefore price increase followed by unchanged or decreased aggregate credit in not inflation. Which is exactly what we are seeing right now.
It might be attributed to the ongoing effects of the Covid era supply shock which created long lasting bottlenecks, the war in Ukraine or some other fundamental systemic economic problem but it’s not conventional inflation which means that raising interest rates will do nothing but further damage the already weak economy (which is reflected in the unprecedented drop in demand for credit)
So, the further rate hikes that were hinted yesterday by the FED don’t make any sense and we should be expecting a fast race to the zero with more QE when the economic sh*t hits the political fan.
But, let’s wait and see.

MACRO MONDAY 7 - CHINA DEFLATIONMacro Monday (7) - Advance Release
China Inflation Rate – $CNIRRY
China entered into deflationary territory in July 2023 and this is being shared by many with an extremely negative outlook for markets. I believe this chart outlines a very different perspective that leans more neutral than cautionary whilst also providing a more usable framework in the event of a recession scenario playing out.
🔴The last 3 global recessions commenced during China's peak inflationary periods, not during deflationary periods. This is the first clear indication from the chart (red circles).
🔵The last 3 periods of deflation in China signaled the forming of a market bottom in 2000 (over 14 months), thee market bottom in 2008 and resulted in positive S&P500 price action in 2020 (blue areas).
Two out of three times China Deflation has been immediately positive for markets.
⚠️The most contentious period of deflation can be assigned to the 2000 Dot Com crash. The commencement of this 14 month period of deflation from October 2001 did not immediately mark the bottom. Instead the S&P500 made a further c.35% decline to gradually form its bottom over those 14 months ending in December 2002. If this was to repeat we could be looking at Sept 2024 as a possible market bottom and a 35% decline would be $2.9k for the S&P....👀
This scenario is worthy of consideration especially factoring in the comparisons of the 2023 AI boom to the 2000 internet boom. As we enter a new technological epoch with the likes of Augmented Reality, Cryptocurrencies and AI, are we getting ahead of ourselves again? Do these technologies need a little more time to mature much like the internet? Are we overextended like we were in 2000? Its hard to answer no to any of these questions but against the backdrop of record levels of QE and Fiscal Deficit we have to keep an open mind as we froth in record levels of liquidity.
What is useful about this chart is that if a 2000 Dot Com crash scenario was to play out from hereon, we could use China’s move back into inflationary territory (above 0% line) as a possible confirmation of a market bottom/reversal as was the case in Dec 2002.
What day is it? 🤣🤣🤣 I released this early brief Macro Monday as I seen this topic repeatedly in my feed today and wanted to share the perspective as soon as possible. There is a strong possibility of a 2nd alternative Macro Monday Chart on Monday 14th. Hope to see you there!
As always I hope the chart offers perspective and utility
PUKA

S&P 500 Daily Chart Analysis For Week of August 11, 2023Technical Analysis and Outlook:
The Spooz index continued this week to drop to fulfill its destination of Mean Sup 4403 and the possibility of Mean Sup 4330. However, another jump toward the newly created Mean Res 4520 level is also possible in this unconventional market.

EUR/USD Daily Chart Analysis For Week of August 11, 2023Technical Analysis and Outlook:
This week, the price action of the Eurodollar remained stagnant between the Mean Res 1.102 and Mean Sup 1.094. Thursday's reversal tips its hand to continue the pivotal down-move mode with the target, Outer Currency Dip 1.087. However, another jump toward the Mean Res 1.102 level is also possible in this rigged market.