$CNIRYY - Deflationary CPI- While ECONOMICS:USIRYY numbers remain inflationary,
having the latest increase to 3.2% on August 10th,
on the other side of the World from the second Global Superpower,
ECONOMICS:CNIRYY came Deflationary at negative 0.3% on 9'th of August,
just a day prior to numbers of ECONOMICS:USIRYY .
Note that The Head of Federal Reserve,
our pal Jerome Powell,
stated that Feds do not see Inflation ECONOMICS:USIRYY coming down to their norm target of 2% CPI
by 2025.
Jerome still believes on a 'Soft Landing'..
How about another Joke, Powell !?
Economy

U.S. Economy Less Interest Rate SensitiveDespite the fastest rise in interest rates since 1981, and an inverted yield curve where short-term rates are much higher than long-term bond yields, the United States has not (at least yet) experienced the recession forecast by the vast majority of market pundits and economists. Why not?
The relatively few contrarians that did not forecast a recession, including myself, had many reasons for a more optimistic view. However, the most critical reason appears to have been an appreciation of how the U.S. economy has changed over decades and become much less sensitive to interest rates.
In the 1950s, 1960s and 1970s, the U.S. economy was driven by housing and manufacturing. The only choice to finance a home was the 30-year fixed rate mortgage, provided by a savings and loan institution, that deliberately borrowed short-term from savers and lent long-term, taking considerable interest rate and yield curve risk. Further, there was no such thing as financial futures or interest rate swaps to allow for the efficient hedging of interest rate risk.
Fast forward to the modern economy of the 2020s. The U.S. is an economy driven by the service sector, and services are considerably less sensitive to interest rate swings than housing and automobiles. Home mortgages come in every size and flavor, from floating rates to fixed rates. Mortgages are originated by specialists and then packaged and sold to pensions, endowments and investors willing to take the risk. There are no savings and loan institutions. Financial futures, swaps and options are available for efficient hedging and management of interest rate risk.
In short, the U.S. economy does not dance to interest rates like it once did. Make no mistake, though; interest rate shifts have a profound impact on asset values, from equities to bonds, to housing. It is just that the impact on the real economy is much more subdued than it once was, and a rise in rates does not automatically mean a recession is around the corner.
If you have futures in your trading portfolio, you can check out on CME Group data plans available that suit your trading needs www.tradingview.com
By Bluford Putnam, Managing Director & Chief Economist, CME Group
*Various CME Group affiliates are regulated entities with corresponding obligations and rights pursuant to financial services regulations in a number of jurisdictions. Further details of CME Group's regulatory status and full disclaimer of liability in accordance with applicable law are available here: www.cmegroup.com
**All examples in this report are hypothetical interpretations of situations and are used for explanation purposes only. The views in this report reflect solely those of the author and not necessarily those of CME Group or its affiliated institutions. This report and the information herein should not be considered investment advice or the results of actual market experience.

ISM New Orders vs Consumer SentimentISM New Orders Vs Michigan Consumer Sentiment index
ISM New orders provide an indication of current consumer demand. Utilising a chart of New Orders readings we can attempt to understand the trend of consumer demand forward. ISM New Orders could be considered an additional gauge of consumer sentiment because if businesses are reporting increases in orders month over month, this demonstrates consumers have the consistently had the resources and the desire to spend. If this continues over months a trend can form and we can capture this direction on a chart. To support the ISM predictive argument I include a chart that illustrates a correlation between the ISM Manufacturing New Orders Index and the University of Michigan Consumer Sentiment Index, the latter of which is considered one of thee leading indicators for predicting future consumer spending/demand. This will be posted in the comments.
According to Investopedia "ISM data is considered to be a leading indicator of economic trends. Not only does the ISM Manufacturing Index report information on the prior two months, it outlines long-term trends that have been building over time based on prevailing economic conditions".
According to the University of Michigan, the Consumer Sentiment Surveys "have proven to be an accurate indicator of the future course of the national economy."
Based on the above correlation I postulate that we can use the ISM New Orders Index as an additional leading/predictive indicator to establish what direction consumer demand is trending. Something we can keep an eye on and something that will factor in this weeks MACRO MONDAY Edition which i will post immediately after this
PUKA

S&P 500 Daily Chart Analysis For Week of August 4, 2023Technical Analysis and Outlook:
The Spooz index experienced a significant drop as a result of the Inner Index Rally 4590 reaching completion last and this week's trading session, respectively. This caused our Mean Sup 4534 and 4507 to be eliminated. It seems likely that the index will continue to decline, potentially reaching our next Mean Sup 4403 and even Mean Sup 4330. However, it's important to note that there could be a Reignited Rally Resumption at the solid and strategic Mean Sup 4403 level, as this week's trading has been heavily oversold.

EUR/USD Daily Chart Analysis For Week of August 4, 2023Technical Analysis and Outlook:
In this week's session, the Eurodollar has decreased to our Outer Currency Dip of 1.087. This has resulted in a very weak Mean Res of 1.102. However, Friday's reversal could indicate a potential extension of the dead cat bounce to Mean Res 1.109, while the Mean Sup of 1.094 is lingering below.

Bitcoin(BTC/USD) Daily Chart Analysis For Week of August 4, 2023Technical Analysis and Outlook:
This week, the price action of the coin remained stagnant between the Outer Coin Dip 28900 and Mean Res 30050 levels. This suggests it might decrease further towards the Outer Coin Dip levels of 28200 and 26900. However, there is also a possibility of a dead-cat rebound towards the Mean Res 30050 level.

RELATIVE HOUSE PRICE INDEXMeasures how expensive or cheap housing is relative to wages.
-Base 100 in 1975
-Volatility clean
-In USD

MACRO MONDAY 5 - Major Market Index XMINYSE Arca Major Market Index - TVC:XMI
The XMI Index is a chart that gets overlooked by many but it is still monitored by OG legacy traders. I recently came across the XMI being utilized by Sentiment Trader in one of their reports, considering that Sentiment Trader provide some of the best metrics in the business, their coverage of the XMI peaked my interest.
The XMI is a price weighted index consisting of 20 blue chip U.S Industrial Stocks, 17 of which are also in the Dow Jones Industrial Average. Within the index there is surprising blend of stocks that include transport, travel, food, pharma, energy and technology. A breakdown of its components can be found at this Trading View link (Will be added to comments below).
The Chart
The long term pattern on the chart is very obviously a rising wedge pattern which presents diagonal resistance above and below. We are currently 7% away from the top diagonal resistance line so this will be an important level in coming weeks and doesn’t leave a lot of room overhead. God forbid if we ever breach the base line of the large wedge.
In the past a 200 week SMA re-test and flattening has predated recessionary/capitulation price action. If we come close to the 200 week SMA again we should be preparing ourselves for that potential outcome.
The XMI made lower highs from Jan 1999 - Sept 2000 providing an advanced 9 month warning of the follow up recession/capitulation price action that initiated from Sept 2000 onwards on the S&P 500. The XMI made lower highs as the EIGHTCAP:SPX500 made higher highs over the 9 month period. The XMI did not provide a similar advance warning for the 2008 Great Recession however, it did make a lower high, which is something we else we can look out for as a weaker warning signal. This is not a concern at present as the XMI has just broke up into new highs.
Its interesting to see how the XMI gave a significant 9 month advance warning of the 2000 Recession but was not as clear cut at providing an advance warning of the 2008 Great Recession. Conversely, the SPDR Homebuilders ETF ( AMEX:XHB ) which we covered in Macro Monday 3 provided an advance warning of the 2008 Great Recession, however was not as clear cut at providing an advance warning of the 2000 Recession. This is because the 2008 Great Recession was mainly a result of high risk mortgage lending which lead to a housing market collapse, whilst the 2000 recession was a tech led crash and general economic slowdown invoked by the Federal reserve who had been increasing rates to quell an overvalued bubbling tech stock market.
We will need to pay separate attention to these individual index charts as we move forward for clues and warnings as we do not know what market or chart will provide us with that ultimate advance warning. In March 2020 it was the Dow Transportation Index DJ:DJT (Macro Monday 1), in 2007 it was the Homebuilders XHB (Macro Monday 3) and in 2000 it was the Major Market Index XMI (See Chart).
MACRO MONDAY 1 - DJT
MACRO MONDAY 3 - XHB
It is worth noting that the current yield curve inversion on the 2/10 year Treasury Spread provided advance warning of recession/capitulation prior to all of the above events 2000, 2007 & 2020 however it provided us a wide 6 - 22 month window of time from the time the yield curve made its first definitive turn back up to the 0% level (See Macro Monday 2). We are 5 months into that 6 – 22 month window and thus closing in on dangerous territory, however the DJT, XHB and XMI charts remain very positive suggesting a longer time horizon is likely on the cards. I hope with the addition of DJT, XHB and XMI we are providing you with additional warning/timing indicators allowing us to hone in on a more specific timeframe, making us better informed and more nimble market participants.
MACRO MONDAY 2 - 2/10 year Treasury Spread
As we continue with Macro Mondays we will continue to cover these and similar leading charts and indicators. At present the yield curve inversion suggests recession is only a matter of time however the DJT, XHB and XMI charts do not have clear warning signals presenting, but when and if they do, we will be able to recognize these signals and position accordingly. Into the 6 – 22 month danger window we go. No guarantees, just probable outcomes.
Stay nimble folks
PUKA

Decision Time For Crude OilLight Crude Oil Futures (CL1!)
- Potential Break out of parallel channel (TBC)
- Above 200 week SMA
- Several bounces off the 200 week
- Long Term Stiff Resistance Overhead
Amazing how compressed price is between the 200 week & overhead resistance. Its like a pressure pot about to spring or roll over.
Turning the overhead resistance into support would be ideal IMO.
I'll be watching and will update if we breach any significant levels.

EUR/USD Daily Chart Analysis For Week of July 28, 2023Technical Analysis and Outlook:
During this week's session, the Eurodollar decreased and reached our Mean Support level at 1.100 and lower, which suggests that it may continue to decline toward the Outer Currency Dip of 1.087. It could also rise and retest the Mean Resistance level at 1.109 to eliminate weak long positions. It's essential to consider this upward movement known as a "dead cat bounce."

S&P 500 Daily Chart Analysis For Week of July 28, 2023Technical Analysis and Outlook:
The Spooz performed as predicted by achieving an Outer Index Rally outcome of 4590 and indicating a desire to move higher. However, the Key Resistance at 4630 might hinder its progress, but it is just a temporary pause. The subsequent Inner Index Rally 4708 is expected to yield positive results.

Bitcoin(BTC/USD) Daily Chart Analysis For Week of July 28, 2023Technical Analysis and Outlook:
This week, the coin's price action fell below our Mean Support level of 29900, indicating that it may continue to decrease towards the next Outer Coin Dip levels of 28200 and 26900. However, a dead-cat rebound toward the Mean Resistance level of 30050 is not ruled out.

Deciphering Divergent Signals The Complex Economic LandscapeThe global economy continues to face profound uncertainties in the wake of COVID-19's massive disruptions. For policymakers and business leaders, making sense of divergent signals on jobs, inflation, and growth remains imperative yet challenging.
In the United States, inflation pressures appear to be moderately easing after surging to 40-year highs in 2022. The annual Consumer Price Index (CPI) declined to 3% in June from the prior peak of 9.1%. Plunging gasoline and used car prices provided some consumer relief, while housing and food costs remained worryingly elevated. Core CPI, excluding food and energy, dipped to 4.8% but persists well above the Fed’s 2% target.
Supply chain improvements, waning pandemic demand spikes, and the strong dollar making imports cheaper all helped cool inflation. However, risks abound that high prices become entrenched with tight labor markets still buoying wages. Major central banks responded with substantial interest rate hikes to reduce demand, but the full economic drag likely remains unseen. Further supply shocks from geopolitics or weather could also reignite commodity inflation. While the direction seems promising, the Fed vows ongoing vigilance and further tightening until inflation durably falls to acceptable levels. The path back to price stability will be bumpy.
Yet even amidst surging inflation, the US labor market showed resilience through 2022. Employers added over 4 million jobs, driving unemployment down to 3.5%, matching pre-pandemic lows. This simultaneous inflation and job growth confounds historical norms where Fed tightening swiftly slows hiring.
Pandemic-era stimulus and savings initially cushioned households from rate hikes, sustaining consumer demand. Early retirements, long COVID disabilities, caregiving needs, and possibly a cultural rethinking of work also constricted labor supply. With fewer jobseekers available, businesses retained and attracted talent by lifting pay, leading to nominal wage growth even outpacing inflation for some months.
However, the labor market's anomalous buoyancy shows growing fragility. Job openings plunged over 20% since March, tech and housing layoffs multiplied, and wage growth decelerated – all signals of softening demand as higher rates bite. Most economists expect outright job losses in coming months as the Fed induces a deliberate recession to conquer inflation.
Outside the US, other economies show similar labor market resilience assisted by generous pandemic supports. But with emergency stimulus now depleted, Europe especially looks vulnerable. Energy and food inflation strain household budgets as rising rates threaten economies already flirting with recession. Surveys show consumer confidence nosediving across European markets. With less policy space, job losses may mount faster overseas if slowdowns worsen.
Meanwhile, Mexico’s economy and currency proved surprisingly robust. Peso strength reflects Mexico’s expanding manufacturing exports, especially autos, amid US attempts to nearshore production and diversify from China reliance. Remittances from Mexican immigrants also reached new highs, supporting domestic demand. However, complex immigration issues continue challenging US-Mexico ties.
The pandemic undoubtedly accelerated pre-existing workforce transformations. Millions older employees permanently retired. Younger cohorts increasingly spurn traditional career ladders, cobbling together gig work and passion projects. Remote technology facilitated this cultural shift toward customized careers and lifestyle priorities.
Many posit these preferences will now permanently reshape labor markets. Employers clinging to old norms of in-office inflexibility may struggle to hire and retain talent, especially younger workers. Tighter immigration restrictions also constrain domestic labor supply. At the same time, automation and artificial intelligence will transform productivity and skills demands.
In this context, labor shortages could linger regardless of economic cycles. If realized, productivity enhancements from technology could support growth with fewer workers. But displacement risks require better policies around skills retraining, portable benefits, and income supports. Individuals must continually gain new capabilities to stay relevant. The days of lifelong stable employer relationships appear gone.
For policymakers, balancing inflation control and labor health presents acute challenges. Achieving a soft landing that curtails price spikes without triggering mass unemployment hardly looks guaranteed. The Fed’s rapid tightening applies tremendous pressure to an economy still experiencing profound demographic, technological, and cultural realignments.
With less room for stimulus, other central banks face even more daunting dilemmas. Premature efforts to rein in inflation could induce deep recessions and lasting scars. But failure to act also risks runaway prices that erode living standards and stability. There are no easy solutions with both scenarios carrying grave consequences.
For business leaders, adjusting to emerging realities in workforce priorities and automation capabilities remains imperative. Companies that embrace flexible work options, prioritize pay equity, and intelligently integrate technologies will gain a competitive edge in accessing skills and talent. But transitions will inevitably be turbulent.
On the whole, the global economy's trajectory looks cloudy. While the inflation fever appears to be modestly breaking, risks of resurgence remain as long as labor markets show tightness. But just as rising prices moderate, the delayed impacts from massive rate hikes threaten to extinguish job growth and demand. For workers, maintaining adaptability and skills development is mandatory to navigate gathering storms. Any Coming downturn may well play out differently than past recessions due to demographic shifts, cultural evolution, and automation. But with debt levels still stretched thin across sectors, the turbulence could yet prove intense. The path forward promises to be volatile and uneven amidst the lingering pandemic aftershocks. Navigating uncertainty remains imperative but challenging.

Inflation vs Innovation Can the Markets Handle the HeatGlobal markets face contradictory forces in 2023. Inflation still simmers as central banks tighten money supply worldwide. Geopolitical friction continues while economic growth likely slows ahead. Yet technological transformation charges ahead, with artificial intelligence poised for explosive improvements. Investors and policymakers must stay nimble in this uncertain environment.
After plunging painfully in 2022, stocks have rebounded with vigor so far this year. This despite raging inflation and the Federal Reserve's hawkish stance on interest rates. Hefty liquidity efforts in China likely buoyed prices. Investors may also have grown too pessimistic amid still-sturdy corporate profits. But sentiment could sour again if supply chain snarls resurface.
In bond markets, yields continue reflecting dreary growth expectations after last year's surge. The inverted yield curve especially screams pessimism on the near-term economy. Meanwhile, the Fed's bond portfolio shrinkage has yet to rattle markets. This implies the Fed's quantitative easing and tightening have limited impact on actual money supply, defying popular perception.
On inflation, early 2023 figures show it easing from 40-year heights but still well above the Fed's 2% bullseye. The Fed remains leery of declaring victory prematurely. Taming inflation sans triggering severe recession is an epic challenge. Geopolitical wild cards like the Russia-Ukraine war that evade the Fed's grasp will shape the outcome.
Amidst these crosscurrents, technological forces advance relentlessly. The frantic digitization around COVID-19 now gives way to even more seismic innovations. The meteoric success of AI like ChatGPT provides a mere glimpse of the transformations coming for healthcare, transportation, customer service and virtually every industry.
The promise appears gargantuan, with AI generating solutions and ideas no human could alone conceive. But the warp-speed pace also carries perils if ethics and safeguards fail to keep up. Mass job destruction and wealth hoarding by Big Tech could ensue absent mitigating policies. But wisely harnessed AI also holds potential to uplift living standards globally.
For investors, AI has already jet-propelled leaders like Google, Microsoft, Nvidia and Amazon powering this tech revolution. But smaller firms wielding these tools may also see jackpot gains, as costs plunge and new opportunities emerge across sectors. That's why non-US and smaller stocks may provide superior opportunities versus overvalued big US tech.
In conclusion, the global economic and financial landscape simmers with familiar threats and novel technological promise. Inflation may moderate but seems unlikely to vanish given lingering supply dysfunction and distortions from massive stimulus. Stocks navigate shifting sentiment amid rising rates and demand doubts. And machine learning progresses rapidly into a future we can now scarcely envision.
Nimbly navigating such turbulence requires flexibility, tech savviness and philosophical courage. Responsibly steering AI's development is a herculean challenge, to maximize benefits and minimize pitfalls. Individuals need to stay skilled while advocating protections against job disruption. Policymakers face wrenching tradeoffs between growth, inflation and financial stability - all compounded by geopolitics.
Yet within uncertainty lies opportunity for those poised to seize it. The future remains ours to shape, if we summon the wisdom and will to guide technology toward enriching human life rather than eroding it. The road ahead will be arduous but need not be hopeless, if compassion and conscience inform our creations.

Macro Monday 4 - Global Net Liquidity and SPX500Global Net Liquidity and SPX 500 Comparison
The Global Net Liquidity (“GNL”) indicator provides an overview of how five major central banks liquidity provisions are collectively performing. This allows us to get a sense of whether global money supply is increasing (expansionary) or decreasing (contractionary).
The GNL can provide a general indication of how much liquid funds are available in Global Bank Reserves. When there is increasing liquidity, lending in all forms to the consumer is less burdensome/restrictive for the Banks and thus consumers typically have access to more finance. If GNL is increasing this can indicate that more money is available to be lent by the Banks and spent by the consumer and businesses, and when GNL is contracting it can indicate less money is circulating and less funds are available for consumers and businesses which can negatively affect overall economic performance.
GNL is available by searching for “Global Net Liquidity” in the indicator section on TradingView. Full credit for the GNL indicator goes to Dharmatech who created/copyrighted this specific indicator on TradingView. There are many Global Liquidity Indicators available on TradingView, some have more banks and metrics included, others less, this is just the one of the main indicators focusing on the big five central banks. I fully intend on making my own Global Net Liquidity Indicator which factors in the other forms of liquidity and other Banks for a more accurate indication. Whilst the impact of smaller global liquidity providers/central banks are less impactful, including them might just offer us an edge week to week.
What is included in this GNL:
We add the following:
- Fed Balance sheet (WALCL)
- Japanese Balance sheet (FRED:JPNASSETS) Converted to USD
- Bank of China Balance Sheet (CNCBBS) Converted to USD
- UK Balance Sheet (GBCBBS) Converted to USD
- EU Balance Sheet (ECBASSET) Converted to USD
And we deduct:
- Reverse Repo Market (RRPONTSYD)
- Treasury General Account (WTREGEN)
The Chart
Please acknowledge that this chart idea has built into it a speculative projection that factors in a number of generalized technical and fundamental considerations/reference points. Lets DIG IN!
1. From a TA perspective we are relying heavily on one data period from 2018 – 2020 on the GNL /S&P500 which is not ideal however a similar pattern from this period may be playing out in an amplified way at present for both.
2. From a general fundamental standpoint we draw a correlation to the Great Inflation period (1965 – 1982) but we hone in on the early years from 1966 – 1973 as these early years are similar to the high inflationary period we find ourselves stepping into at present.
3. In both 1 and 2 above the S&P500 went through significant price volatility which in both instances took the form of a megaphone pattern. Megaphone patterns have been showing up a lot in the market recently, Tesla being a case in point. Megaphone patterns are more common in volatile markets and can offer us traders or investors a structural framework to work within.
Considering 1, 2 and 3 above we speculate that we may see a similar large megaphone pattern play out for the S&P500. This is illustrated in a previously shared chart called “A Crazy S&P Idea”. If you check this idea and hit play, you'll see we are currently tracking the 1966 - 1973 Great Inflation Fractal very closely.
In summary:
o In the past, long term GNL Contraction resulted in significant S&P500 Volatility.
o In 2018 a sudden 8 month sharp 10% GNL decline as the S&P500 was continuing to new highs was an advance warning of a subsequent 14% decline in the S&P500. This is expressed on the chart as a Negative divergence.
o A similar Negative Divergence is currently playing out. As noted the last Negative Divergence in 2018 took 8 months to complete. This would be Aug/Sept 2023 as a possible mid-term top under the current scenario after which we could expect a >10% pullback.
It is important to recognise that the timeframes I am projecting and the price action are patterns that may play out as we find ourselves in similar but not identical circumstances. It is important that we recognise that this pattern may not play out at all. A few things are certain though, Global Net Liquidity is contracting, volatility is expected as a result and the rest is looking into the past for similar patterns to help anticipate potential structures as they evolve. One such pattern which seems plausible is the megaphone, however the S&P500 could be forming a parallel channel here or a different pattern altogether. Time will tell.
If all I have done in the above chart is created awareness of GNL and of the current short term negative divergence, I think that is enough. The rest is just possible outcomes with absolutely no guarantees. I also hope that by reviewing the Great Inflationary Periods price action fractal that it can help frame in our minds just how much price volatility could be ahead of us.
On a recent chart I shared which focused on the Yield Curve Inversion the maximum timeframe for a recession to commence once the yield curve first turns back up towards the 0% level is 22 months. The first definitive turn up was in March 2023 suggesting that the maximum window before a recession could potentially start is 22 months from March 2023 which is January 2025. Never has a recession taken longer than that 22 months to occur after the yield curve makes its first turn back up towards the 0% level. For this reason I have included January 2025 as the potential megaphone top. This also coincides with the megaphone fractal pattern from the Great Inflation Period. I am not saying that this is exactly how it will play out but there is some confluence in the timeframes.
I hope you find these charts and their correlations helpful. It will be fascinating to see how these eventually play out.
PUKA

S&P 500 Daily Chart Analysis For Week of July 21, 2023Technical Analysis and Outlook:
During this week's trading session, Spooz indicated its intention to retest Mean Sup 4507. We anticipate a rebound movement to help us achieve our designated Outer Index Rally 4590 target.

Bitcoin(BTC/USD) Daily Chart Analysis For Week of July 21, 2023Technical Analysis and Outlook:
This week, the coin just churned about our Mean Sup 29900. Any attempt to develop a sustainable upside move is laying on contingency by completing and retesting Mean Sup 28700.

FrogAlgo: USA Economy💥It is important to understand that the US economy represents approximately 25% of the global GDP, despite having just 334 million people, which is around 4.25% of the global population. This context is crucial for comprehending various narratives prevalent in media and politics. Here are a few examples to illustrate this point 🧵:
♦️China, with 1.45 billion people (18.5% of the global population), contributes $18 trillion (18%) to the global GDP.
♦️India, with 1.4 billion people (18% of the global population), generates $3.4 trillion (3%) of the global GDP.
♦️Russia, with 146 million people (1.87% of the global population), produces $2 trillion (1.9%) of the global GDP.
💥When the BRICS nations (Brazil, Russia, India, China, South Africa) are combined, their 3.3 billion people (43% of the global population) contribute $26 trillion (26%) to the global GDP.
💥Despite the large population of the BRICS nations, their economic output barely matches that of the 334 million Americans. However, it would actually be beneficial for the US if the BRICS nations were to increase their GDP. As these 3.3 billion people become wealthier, they would become potential customers for American high-end goods and services. Consequently, the US would see increased profits. It is worth noting that the US dollar would strengthen in such a scenario, considering the 334 million Americans would have significantly more affluent customers to cater to.
💥Comparatively, Russia's 1.9% share of the global GDP pales in comparison to the US's 25% share. This is also true when considering the collective economic power of the 32 NATO member nations or the 50 countries supporting Ukraine. By engaging in actions detrimental to its own economy, such as the annexation of Crimea or involvement in Ukraine, Russia's leadership, under Putin, has effectively committed economic suicide on behalf of its people. This situation has created a humanitarian crisis without any tangible benefits for Russia. Even if Russia were to conquer Ukraine and the former Soviet bloc, the strategy of scorched earth is not conducive to maintaining a healthy and vibrant economy.
💥These examples serve to demonstrate how understanding this piece of information can help individuals better contextualize and discern between the plethora of narratives, whether accurate or unfounded, that circulate constantly in various domains.

S&P 500 Daily Chart Analysis For Week of July 14, 2023Technical Analysis and Outlook:
This week, the Spooz reignited its rally muscle to complete our Inner Index Rally 4521 and is currently processing retracement to Mean Sup 4403 - Unconfirmed. However, there is a solid expectation to march to the Outer Index Rally 4590.

EUR/USD Daily Chart Analysis For Week of July 14, 2023Technical Analysis and Outlook:
This week, the Eurodollar did its Jumpgate performance once again.
It completed our Outer Currency Rally 1.124 and is developing possible pivotal retracement to Mean Sup 1.100. However, the price may jumpstart to Inner Currency Rally 1.133.

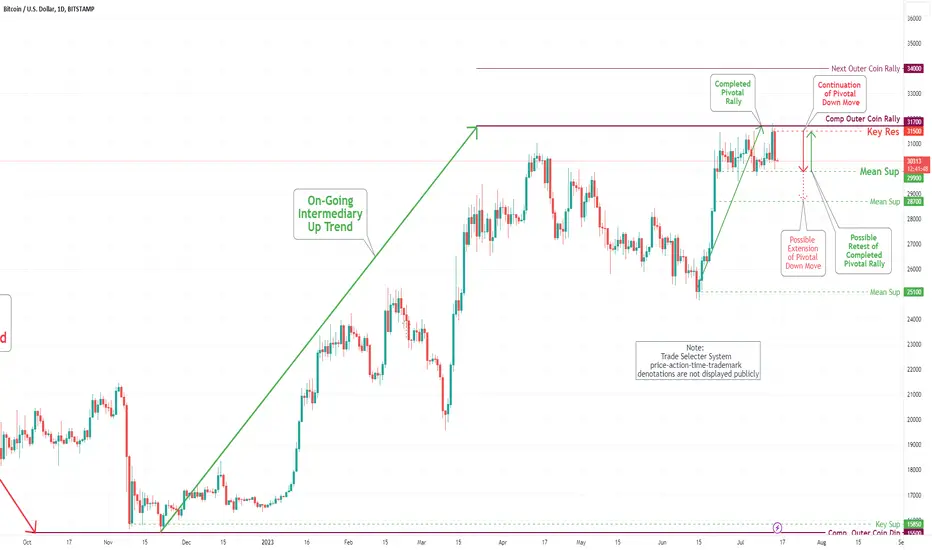
Bitcoin(BTC/USD) Daily Chart Analysis For Week of July 14, 2023Technical Analysis and Outlook:
This week, the coin completed our Outer Coin Rally 31700 and re-traced severely hard to Mean Sup 29900. there's also a chance it will drop significantly to Mean Sup 28700 before recovering. On the upside, the coin might take a swift upward move to retest the completed Outer Coin Rally 31700 and Key Res 31500.
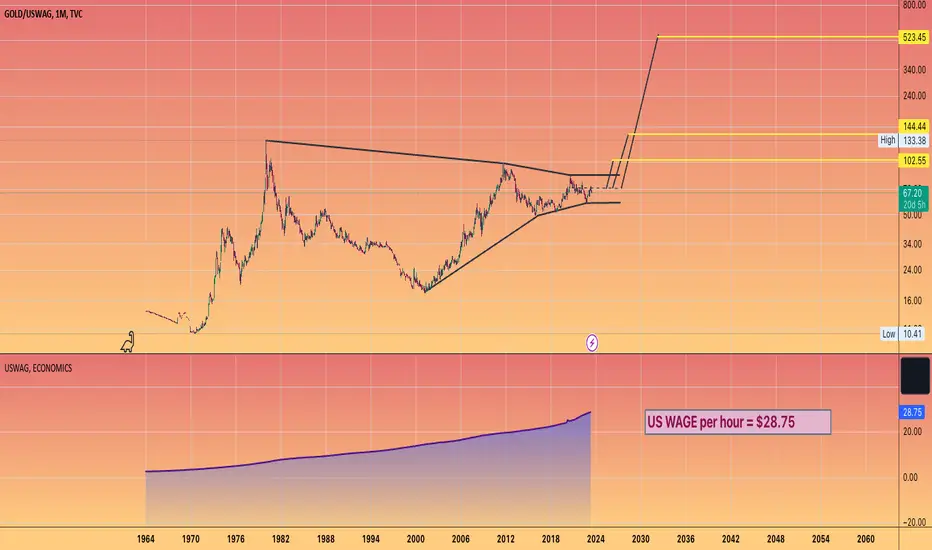
BEFORE 1971 u could acquire 1 #Gold Oz for 10 hours of labourThe erosion of wealth via #fiat debasement is clear for you to see on this chart
With the price of gold denominated us avg salary per hour
* The BLS actually has a higher number of $32 ... but the data on that price has less historical data.
NOW it takes nearly two weeks of labour to acquire 1 oz
(pre tax and living expenses obviously)
But this chart also perilously points how painful the end of US dollar dominance could be.
Pointing to an astronomical level of over 500 hours of work to get one gold ounce.
Clearly adding #PreciousMetals to your portfolio could be one the great wealth builders in the coming years.
Recession Timeframe Horizon Macro Monday (2)
Potential Recession Time Horizon
Below you will find a breakdown of how many months pass before a confirmed Economic Recession (shaded grey areas) after the yield curves first definitive turn back up towards the 0% level:
1) 13 Months (Dec 1978 – Jan 1980)
2) 9 Months (Nov 1980 – July 1981)
3) 16 Months (Mar 1989 – Jul 1990)
4) 12 Months (Mar 2000 – Mar 2001)
5) 22 Months (Feb 2006 – Dec 2007)
6) 6 Months (Aug 2019 – Mar 2020)
7) 4 Months so far (Mar 2023 - ????)
Average Time frame: 13 months (reasonable time horizon would be 6 – 18 months).
I consider the first definitive turn up towards the 0% level as no. 7 on the chart (March 2023). Since this date we have rolled over below the -1% level (see additional chart in comments). March 2023 appears similar to the bounce in Dec 1978 (No. 1 in the chart), it also rolled over to the lower sub -1% level. If we assumed a similar 13 month timeframe to recession commencement as in Dec 1978 of 13 months, which also aligns with our 13 month average above, we would be looking at April 2024 for a recession to commence. Interestingly 1978 - 1980 was a similar peak inflationary period known as the Great Inflation, a defining macroeconomic period of high inflation.
You might be wondering, has a recession ever occurred in the month of April before? I personally thought this was a strange month but it has occurred in the past.
In April 1960 a recession commenced and lasted 10 months to February 1961. The 1960 recession was mainly a result of an over-tight monetary policy whereby the Federal Reserve raised interest rates from 1.75% in mid-1958 to 4% by the end of 1959 and maintained them at that level until June 1960. The Federal Reserves motive for raising interest rates and maintaining them was fear of high inflation (as in early 1951 inflation soared to +9.5%). Is it just me or is this all starting to sound a little too familiar?
If we wanted to cater for all time scenarios in the chart and noted above (no. 1 - 6) we could argue that the start of a recession is possible at the earliest within 6 months (Sept 2023) and at the latest 22 months (Jan 2025). Also, the month of April 2024 has some eerie similarities to two prior recessions, the 1978 and 1960 Recessions.
Lucky 13
Since World War 2 bear markets have on average taken about 13 months to reach their bottom and a further 26 months to recover their losses. Our average time before a recession would start is 13 months. It’s worth remembering that it could take an additional 13 months before a bottom is established and then 2 years or 26 months (2 x 13) of price action below the pre-recession price highs. Over 3 years is a long time to wait to recover losses. It would be pertinent to start deleveraging or increasing your hedge from the 6 month mark (Sept 2023 in this case) as subsequently the likelihood of a 3 year period below the Sept 2023 price levels increase as each month passes. For reference the S&P 500 index has fallen an average of 33% during bear markets over the avg. timeframe of 13 months to the bottom.
I actually find it very hard to accept that a recession is possible in the near term (within 6 - 12 months) and I would in fact argue against it, however I cannot explain away the data in the chart which speaks for itself and warrants at least some consideration & caution. Nothing is a guarantee and maybe this time it will be different, especially factoring in the amount of unprecedented liquidity added to the market in recent years, sticky inflation and financial supports provided to systemically important banks.
All the chart really indicates is a probable window for a recession to start some time between Sept 2023 – Jan 2025 and no guarantees.
The rule of 13 is worth remembering, simply from a timing perspective (before and during a recession) as it may help your timing. Based on two similar periods in history, the 1978 and 1960 recessions suggest the month of April 2024 may be a key date. Again, no guarantees.
It is also worth noting that for the last six recessions, on average, the announcement of when a recession started was up to 8 months after the fact…meaning we will have no direct indication when a recession starts, however the un-inversion of the yield curve (back above the 0% level) and a rise in unemployment will be the early tells, so these are worth paying attention too. We will keep you posted on any sudden changes in these metrics.
I hope the chart is helpful, provides one perspective of which there are many, and can help time and frame the situation we currently find ourselves in. NO GAURANTEES, just probable timeframes that may be worth paying attention too.
PUKA
List of Recessions:
1. COVID-19 Recession (February - April 2020)
2. The Great Recession of 2008 (December 2007 - June 2009)
3. The September 11 Recession (March - November 2001)
4. The Gulf War Recession (July 1990 - March 1991)
5. The Iran/Energy Crisis Recession (July 1981 - November 1982)
6. The Energy Crisis Recession (January - July 1980)
7. The Nixon Recession (December 1969 - November 1970)
8. The “Rolling Adjustment” Recession (April 1960 - February 1961)
9. The Eisenhower Recession (August 1957 - April 1958)
10. The Post-Korean War Recession (July 1953 - May 1954)
