US Unemployment Rising: How Is This NOT a Recession?The U.S. unemployment numbers are steadily climbing, as indicated by recent Bureau of Labor Statistics data. Typically, significant rises in unemployment correlate directly with recessions, which are shaded gray in historical data charts.
Currently, unemployment has reached over 7 million, significantly higher than recent lows. Historically, every similar increase has coincided with or preceded an official recession declaration. Yet, mainstream economic narratives have avoided labeling this a recession.
What does this data tell us, and is the market accurately pricing in the risk? Are we already in a recession, or is this time different?
Share your thoughts below. Let's discuss the disconnect between the unemployment reality and official recession narratives.
Economy

Uncertainty: The Dollar's Unexpected Ally?The recent strengthening of the US dollar (USD) against the Israeli shekel (ILS) serves as a potent illustration of the dollar's enduring role as a safe-haven currency amid heightened geopolitical uncertainty. This trend is particularly pronounced in the context of escalating tensions involving Iran, Israel, and the United States. Investors consistently gravitate towards the perceived stability of the dollar during periods of global unrest, leading to its appreciation against more volatile and susceptible currencies, such as the shekel.
A significant driver of this dollar demand stems from the precarious security landscape in the Middle East. Reports detailing Israel's potential operation into Iran, coupled with the United States' proactive measures like authorizing voluntary departures of military dependents and preparing for a partial evacuation of its Baghdad embassy, signal Washington's anticipation of potential Iranian retaliation. Assertive declarations from Iranian officials, explicitly threatening US military bases and claiming intelligence on Israeli nuclear facilities, further amplify regional risks, compelling investors to seek the dollar's perceived safety.
Compounding this geopolitical volatility is the stalled US-Iran nuclear diplomacy. Hurdles persist not only over core issues, such as uranium enrichment and sanctions relief, but also over the basic scheduling of talks, with both sides expressing diminishing confidence in a resolution. The recent International Atomic Energy Agency (IAEA) Board of Governors meeting, where the US and European allies introduced a non-compliance resolution against Iran, adds another layer of diplomatic tension, threatening increased sanctions or nuclear expansion and reinforcing the perception of a volatile environment that inherently strengthens the dollar.
These escalating tensions have tangible economic repercussions, further fueling investor flight to safety. The immediate aftermath has seen a significant increase in oil prices due to anticipated supply disruptions and a notable depreciation of the Iranian rial against the dollar. Warnings from maritime authorities regarding increased military activity in critical waterways also reflect broad market apprehension. During such periods of instability, capital naturally flows into assets perceived as low-risk, making the US dollar, backed by the world's largest economy and its status as a global reserve currency, the primary beneficiary. This flight-to-safety dynamic during major regional conflicts involving key global players consistently bolsters the dollar's value.

$CNIRYY -China CPI (May/2025)ECONOMICS:CNIRYY
May/2025
source: National Bureau of Statistics of China
- China's consumer prices dropped by 0.1% yoy in May 2025, matching the declines seen in the previous two months and slightly outperforming expectations of a 0.2% decrease.
This was the fourth straight month of consumer deflation, highlighting challenges from ongoing trade risks with the US, sluggish domestic demand, and concerns over job stability. Non-food prices were flat for the second month in a row, as increases in housing (0.1% vs 0.1% in April), clothing (1.5% vs. 1.3%), healthcare (0.3% vs 0.2%), and education (0.9% vs 0.7%) were offset by a sharper drop in transport (-4.3% vs -3.9%).
On the food side, prices fell at a steeper rate (-0.4% vs -0.2%), down for the fourth month.
Core inflation, which excludes volatile food and fuel prices, rose 0.6%, marking the highest reading since January and following a 0.5% gain in the prior two months.
On a monthly basis, the CPI declined by 0.2% in May, reversing a 0.1% gain in April and indicating the third monthly drop so far this year.

Workforce participation is declining, government debt is risingWorkforce participation is declining, government debt is rising. Are we seeing the makings of major military conflicts?
This chart shows two key economic indicators for the U.S. from 2001 to 2025:
- U.S. labor force participation rate: the percentage of the working-age population that is either employed or actively looking for work.
- U.S. government debt as a % of GDP: the ratio of total federal debt to the country’s gross domestic product (GDP), but the scale is flipped - meaning higher debt appears lower on the graph, and vice versa.
What does “government debt as a % of GDP” mean?
This ratio shows how much the government owes relative to the size of the entire economy. If the ratio grows, it means debt is rising faster than the economy. The debt-to-GDP ratio surged sharply after the 2008 crisis and again during the COVID-19 pandemic. By 2024, it reached around 124% and is expected to keep rising. Since the chart uses an inverted scale, the red line drops lower as debt increases.
This graph clearly illustrates an inverse relationship between labor force participation and government debt as a share of GDP:
As workforce participation declines → government debt grows. This pattern is especially visible during major economic shocks like the 2008 crisis and the 2020 pandemic.
Why does this happen?
- Economic downturns: when fewer people are working or job-hunting, economic growth slows, tax revenues fall, and the government tends to borrow more to support the economy and social programs.
- Demographic shifts: as the population ages (e.g, baby boomers retiring), fewer people remain in the labor force. This slows down growth and increases the strain on government programs, which also drives up debt.
- Government policy: during times of crisis, the state often increases spending - and thus borrowing- to support the economy, pushing the debt-to-GDP ratio higher.

$EUINTR - Interest Rates Cut (June/2025)ECONOMICS:EUINTR
(June/2025)
source: European Central Bank
- The ECB cut key interest rates by 25 bps at its June meeting,
based on updated inflation and economic forecasts.
Inflation is near the 2% target, with projections showing 2.0% in 2025 (vs 2.3% previously), 1.6% in 2026 (vs 1.9% previously), and 2.0% in 2027.
Core inflation (excluding energy and food) is seen at 2.4% in 2025, then easing to 1.9% in 2026–2027.
GDP growth is forecast at 0.9% in 2025, 1.1% in 2026 (vs 1.2% previously), and 1.3% in 2027, supported by higher real incomes, strong labour markets, and rising government investment, despite trade policy uncertainties weighing on exports and business investment.
Scenario analysis shows trade tensions could reduce growth and inflation, while resolution could boost both.
Wage growth is still high but slowing, and corporate profits are helping absorb cost pressures.
President Lagarde said that the central bank is approaching the end of a cycle, suggesting a pause may be on the horizon following today’s reduction.

S&P 500 Daily Chart Analysis For Week of June 6, 2025Technical Analysis and Outlook:
The S&P 500 Index has demonstrated an upward trajectory during this week's trading session, surpassing the established Outer Index Rally level of 5955 and the Key Resistance level of 5965. Currently, the index is exhibiting a bullish trend, with a focus on the Outer Index Dip target, set at 6073. Furthermore, additional critical levels have been identified, including Key Resistance at 6150 and the Next Outer Index Rally at 6235. Conversely, there is a potential decline in index prices from the current level or upon completion of the Outer Index Dip 6073, which may lead to a retest of the Mean Support at 5940, with the possibility of extending the pullback to the Mean Support at 5888.

EUR/USD Daily Chart Analysis For Week of June 6, 2025Technical Analysis and Outlook:
During the current trading session, the Eurodollar has exhibited notable volatility, mirroring patterns observed in the previous week. The currency surpassed a significant Mean Resistance level of 1.142 and encountered substantial resistive price action near the crucial Key Resistance level of 1.151. Recent analyses indicate that the Euro is likely to approach the critical Mean Support level at 1.137 and may decline to the subsequent Mean Support level at 1.129. Nevertheless, there exists the possibility of an upward movement from the current level or the Mean Support at 1.137, which could result in a target Mean Resistance of 1.145 and a retest of the Key Resistance at 1.151.

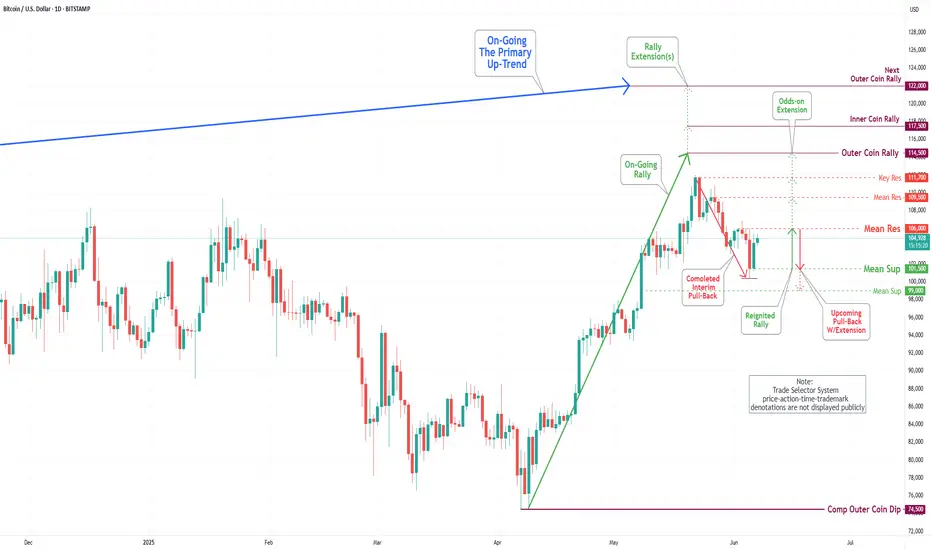
Bitcoin(BTC/USD) Daily Chart Analysis For Week of June 6, 2025Technical Analysis and Outlook:
Bitcoin has experienced a notable downturn throughout the week; however, on Friday, it made a substantial upward movement, effectively recovering all previous losses. It is currently positioned to establish a temporary pause at the Mean Resistance level of $106,000, which may facilitate the development of upward momentum from this point. This situation may pose challenges to achieving the Inner Coin Rally target of $ 114,500, which is contingent upon the Mean Resistance at $ 109,500 and Key Resistance at $ 111,700. It is essential to acknowledge the possibility of a downward pullback from the Mean Resistance level of $106,000, which could result in a decline toward the Mean Support level of $101500.
Can P&G Weather the Economic Storm?Procter & Gamble, a global leader in consumer goods, currently faces significant economic turbulence, exemplified by recent job cuts and a decline in its stock value. The primary catalyst for these challenges stems from the Trump administration's tariff policies, which have directly impacted P&G's supply chain by increasing costs for raw materials and finished goods imported from China. This financial burden, estimated to be hundreds of millions of dollars, compels P&G to reassess sourcing strategies, enhance productivity, and potentially raise product prices, risking a reduction in consumer demand.
In response to these escalating pressures and a noticeable slowdown in category growth rates within the U.S., P&G has initiated a substantial restructuring program. This includes the elimination of up to 7,000 jobs, representing approximately 15% of its non-manufacturing workforce, over the next two years. The company also plans to discontinue sales of certain products in specific markets as part of its broader strategic adjustments. These decisive measures aim to safeguard P&G's long-term financial algorithm, although executives acknowledge they do not alleviate immediate operational hurdles.
Beyond the direct impact of tariffs, a pervasive sense of economic uncertainty and declining consumer confidence in the U.S. further complicates P&G's operating environment. Recent data indicates a sustained drop in consumer sentiment, directly influencing discretionary spending and prompting households to become more cautious with their purchases. This shift, combined with broader negative economic indicators such as rising jobless claims and increased layoffs across various sectors, creates a challenging landscape for companies reliant on robust consumer spending. P&G's immediate future hinges on its strategic agility in mitigating tariff impacts, managing pricing, and adapting to a volatile economic climate.

$EUIRYY - Europe CPI below 2% Target (May/2025)ECONOMICS:EUIRYY 1.9%
May/2025
source: EUROSTAT
- Eurozone CPI eased to 1.9% year-on-year in May 2025,
down from 2.2% in April and below market expectations of 2.0%.
This marks the first time inflation has fallen below the European Central Bank’s 2.0% target since September 2024, reinforcing expectations for a 25 basis point rate cut later this week and raising the possibility of additional cuts.
A key driver of the deceleration was a sharp slowdown in services inflation, which dropped to 3.2% from 4.0% in April, its lowest level since March 2022.
Energy prices continued to decline, falling by 3.6% year-on-year, while inflation for non-energy industrial goods held steady at 0.6%.
In contrast, prices for food, alcohol, and tobacco accelerated, rising 3.3% compared with 3.0% the previous month.
Meanwhile, core inflation, which excludes volatile food and energy components, slipped to 2.3%, the lowest reading since January 2022. source: EUROSTAT

$USPCEPIMC -U.S Core PCE (April/2025)ECONOMICS:USPCEPIMC
April/2025
source: U.S. Bureau of Economic Analysis
-The core PCE price index in the US, which excludes volatile and energy prices and is Federal Reserve's chosen gauge of underlying inflation in the US economy,
went up 0.1% from the previous month in April of 2025.
The result was in line with market expectations.
From the previous year, the index rose by 2.5% to slow from the 2.7% jump from March, the softest increase since March of 2021.

S&P 500 Daily Chart Analysis For Week of May 30, 2025Technical Analysis and Outlook:
The S&P 500 Index has undergone considerable price fluctuations during the trading sessions of this week, successfully reaching a critical target at the Mean Support level of 5800. Presently, the index is exhibiting an upward trend with a focus on the retest of the Inner Index Dip at 5955 and Key Resistance at 5965. Furthermore, additional significant levels have been identified, including the Next#1 Outer Index Rally at 6073, Key Resistance at 6150, and the Next#2 Outer Index Rally at 6235. Conversely, there is a potential for the index prices to downfall aiming to retest Mean Support 5800 and to complete the Outer Index Dip, noted at 5730.

EUR/USD Daily Chart Analysis For Week of May 30, 2025Technical Analysis and Outlook:
The Eurodollar has experienced significant volatility during this week's trading session. It reached a significant Mean Resistance level at 1.142 while also encountering Mean Support at a target of 1.122. Recent analyses suggest that the Euro is likely to revisit the critical target of 1.142, which includes Key Resistance at 1.151 and the completed Outer Currency Rally at 1.157. However, there is a potential for a downward correction from the current level, which could lead to prices retesting the Mean Support of 1.122. There is also a possibility for further declines, reaching the Outer Currency Dip at 1.108.

Bitcoin(BTC/USD) Daily Chart Analysis For Week of May 30, 2025Technical Analysis and Outlook:
Bitcoin has undergone a significant decline during the current week's trading session and is presently situated at the Mean Support level of $103,000. This downward trajectory has the potential to establish a temporary pause, which may facilitate the emergence of upward momentum from this level, and it could pose a challenge to the Key Resistance level at 109500. A successful breach of this resistance may lead to the completion of the Inner Coin Rally target at $114500. However, it is crucial to acknowledge the possibility of renewed downward momentum from the current level, as this could result in a decline toward the Mean Support of 99000.

DR COPPER vs GOLD as a Safe HavenAn enlightening ratio provides additional proof that 2026 is set to be a remarkable year of economic growth, propelling us into the upcoming peak of the #AI cycle.
A key indicator of the AI peak is the initial public offering (IPO) of Open AI on the stock market. This is a definitive signal to capitalise and harvest as much economic energy as possible during the euphoric frenzy, and establish Open AI as a new Tech Titan for the next decade.

S&P 500 Daily Chart Analysis For Week of May 23, 2025Technical Analysis and Outlook:
The S&P 500 Index demonstrated a consistent downward trend during this week's trading session, reaching a significant target at the Mean Support level 5828. The index is currently trending lower, targeting the Inner Index Dip at 5730, with additional marks identified at the Mean Support levels of 5660 and 5600. Conversely, the index has the potential to rebound from its present position, advancing toward the Mean Resistance level of 5860 and retesting the previously completed Outer Index Rally at 5955.

EUR/USD Daily Chart Analysis For Week of May 23, 2025Technical Analysis and Outlook:
The Eurodollar has demonstrated significant strength during this week's trading session, attaining a notable Inner Currency Rally at 1.129 and encountering Mean Resistance at 1.137. Recent analyses indicate that the Euro will likely progress towards the forthcoming target levels, specifically the Mean Resistance at 1.142 and the Key Resistance at 1.151. A retest of the completed Outer Currency Rally at 1.157 may facilitate this advancement. However, a potential downward pullback could emerge from the current price range, particularly in proximity to the Mean Resistance level of 1.137, with a possibility of declining to the Mean Support at 1.127.

Bitcoin(BTC/USD) Daily Chart Analysis For Week of May 23, 2025Technical Analysis and Outlook:
In the course of this week's trading session, Bitcoin demonstrated significant upward movement, surpassing both Mean Resistance at 105000 and Key Resistance at 106100. This progression also facilitated the surpassing completed Inner Coin Rally at 108,000, and the highly anticipated Outer Coin Rally marked at 110000. As a result, the cryptocurrency experienced a substantial decline, currently aiming toward Mean Support at 105600, with a potential further decline toward an additional Mean Support target at 101500.
It is essential to acknowledge the possibility of an upward momentum emerging from the current level, which may enable a challenge to Key Resistance at 111700. Success in this regard could result in reaching the Inner Coin Rally at $114500 and, subsequently, the Outer Coin Rally at 122000.

$JPIRYY -Japan's CPI (April/2025)ECONOMICS:JPIRYY 3.6%
April/2025
source: Ministry of Internal Affairs & Communications
- Japan's annual inflation rate stood at 3.6% in April 2025,
unchanged from March while remaining at its lowest print since December.
Food prices rose the least in four months (6.5% vs 7.4% in March) even as rice costs jumped 94.8% y-o-y, hitting a new record for the 7th straight month due to poor harvests and rising demand from record tourist numbers.
Price growth also eased for clothing (2.7% vs 3.0%) and household items (4.1% vs 4.5%).
Cost of education fell much steeper (-5.6% vs -1.2%).
In contrast, inflation was stable for transport (at 2.7%) while accelerating for housing (1.0% vs 0.8%), healthcare (2.2% vs 2.0%), recreation (2.7% vs 2.0%), communications (1.1% vs 1.0%), and miscellaneous items (1.3% vs 1.1%).
Prices of electricity (13.5% vs 8.7% ) and gas (4.4% vs 2.4%) rose the most in three months, as the impact of government subsidies faded.
Core inflation climbed to an over 2-year high of 3.5% from 3.2% in March.
Monthly, the CPI rose 0.1%, easing from a 0.3% gain in March.

$GBIRYY - U.K Inflation Rate Accelerates (April/2025)ECONOMICS:GBIRYY
April/2025
source: Office for National Statistics
- The annual inflation rate in the UK jumped to 3.5% in April, the highest since January 2024, from 2.6% in March and above forecasts of 3.3%.
The main upward pressure came from higher electricity and gas prices after the Ofgem price cap increase, while new Vehicle Excise Duty on electric cars lifted transport costs, and food inflation also picked up.
Meanwhile, core inflation accelerated to 3.8%, the highest in a year.

S&P 500 Daily Chart Analysis For Week of May 16, 2025Technical Analysis and Outlook:
The S&P 500 Index showed a steady upward trend during this week's trading session, successfully reaching a key target at the Outer Index Rally level of 5955. However, it's important to note the significant downward trend due to letter completion, which could lead to a decline toward the Mean Support level of 5828. Additionally, there is a possibility of further drops to the Mean Support level of 5661. On the other hand, the index may continue to rise from its current level, potentially advancing toward the Inner Currency Rally target set at 6073.

Bitcoin(BTC/USD) Daily Chart Analysis For Week of May 16, 2025Technical Analysis and Outlook:
During this week's trading session, Bitcoin has remained tightly bound within our Mean Resistance level of 104000 and is positioned to retest the lower target identified as Mean Support at 99300. There exists a possibility of a further decline toward an additional Mean Support target at 94000. Nonetheless, it is crucial to recognize the potential for upward momentum from the current level, which may lead to a challenge of the Key Resistance at 106100. This could culminate in a retest of the previously established Inner Coin Rally at $108,000.

$JPGDBQQ -Japan's GDP Shrinks More than Expected (Q1/2025)$JPGDBQQ
Q1/2025
source: Cabinet Office, Japan
- Japan's GDP shrank 0.2% qoq in Q1 of 2025, compared with forecasts of a 0.1% fall and after a 0.6% growth in Q4, flash data showed.
It was the first GDP contraction in a year, amid worries over the impact of US trade policy under President Donald Trump.
On an annualized basis, the economy contracted 0.7%, worse than consensus of a 0.2% drop and a reversal from an upwardly revised 2.4% gain in Q4.
