S&P 500 Daily Chart Analysis For Week of December 2, 2022Technical Analysis and Outlook
Outer Index Rally 4140 is currently in play. The uptrend sentiment might be temporarily restricted by Mean Res 4085 and Mean Res 4110. The downside target to the Mean Sup 3948 is likely once the major rally to the above outcome is completed. The possibility of additional previously specified support levels will emerge - See previous chart analysis postings.
Economy

EUR/USD Daily Chart Analysis For Week of December 2, 2022Technical Analysis and Outlook:
The euro dollar continues to rally onto Mean Res 1.0585 is intact with the possibility of an extension to the Key Res 1.0780. The upcoming prevailing down path is pointing to the new Mean Sup 1.0330. Once the current down sentiment occurs, a furious decline to the previously specified support level will emerge - See previous chart analysis postings.

Bitcoin (BTC/USD) Daily Chart Analysis For Week of Dec 2, 2022Technical Analysis and Outlook:
Bitcoin continuously (Slowly) advancing towards our leading destination of the Mean Res $17,600 and subsequently to the Outer Coin Rally of $19,100. The down-trend retest to Key Sup $15,850 is low at this time, pending the above scenario being played out. The next Outer Coin Dip of $12,400 outcome in the foreseeable future is pending.
Bitcoin and US10Y-US02Y connectionUpdate on US10Y-US02Y
Compare RVGI indicator❌cross and Bitcoin
Still not a cross yet in the extreme area of this indicator that would mark a quite good entry for BTC
But the next cross for a possible Entry point is ahead dear Crypto Nation💥🚀😎
Let me know your thoughts in the comments🤗
⬇️⬇️⬇️
Likes and Follow for updates appreciated🤗
Disclaimer:
Not financial advice
Do your own research before investing
The content shared is for educational purposes only and is my personal opinion

S&P Futures Surprise!We have watched Futures price unable to climb above resistance at 4002.
Today buyers gave strong indication that they were not ready to let price reject and drop form here. Closing the day with strength above 4000.
What can we expect next?
Next target for Futures is 4090 and 4132
If price is able to build above resistance near 4090-4132 we might see a push to 4199 without breaking the Macro Bear structure.

US economy is now collapsing…….The highest point and upcoming Feds meeting are coming next month.
The inflation still ove mr 40 year high , unemployment is increasing , Russia and North Korea teaming up against Ukraine using nuclear weapons.
US economy are now crashing…
This isn’t financial advise. Please save lots of money as possible.
WE ARE IN A RECESSION

S&P 500 Daily Chart Analysis For Week of November 25, 2022Technical Analysis and Outlook
Outer Index Rally 4060's upside target (As shown on Chart Analysis For the Week of November 18) with the additional target is potential #2 Outer Index Rally 4140. The current sentiment is confirmed by the obsoletion of the Mean Res 3995; The downside target to the newly created Mean Sup 3948 is very probable before a major rally to the above outcome. The possibility of extension to Mean Sup 3745 and beyond is delayed in the foreseeable future.

EUR/USD Daily Chart Analysis For Week of November 25, 2022Technical Analysis and Outlook:
Eurodollar declined to our Mean Sup 1.0285 as specified on the EUR/USD Daily Chart Analysis For November 18 chart followed by a rebound to strategic completed and retested Inner Currency Rally 1.0380. The current prevailing down path is pointing to the new Mean Sup 1.0237. The current down sentiment is prone to further declines: Mean Sup 1.014, 1.000, and 0.975. The down-trend projects for the Next Outer Currency Dip of 0.937 is being delayed.

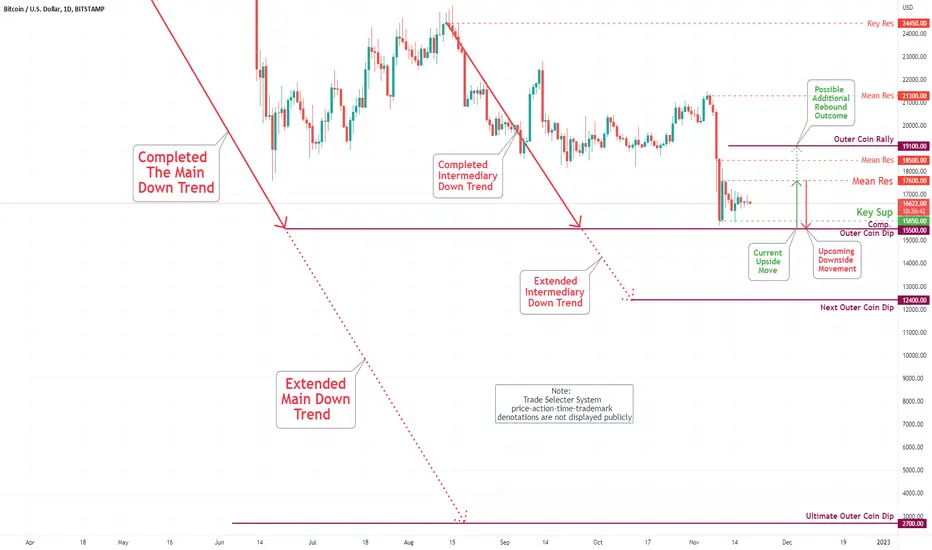
Bitcoin (BTC/USD) Daily Chart Analysis For Week of Nov 25, 2022Technical Analysis and Outlook:
Bitcoin has repeated bounce from our Key Sup $15,850 on Nov 21. The coin is currently positioned to punch to the Mean Res $17,600 and subsequently to Outer Coin Rally $19,100. The down-trend projects for the next Outer Coin Dip of $12,400 in the foreseeable future are being delayed.
What are new-home sales and why do they matter to the economy?Upcoming week we have two important major events happening for the U.S , one of them is the new-home sales. But what exactly are new-home sales, and why do they matter? In this post, we'll break down what new-home sales are and explain why they're so important to the overall health of the economy. You also be more prepared and informed why the market moved in a certain way. Lets move on...
What are new-home sales and why do they matter to the economy?
New-home sales are a measure of trading activity in the market for newly built homes. The new-home sales data are important leading indicators of economic activity, providing timely information on changes in the demand for new homes, which directly affects decisions regarding investment, production, and employment. The data on new-home sales also provide valuable information on the market fundamentals that are shaping trading conditions in the market for newly built homes. The data can be used to inform decision-making about pricing, product mix, and other strategic considerations. In addition, the data can be used to assess market conditions and identify emerging trends. As such, new-home sales data are an important tool for monitoring and understanding the health of the economy.
See historical graph here:
fred.stlouisfed.org
Impact of new-home sales
When new-home sales activity levels rise, it has a positive impact on the economy as a whole. For consumers, this increased activity level leads to currency being put back into circulation. When builders see an increase in new-home sales, they are able to reinvest that currency into building more homes, which in turn provides more jobs for other industry players. The increased activity also has a positive impact on the stock market and it's currency, as builders and other companies who stocks are traded publicly see their stock prices increase. This provides more stability in the markets and can lead to more investors feeling confident about putting their money into the markets. Ultimately, when new-home sales activity levels increase, it provides a boost to the economy as a whole.
New-home sales are an important economic indicator because they signal overall consumer confidence and spending. Increased new-home sales activity levels have a ripple effect throughout the economy, benefiting consumers, builders, and other industry players. We shall see what impact the new-home sales will have this week on EURUSD.
We can currently see we are stuck in a range between support and resistance - let's see what the week will bring.
Trade safe around these hours! Cheers.

Bitcoin in connection to Home Sales 🚨🚨Update:
Bitcoin in connection to Home Sales
We just saw a channel break dear Crypto Nation - last time seen at Corona sell-off🚨🚨
If Home Sales find the way back into the channel BTC might recover as well
Let me know your thoughts in the comments🤗
⬇️⬇️⬇️
Likes and Follow for updates appreciated🤗
Disclaimer:
Not financial advice
Do your own research before investing
The content shared is for educational purposes only and is my personal opinion

S&P 500 Daily Chart Analysis For Week of November 18, 2022Technical Analysis and Outlook
Outer Index Rally 4060's upside target (As shown on Chart Analysis For the Week of November 11) is currently in progress along with potential #2 Outer Index Rally 4140; however, the newly created Mean Res 3995 is in the interim a roadblock. The downside selected target to Mean Sup 3915 is very high once the completion(s) is triggered, with the possibility of extension to Mean Sup 3745 and beyond - in the foreseeable future.

EUR/USD Daily Chart Analysis For Week of November 18, 2022Technical Analysis and Outlook:
Following the strong Eurodollar rebound the previous week, the currency
completed our designated target of the Inner Currency Rally 1.038 this week, as specified on the EUR/USD Daily Chart Analysis For November 11 chart. Since completing the target, the Eurodollar is in retreat mode to Mean Sup 1.0285, potentially followed to a completed Inner Currency Rally of 1.038 retests one more time.
The prevailing down move is prone to pull back to our additional Mean Sup 1.014, 1.000, and 0.975. The down-trend projects for the Next Outer Currency Dip of 0.937 for the foreseeable future is being reignited.

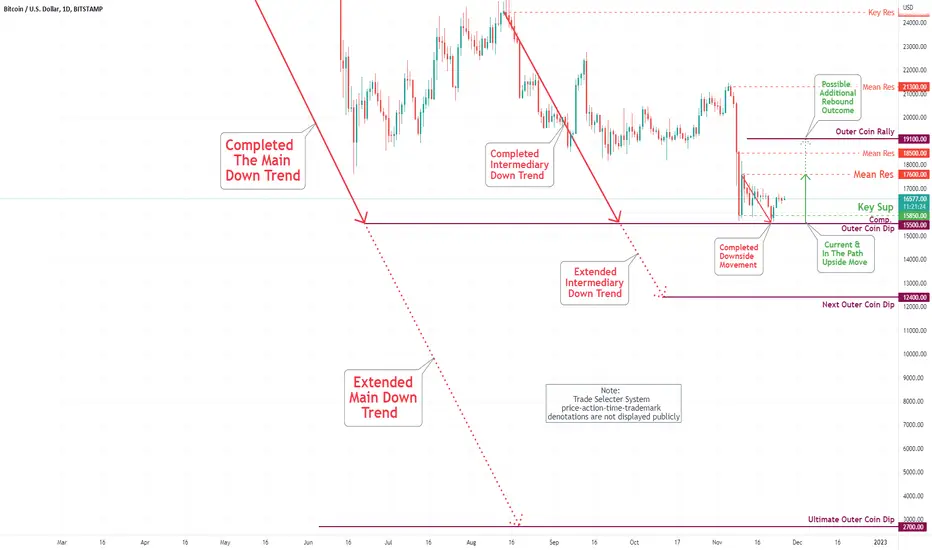
Bitcoin (BTC/USD) Daily Chart Analysis For Week of Nov 18, 2022Technical Analysis and Outlook:
Bitcoin has repeated bounce from our Key Sup $15,850 on Nov 14. The coin is currently positioned itself to hit the Key Sup $15,850 and completed the Outer Coin Dip marked at $15,500, launching sharp upside movement to Mean Res $17,600 and Outer Coin Rally $19,100. The down-trend projects for the next Outer Coin Dip of $12,400 in the foreseeable future is being shelved for now.
Bitcoin and the Philly Fed Manufacturing Indexive 🔴☑️⭐️🟢Bitcoin and the Philly Fed Manufacturing Index
possible bullish scenario when...
1. Index is negative 🔴☑️
2. Index breaks trendline⭐️
3. enjoy the #BTC bull run🟢
Today bad value -19.4 ➡️ more patience necessary🚨
Let me know your thoughts in the comments🤗
⬇️⬇️⬇️
Likes and Follow for updates appreciated🤗
Disclaimer:
Not financial advice
Do your own research before investing
The content shared is for educational purposes only and is my personal opinion

BLUE LINE - Last Support For Crude OilIs this it? Headed into the end of 2023 - are we going to see Crude Oil fall below $76 ppb as COVID & economic concerns trap the global economy into a contraction phase?
My research suggests Crude Oil will attempt to find support near $63 to $65 before attempting to bottom. From current levels, this suggests a -$30 ppb downward price trend is likely.
Two things are likely driving this trend:
Lack of global demand
Inflation/Price concerns
Has the current Flag/Pennant reached the APEX and is price attempting to break downward?
Time will tell...
Follow my research.

S&P 500 Daily Chart Analysis For Week of November 11, 2022Technical Analysis and Outlook
Chart Analysis For the Week of November 4) has been completed, along with two additional rebound stages Mean Res 3900 and Mean Res 3965. Currently, designated upside targets are Outer Index Rally 4060 and 4140, respectively. The downside selected target to Mean Sup 3915 is very high, with the possibility of extension to Mean Sup 3745 and beyond - in the foreseeable future.

EUR/USD Daily Chart Analysis For Week of November 11, 2022Technical Analysis and Outlook:
Eurodollar has rebounded strongly this week since completing our Inner Currency Dip on 26 September - Upcoming target Inner Currency Rally is at 1.038. The prevailing down move is prone to pull back to our Mean Sup 1.000 and beyond in the foreseeable future.

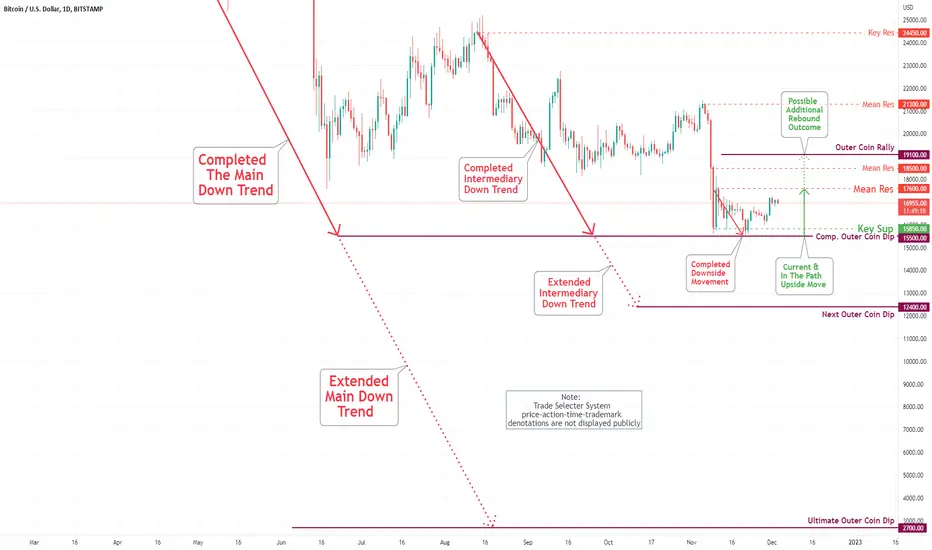
Bitcoin (BTC/USD) Daily Chart Analysis For Week of Nov 11, 2022Technical Analysis and Outlook:
Bitcoin has completed our designated Outer Coin Dip of $15,500, as shown since Bitcoin Daily Chart Analysis For June 17. As a result, a massive rally was staged, creating Mean Res $17,600 launching from Key Sup $15,850 for an upcoming upside move with an additional Outer Coin Rally marked at $19,100. The down-trend projects the next Outer Coin Dip of $12,400 in the foreseeable future.

NDX SPX showing signs of pump coming, very likelyPlease see out $VIX chart right before this
#economy is TRASH
#Fed is not getting #inflation under control nor is raising rates helping
Nothing looks good ANYTIME soon
BUT $NDX looks to be gaining some strength
Can we get a 2k+ pump on #NDX into the end of the year and THEN.......
$SPX shows SIMILAR possibility
#stocks

S&P 500 Daily Chart Analysis For Week of November 4, 2022Technical Analysis and Outlook
The upside target marked at 3975 has been partially completed—the newly created Mean Res 3805 is currently designated as the primary target. Mean Res 3900, Mean Res 3955, and Outer Index Rally 3975 are in the making. Downside target designated to Mean Sup 3715 is very high, with the possibility of extension to Mean Sup 3665 and beyond - in the foreseeable future.

EUR/USD Daily Chart Analysis For Week of November 4, 2022Technical Analysis and Outlook:
Eurodollar has completed the retest of our Mean Res 0.9965 - there is a slight possibility of extending this dead-cat rebound to Mean Res 1.0080. The current down move is prone to pull back to our Mean Sup 0.9895 and beyond in the foreseeable future.

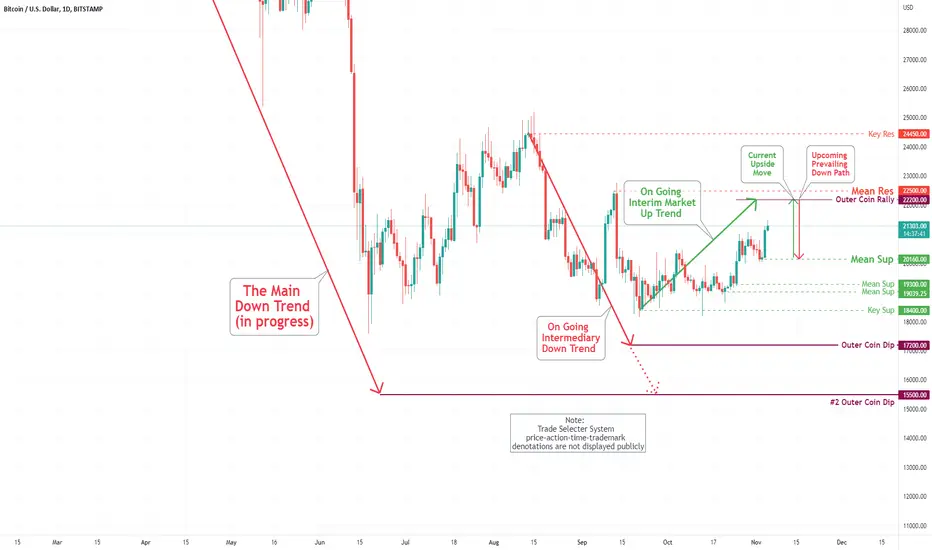
Bitcoin (BTC/USD) Daily Chart Analysis For Week of Nov 4, 2022Technical Analysis and Outlook:
Bitcoin has completed the retest of our Mean Sup $20,300 (As sown on Bitcoin Daily Chart Analysis For the Week of Oct 28) and, as a result, pushed a breakout via Mean Res $20,800 heading towards our designated Outer Coin Rally $22,200 and Mean Res $22,500. The down path shows us a retracement to Mean Sup $21,160 and beyond in the foreseeable future.