Magnificent Seven: Still Magnificent? Or Diverging for Good?The Nasdaq 100 has bounced, but under the surface, the “Magnificent Seven” are no longer marching in sync.
And this divergence matters, especially if you’re trading QQQ or using it as a momentum proxy.
⚔️ Leadership Rotation in Real Time
- Nvidia (NVDA): Still a beast. Making fresh highs, clear institutional momentum.
- Microsoft (MSFT): Quiet strength — not flashy, but technically clean.
- Meta, Amazon: Holding up, consolidating after major runs.
- Apple (AAPL) and Tesla (TSLA): Weak links. AAPL can't find a bid. TSLA is stuck below major resistance.
Trading QQQ directly?
Consider weighting your thesis by what’s working under the hood.
- QQQ reclaimed the 200-day MA with the May 12's gap echoing the broader S&P move.
- Look for a retest of the resistance and the previous high of 540
- Play breakouts with confirmation, or mean-reverting pullbacks.
🧠 Final Take
The Magnificent Seven are splitting into two camps: those still driving the rally, and those dragging it.
Economy

US10 YR Yield Weekly Chart Analysis: NFAUS10 YR Yield Weekly Chart Analysis: NFA
-After sweeping the previous swing high we retraced back to 50% Fib(Equilibrium)
-Expecting this Week's candle wick to sweep Sellside Liquidity-1 and bounce
-If we bounce from here, iFVG-W (red rectangle) will be our resistance zone
-Rejection from that level can send it back to sellside and our next target will be BISI-W(green rectangle)
If any of these Support/Resistance levels are invalidated i will update the idea next week.
**Major economic events can cause drastic moves and invalidate these levels**

$USIRYY - U.S Inflation Rate Unexpectedly Slows (April/2025)ECONOMICS:USIRYY
April/2025
source: U.S. Bureau of Labor Statistics
- The annual inflation rate in the US eased to 2.3% in April, the lowest since February 2021, from 2.4% in March and below forecasts of 2.4%.
Prices of gasoline fell at a faster pace and inflation also slowed for food and transportation.
Compared to the previous month, the CPI rose 0.2%, rebounding from a 0.1% fall in March but below forecasts of 0.3%.
Meanwhile, annual core inflation rate steadied at 2.8% as expected, holding at 2021-lows.

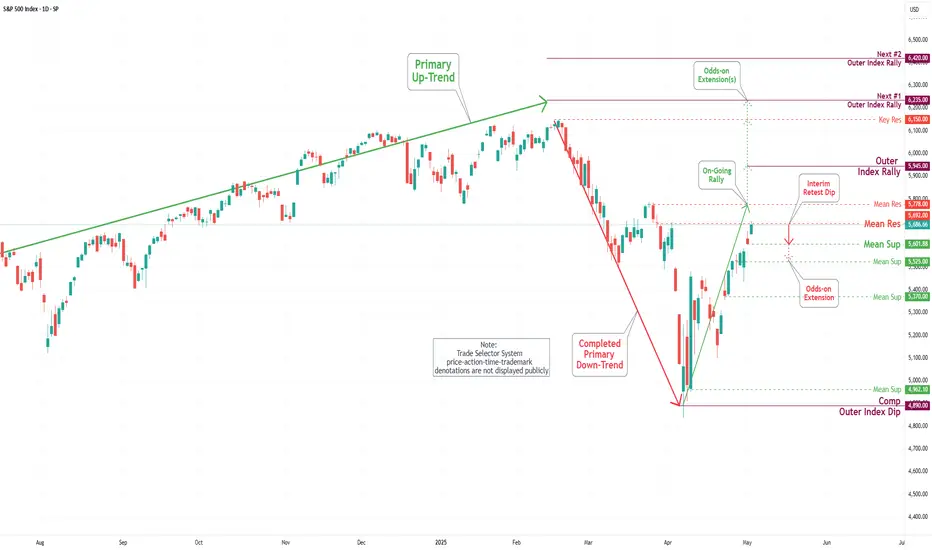
S&P 500 Daily Chart Analysis For Week of May 9, 2025Technical Analysis and Outlook:
In the initial days of this week’s trading session, the S&P 500 Index exhibited a steady to low price movement pattern, successfully achieving a significant target at the Mean Support level of 5601, as indicated in last week’s Daily Chart Analysis. Subsequently, the Index experienced a robust rebound, effectively retesting the Mean Resistance level of 5692. This upward trajectory achievement established a reversal pattern for the downward acceleration to repeat the Mean Support level 5601 retest. However, it is critical to recognize the considerable risk of a sharp upward movement from the current price action, which may lead to an ascent toward the next Mean Support level of 5778. Furthermore, there exists the potential for additional escalation, potentially reaching the Outer Index Rally level of 5915 and beyond.

EUR/USD Daily Chart Analysis For Week of May 9, 2025Technical Analysis and Outlook:
During this week's trading session, the Eurodollar exhibited signs of weakness following a rebound at the Mean Resistance level of 1.137. With decisive, vigorous bearish price activity, the currency pair decisively breached the critical Mean Support level of 1.128. Current market indicators suggest that the Euro will likely close on a Mean Support level of 1.119, moving further towards an Outer Currency Dip at 1.111. However, it is essential to acknowledge that upward dead-cat rebounds may re-emerge at the present price range level.

Bitcoin(BTC/USD) Daily Chart Analysis For Week of May 9, 2025Technical Analysis and Outlook:
Bitcoin leapfrogged our Interim Coin Rally 100000 via Key Res 97500 in this week's trading session and is clearly aiming to retest the next target of completed Inner Coin Rally 108000. Nevertheless, current price movements indicate a potential retracement from Mean Resistance 104000 toward the Mean Support level at 99300, with a further possible decline likely toward an additional Mean Support target at 94000. However, it is imperative to recognize the potential for upward momentum from the current level, as this could facilitate a trajectory toward the Key Res 106100 and the next Interim Coin Rally at $108,000 and beyond.

$GBINTR -BoE Cuts Rates as Expected (May/2025)ECONOMICS:GBINTR
May/2025
source: Bank of England
- The Bank of England cut the Bank Rate by 25 basis points to 4.25%,
matching expectations but revealing a split 5–4 vote.
Two policymakers favored a deeper 50 bps cut, while two others wanted to hold at 4.5%.
It was the fourth cut since August 2024, amid concerns over slowing growth linked to Trump-era tariffs.

$USINTR -Fed Keeps Rates Unchanged (May/2025)ECONOMICS:USINTR
May/2025
source: Federal Reserve
- The Federal Reserve kept the funds rate at 4.25%–4.50% range for a third consecutive meeting as officials adopt a wait-and-see approach amid concerns about the effects of President Trump’s tariffs.
Policymakers noted that uncertainty about the economic outlook has increased further and that the risks of higher unemployment and higher inflation have risen.

S&P 500 Daily Chart Analysis For Week of May 2, 2025Technical Analysis and Outlook:
During this week's trading session, the Index demonstrated a steady to higher price movement, achieving a key target at the Outer Index Rally level of 5550 and successfully surpassing the Mean Resistance level of 5672. This trajectory establishes the foundation for sustained upward momentum as it approaches the Mean Resistance level of 5778 and sets sights on reaching the next Outer Index Rally target marked at 5945. However, it is essential to acknowledge the substantial risk of a sharp retracement from the current price level to the Mean Support level of 5601, with the potential for further decline to the Mean Support level of 5525.
EUR/USD Daily Chart Analysis For Week of May 2, 2025Technical Analysis and Outlook:
The Euro currency has shown weakness in this week's trading session and is resting at the Mean Support designation marked at 1.128. The current trajectory indicates that the Euro is targeted to the downside, with a Mean Support level of 1.119 and an Outert Currency Dip of 1.111. However, it is essential to recognize that upward dead-cat rebounds may re-emerge from the Mean Resistance level or Outer currency Dip.

Bitcoin(BTC/USD) Daily Chart Analysis For Week of May 2, 2025Technical Analysis and Outlook:
Bitcoin prices have significantly exceeded our previously completed Interim Rally 95000, thereby positioning the cryptocurrency to aim for the forthcoming Interim Coin Rally marked at 100000. Nevertheless, current price movements indicate a potential retracement toward the Mean Support level at 94000, with a further possible decline likely toward an additional Mean Support target at 91800. It is imperative to recognize the potential for upward momentum to develop from a retest of either support level, as this could facilitate a trajectory toward the next Interim Coin Rally at $100,000 and beyond.

$JPINTR -BoJ Holds Rates but Cuts GDP Growth Outlook (May/2025)ECONOMICS:JPINTR
May/2025
source: Bank of Japan
-The Bank of Japan (BoJ) kept its key short-term interest rate at 0.5% during its May meeting, in line with expectations.
The unanimous decision came amid growing concerns over the impact of U.S. tariffs.
In its quarterly outlook, the BoJ slashed its FY 2025 GDP growth forecast to 0.5%, from January’s estimate of 1.0%.
The growth outlook for FY 2026 was also lowered to 0.7% from the prior forecast of 1.0%.

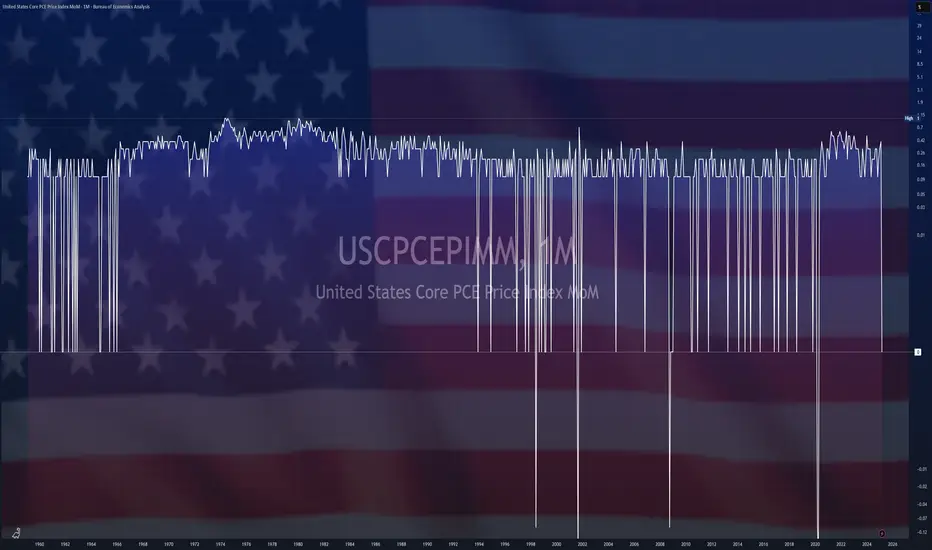
$USPCEPIMC -U.S PCE Inflation Slows as Expected (March/2025)ECONOMICS:USPCEPIMC -U.S PCE Inflation Slows as Expected (March/2025)
ECONOMICS:USPCEPIMC
March/2025
source: U.S. Bureau of Economic Analysis
-The personal consumption expenditure price index in the US was unchanged in March from February 2025, the least in ten months, and following a 0.4% rise in each of the previous two months, in line with expectations.
Prices for goods fell 0.5%, after a 0.2% increase in February and prices for services went up 0.2%, easing from a 0.5% rise.
Meanwhile, the core PCE index, which excludes volatile food and energy prices, was also unchanged, compared with forecasts for a 0.1% increase.
Separately, food prices rose 0.5% (vs a flat reading) while prices for energy goods and services dropped 2.7% (vs 0.1%).
Finally, the annual PCE rate decreased to 2.3%, the lowest in five months, and the annual core PCE inflation also eased to 2.6%.
$USGDPQQ -U.S Economy Unexpectedly Contracts in Q1/2025ECONOMICS:USGDPQQ
Q1/2025
source: U.S. Bureau of Economic Analysis
-U.S economy shrank 0.3% in Q1 2025, the first contraction since Q1 2022,
versus 2.4% growth in Q4 and expectations of 0.3% expansion, as rising trade tensions weighed on the economy.
Net exports cut nearly 5 percentage points from GDP as imports jumped over 40%. Consumer spending rose just 1.8%,
the weakest since mid-2023, while federal government outlays fell 5.1%, the most since Q1 2022.

Weekly Price Action: S&P500 Emini Futures ES1! Tuesday 4/29/2025In this video, we will be looking into the potential price action ES1!.

Weekly Price Action: Dow Jones DJI Tuesday 4/29/2025In this video, we will be looking into the potential price action DJI.

$CNGRES -China's Gold Reserve (Q4/2024)ECONOMICS:CNGRES
Q4/2024
2.280 Tonnes
source: World Gold Council
- Gold Reserves in China increased to 2279.56 Tonnes in the fourth quarter of 2024 from 2264.32 Tonnes in the third quarter of 2024.
Gold Reserves in China averaged 1216.76 Tonnes from 2000 until 2024,
reaching an all time high of 2279.56 Tonnes in the fourth quarter of 2024 and a record low of 395.01 Tonnes in the second quarter of 2000.

S&P 500 Daily Chart Analysis For Week of April 25, 2025Technical Analysis and Outlook:
In this week's trading session, the Index did steady to higher prices, distancing itself from the rendered obsolete Mean Resistance level of 5455 and targeting the next significant mark identified as Outer Index Rally 5550. This trend lays the groundwork for a continued upward movement; however, there is also a considerable risk of a sharp pullback to the Mean Support level of 5370 after reaching the Outer Index Rally at 5550.
Contrariwise, it is essential to acknowledge the possibility of upward momentum continuation resulting in meeting the primary target Outer Index Rally 5550 by challenging the Mean Resistance of 5672 and extending toward additional levels: Mean Resistance 5778 and Outer Index Rally 5945.

EUR/USD Daily Chart Analysis For Week of April 25, 2025Technical Analysis and Outlook:
In the most recent trading session, the Euro successfully retested the completed Outer Currency Rally level at 1.142 and completed the subsequent target identified within the Outer Currency Rally at 1.157. Consequently, the Euro experienced a firm decline to the Mean Support level of 1.131. However, it is essential to recognize that upward momentum may re-emerge, facilitating a retest of the Key Resistance level at 1.151 or potentially leading to a further decline toward the next support level designated as Mean Support at 1.119.

Bitcoin(BTC/USD) Daily Chart Analysis For Week of April 25, 2025Technical Analysis and Outlook:
Bitcoin experienced a significant rally in this week's trading session, breaking through all identified Mean Resistance levels: 86400, 90600, and 94500. This breakout led to the completion of the Interim Coin Rally at 88400. As a result, the newest identified Interim Coin Rally at 95000 has also been completed, indicating a possible pullback to the Mean Support at 92000 and a further decline potential toward an additional Mean Support target at 88500. However, it's important to recognize the chance of upward momentum emerging from a retest of the completed Interim Coin Rally at 95000, which could advance toward the next Interim Coin Rally at 100000.

Possible H&S Forming – It’s All About the News NowOANDA:XAUUSD
📉 Watching closely: Possible Head and Shoulders formation developing on the 4H and 1H charts
As of April 24, 2025, Gold (XAU/USD) is forming a potential Head and Shoulders pattern on the shorter timeframes (4H and 1H), which could indicate a reversal setup. While multiple scenarios are still in play, the price action around the $3368 level will be crucial.
If price fails to break above this resistance in the near term, it could suggest weak bullish momentum and open the door for a pullback toward and possibly below the neckline around $3250 .
🔔 Key Economic Events – April 24
08:30 EDT – Durable Goods Orders MoM
Forecast: +2.0%
Personal outlook: Numbers might come in weaker than forecasted.
Durable goods orders are a solid gauge of industrial demand. Weaker-than-expected numbers would likely weaken the USD and could offer some upside pressure on Gold.
10:00 EDT – Existing Home Sales
Forecast: Lower than previous.
As a key barometer of consumer confidence and economic stability, lower-than-expected figures could also put pressure on the USD, potentially providing Gold a short-term bullish impulse.
📊 Potential Scenarios
Scenario 1 – Bullish Breakout
Weak economic data → USD weakens → Gold spikes above $3400
If both data points disappoint, we could see a rally in Gold, possibly breaking the resistance and invalidating the H&S pattern.
Scenario 2 – Bearish Breakdown (Preferred H&S Scenario)
Strong data → USD strengthens → Gold falls below $3200
While less likely, if economic data comes in stronger than forecasted, Gold could see a significant drop, forming the right shoulder and breaking the neckline – confirming the Head & Shoulders reversal.
Scenario 3 – Sideways Movement
Neutral data + Tariff talks in focus
In the absence of impactful data or if figures come in as expected, Gold might consolidate sideways. Ongoing developments around US-China tariff negotiations could dominate sentiment, delaying or nullifying the H&S pattern entirely.
📉 Market Sentiment Snapshot
US stocks are rallying on optimism around tariff reductions
Trump administration signaling potential easing of China tariffs
➡️ Gold under pressure as risk-on sentiment rises
📍 Conclusion
Keep an eye on the $3368 level and $3250 neckline. Short-term moves will likely be dictated by today’s economic releases and the evolving trade narrative. A confirmed break below the neckline would validate the bearish H&S scenario with potential downside toward $3200 and below.
👉 Stay nimble and trade the reaction, not just the forecast.
-------------------------------------------------------------------------
This is just my personal market idea and not financial advice! 📢 Trading gold and other financial instruments carries risks – only invest what you can afford to lose. Always do your own analysis, use solid risk management, and trade responsibly.
Good luck and safe trading! 🚀📊

S&P 500 Daily Chart Analysis For Week of April 17, 2025Technical Analysis and Outlook:
In the recent shortened trading session, the Index recorded steady to lower prices, distancing itself from the Mean Resistance level of 5455, as indicated in the previous week's Daily Chart analysis. This trend establishes a foundation for continuing the downward trajectory, targeting the Mean Support level 5140. Should this downward momentum persist, further declines may extend to the next Mean Support level of 4970 and ultimately reach the completed Outer Index Dip at 4890.
Conversely, it is essential to acknowledge the possibility of upward momentum at the current price level, which may challenge the Mean Resistance of 5455 and extend toward the Outer Index Rally at 5550.

EUR/USD Daily Chart Analysis For Week of April 18, 2025Technical Analysis and Outlook:
During the current trading session, the Euro has demonstrated a successful pullback to the anticipated support level of 1.128, from which upward momentum has emerged. Consequently, the currency is positioned to retest the previously completed Outer Currency Rally level of 1.142, potentially advancing towards the subsequent target marked next Outer Currency Rally at 1.159. However, it is essential to recognize that there is a possibility of downward momentum re-emerging should the Euro challenge the completed resistance at 1.142 or the forthcoming target of 1.159.
