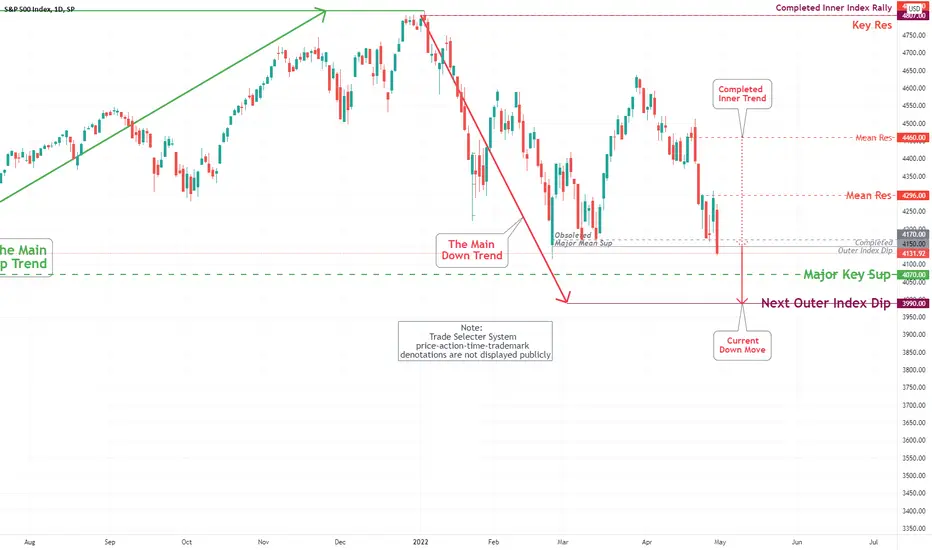
S&P 500 Daily Chart Analysis For April 29, 2022 Technical Analysis and Outlook
The current downtrend is expected to continue to Major Mean Sup 4070 and Next Outer Index Dip 3990. Interim bullish moves are possible within the current downtrend - such as Mean Res 4296.
Economy
EUR/USD Daily Chart Analysis For April 29, 2022Technical Analysis and Outlook:
Inner Currency Dip 1.050 is completed - a bullish move is possible within the current downtrend to Mean Res 1.065. The next down move is Inner Currency Dip 1.031, and the granddaddy of all flagged many moons ago is coming to realization marked at 0.9765.

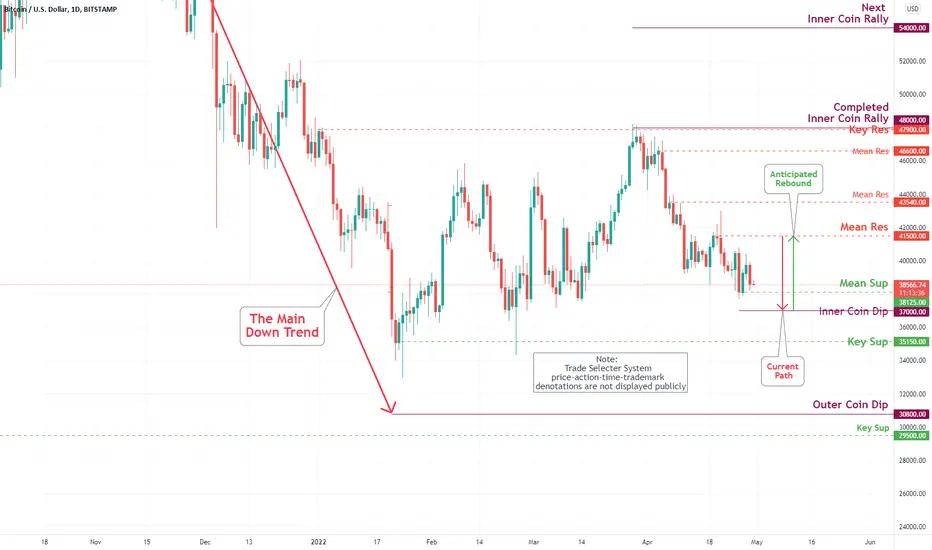
Bitcoin (BTC/USD) Daily Chart Analysis For April 29, 2022Technical Analysis and Outlook:
Bitcoin is getting into a very narrow playing range and is inclined to a significant impulse move to Mean Res $41,500 after completing our Inner Coin Dip of $37,000.
S&P 500 Daily Chart Analysis For April 22, 2022 The current downtrend is expected to continue to Major Mean Sup 4170 and completed Outer Index Dip 4150. Pending verification, the upside move to the newly created Mean Res 4465 is possible within this movement.

EUR/USD Daily Chart Analysis For April 22, 2022After retesting Mean Res 1.089 first time followed through to Mean Res 1.093 was again retested. The stoppage occurred at a solid bottom marked Inner Currency Dip 1.077. A drop to Major Key Sup 1.069 and Next Inner Currency Dip 1.056 is inevitable - to some extent, bullish moves are possible within the current downtrend.

When The music stops we go home. Don't Buy the Dipan hour ago
Disclaimer : this analysis can change at anytime without notice and it is only for the purpose of assisting traders to make independent investments decisions

SPX: Macroeconomic 101It have been months since I have posted an update in TradingView, today I will be discussing 101 of macroeconomics which will help to understand the relationship between Monetary Policy, Cashflow and inflation without making it super complicated.
1- Cashflow:
Big money flow which interest go, as simple and as complicated as it seems. Instead of looking at currencies as purchasing items, we can look at them as exchanging items, for example when you try to buy an car, you are exchanging a car for x amount of USD, and when you are selling the car again, you are exchanging the car for X amount of money.
Big money usually will try to find the highest interest on the currencies they have while considering the risk of safety to get their cash back, when central bank decrease interest rates which mean keeping money in banks will get investors or cash holders less return on their money than before, that is why there will be sale of currencies and buying of commodities/stock/business/investments that is expected to provide a higher return than banks.
2- Monetary policy and Interest rates:
The purpose of interest rates changes are to control inflation rates, low interest rate promote more loans to be taken and less deposits with banks, low interest rate will make the market environment to be more creative in order to create income more than what the interest on loans are, this will help companies to grow and money to cycle in markets more than bonds and deposits. Hence, the less interest rate, the more likely spending increase which as a result prices will grow. This help central banks achieve their objectives or steady growth and maximising employments.
3- Inflation:
When the market get heated and purchasing power is strong, it is normal for the purpose of balancing supply and demand in the market for prices to increase, every sector will be impacted differently. When inflation increase to a level that effect normal average consumer, central banks need to encounter this inflation increase by trying to reduce market activities, this will be done by increasing interest rates, when interest rate increase, money will flow from risky investments to less risky once as they provide a higher interest, which as a result will reduce the activities across economies and will motivate less spendings, spendings will be exchanged with demand on currencies which will increase demand on USD (USD will increase), which in line will make bonds prices to drop (yields to increase). As we are also noticing that FED are trying to reduce QE in markets as to reduce risk of inflation.
When we factor in the current geopolitical matters, I will expect the SPX to continue moving sideways or downside, good opportunity for buying groceries at discounted prices for long term portfolio, I will be a gradual buyer as there is an element of uncertainty related to the countries decisions in regard to economics, globalisation and geopolitics.
Buying great companies at fair price is BETTER than buying cheap companies at great price.
Until next time,
AgentH

All set to double your money?Looks bullish and eager to go higher. It must stay above 32 for its next target of 70. In this market, energy and marine shipping stocks are doing great.

Bitcoin (BTC/USD) Daily Chart Analysis For April 15, 2022Technical Analysis and Outlook:
The bitcoin price experienced its most significant daily drop since February earlier this week and dipped below $40,000 on Monday, posting a low of $39,218; however, failing to fulfill our Inner Coin Dip 39,000 - the completion is anticipated. Bullish activities are possible within this movement.
S&P 500 Daily Chart Analysis For April 15, 2022 Technical Analysis and Outlook
The current downtrend is expected to continue to near-term Inner Index Dip 4337. Pending verification, the upside move to Mean Res 4447 is anticipated - some bullish activities are possible within this movement.

EUR/USD Daily Chart Analysis For April 15, 2022Technical Analysis and Outlook:
After retesting our Mean Res 1.093 and Inner Currency Dip, 1.082 since Monday price action did close lower to complete extended Current Completed Inner Currency Dip 1.077 suggesting a drop to Major Key Sup 1.069, and Next Inner Currency Dip 1.056 - to some extent bullish moves are possible within the current downtrend.

Recession warning on S&P500?The 2-year and 10-year Treasury yields inverted for the first time since 2019 . On Thu Mar 31st , the yield curve showed a possible warning signal that a recession could be happen at anytime, but the curve needs to stay inverted for a substantial amount of time before it gives a valid signal. People get excited about the yield curve because, historically it has been a good predictor of the onset of recession.
Against a backdrop of searing inflation, Russia’s War in Ukraine and a commodity shock, the relentless flattening of the yield curve and its predictive qualities has market watchers on edge.
Goldman Sachs Group Inc. sees the odds of a U.S. recession as high as 35% in the next year, while Grant Thornton’s Diane Swonk sees the twin blow of Fed tightening and higher oil prices potentially tipping the economy into a recession. The yield curve may serve Economists more than Investors, the key factor in the yield curve inversion is that, while it can often forecast darker days ahead for the economy, it is NOT a sell signal for those who invest in stocks

S&P 500 Daily Chart Analysis For April 8, 2022 Technical Analysis and Outlook
The current downtrend is interrupted with a mini-trend to Mean Res 4581 - some bearish moves are possible within this movement. The Near-term outlook is to complete Inner Index Dip 4337.

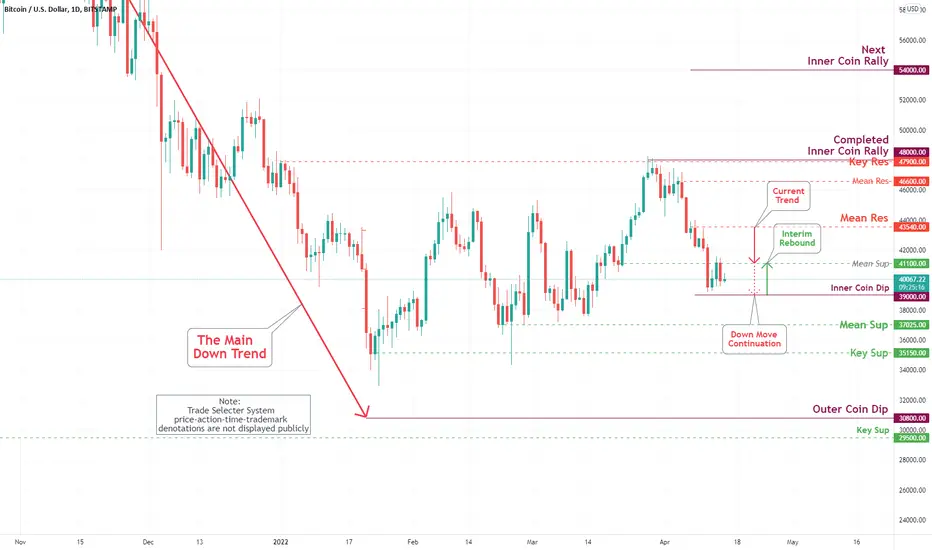
Bitcoin (BTC/USD) Daily Chart Analysis For April 8, 2022Technical Analysis and Outlook:
After embarking on a Key Res at $47,900 retest this month, Bitcoin has punctured coin sentiment by sliding into a direction to Mean Sup $41,100. After follow-thru to Inner Coin Dip, $39,000 is a high probability. Interim rebound to Mean Res $43,540 is also in play.

EUR/USD Daily Chart Analysis For April 8, 2022Technical Analysis and Outlook:
After the retest of our Key Sup 1.085, the Eurodollar is bound to rebound to Mean Res 1.093 and Mean Res 1.098 - some bearish moves are possible within the current uptrend.

4-8th April Economic Outlook!Hey traders,
Today we're going to be looking through this weeks economic calendar. We're going to look at what data is going to be released and what really is going to be affecting the market. I will also share my bias on the different pairs and the different data being released to see if any of these are going to be tradeable or whether or not we should just kind of stay out of the market during these times of uncertainty. I hope you enjoy this outlook into the week ahead. It's going to be a quiet week compared to recent times unless we get any breaking news coming out of Russia and Ukraine. In terms of economic data releases, it is going to be a little bit quieter than usual.
Monday - 4th April
We don't have too much happening in our favor on Monday. Here the biggest release is the unemployment change for Spain. While it may move the euro just a little bit, I'm not seeing a whole lot of tradeable opportunity. I think Monday is going to be a lot better just to kind of sit back and watch to see what happens.
Tuesday - 5th April
On Tuesday, we get a little bit more exciting. We have a fair bit of data being released for us.
🟨 AIG Construction Index
Early in the morning we have the AUD, AIG construction index. This index indicates how well the construction industry is actually running at the moment, it's not something we're going to trade, but rather it's good insight as looking ahead into the PMI, into our employment rates and then overall trade balance in the future. It is a good indication of how well the economy is running confined into that construction sector as it is a very large employer in Australia.
🟥 Cash Rate
Coming in a little bit later in the day, we have a very large, definitely tradeable event with the RBA rate statement and their overall cash rate. The forecast is for it to remain at 0.10%. I believe this will remain at 0.10%. I'm not expecting any shock announcements. However, in the event we do get a shock number come through, it's going to be a very volatile time and a possible opportunity to be able to catch a lot of pips on the Aussie dollar. If we do get a shock event on this, it will move for a few hours prior to entering into the European market so keep an eye on this release.
⬜ EUR
Looking ahead, we do get a lot of services PMI coming out for the euro, but not really looking to be trading that. I'd rather use that as an indication of how well the economy is running, looking ahead into future releases.
🟥 ISM Services PMI
The biggest standout is the ISM services PMI for the US dollar. Obviously the market is forecasting growth in the services industry. I'm not too sure how well that's going to stand. It's not something I usually trade. However, given the previous data releases, I'm unsure if it's going to be able to maintain its bullish forecast. We've been told that construction spending is down, the manufacturing PMI, while still expanding has slower growth than what it was first anticipated. Our nonfarm employment change was negative. There's a lot of different areas suggesting that we may not be as hawkish as what the forecast says. So I do expect this to come in a little less than what we're looking at currently but only time will tell.
Wednesday - 6th April
🟧 Crude Oil Inventories
This is going to be an interesting one. This is something I've been looking to try to look to how it affects the US dollar, but rather something I'm just overly intrigued about given the current circumstances in the world.
🟥 FOMC Meeting Minutes
FOMC meeting minutes is always volatile one. it is good to have a look through what the meeting discussed and how it went on. For users that don't know how this affects the market FOMC meeting minutes is a detailed record of the FOMC's most recent meeting, providing in-depth insights into the economic and financial conditions that influenced their vote on where to set interest rates.
Thursday - 7th April
🟨 AIG Service Index
Another AUD index release. We have the construction index earlier in the week, now we have the services index coming out. Once again it's not something I trade, however, it is fantastic insight into retail sales data. When we do get those retail sales announced next week, we can use this services index to give us a pivotal action point on where those retail sales are aiming, which is why I've noticed that in today's economic calendar, it's worth noting because we can make a preemptive play on the retail sales data release.
🟨 Retail Sales
The Euro retail sales expecting a little bit of an increase with the overall potential panic buying happening across Europe. It's going to be interesting to see what happens here. We massively missed the forecast in March. However, it is looking like they've been a little bit bearish while still forecasting growth of 0.6%. Banks are no longer aiming for the real high numbers, I think we're going to come in maybe around 1%, but I'm not putting money on that prediction, it is rather an assumption. I will have to do some more research and I recommend you do you same as well, having the services PMI come through this week from all the different countries within Europe is going to be a great insight into how well the economy is actually performing on the retail sales front.
Friday - 8th April
Nothing worth mentioning on Friday, the week is going to come to a slow stop. As I said, it is a bit of a slow week this week, only a few different data points worth noting, so we will end the week quite quiet. Obviously, we might have a bit more movement on the fundamental side of things next week but this week looks like it's lining to be a great technical analysis trading week. Always keep your eye on the whole Russia and Ukraine situation because anything can happen there and the market will react accordingly. Do keep your news streams live and in depth as you don't want to be caught off guard by anything going on over there.
These are personally just my outlooks having a look into the future week. Do note the data to keep an eye on when they are released and of course you can use the TradingView calendar as well to keep note on that. Have a fantastic trading week, I wish you all the best success.
