Mechanical rangesMany traders will talk about things like "Smart Money Concepts" (SMC) and think they have found something new.
The truth is, everything in trading stems back to Liquidity.
There is no "Algo" nobody is out to get you specifically. The market is always right, where you position yourself is your own choice.
I have written several posts on mechanical trading, recorded a number of streams. The more mechanical you can make the process, the less the emotions have a chance to kick your ass.
Let me give you a very simple method of being able to identify the ranges. Ignore the timeframes as this will work on any of them, on most instruments. (I say most, as some behave differently due to how it attracts liquidity). Lets assume high end crypto such as Bitcoin (BTC) and of course Forex in the general sense, stocks, commodities etc.
This is simple - only 2 rules.
You start by zooming out and giving yourself a general feel for the trend.
Let's say this looks to be an uptrend - we now need to understand the rules.
An opposing candle can simply be defined by a different colour. If the trend is up (Green) and we see a red candle - then it's an opposing candle.
The inverse is true, if we are down and the trend is Red. Then a Green candle would be opposing.
This is only half of the story. The second rule is a pullback candle or even a sequence of candles. This simply means either the very same opposing candle that doesn't make a new high or low (depending on the trend up not making fresh highs or down not taking new lows).
In this image, you can see we have in one candle both an opposing and pullback in one candle. This means we can now mark the high of the range. Working backwards to identify the swing range low.
This easy method means I can draw a range exactly the same and mechanically every single time.
Giving me a mechanical range.
We could then get a lot more technical by looking for liquidity, 50% of the range or places such as supply or demand areas.
But these are all for other posts.
For now, getting a range on the higher timeframes means you can work down and down into a timeframe you are likely to want to trade on.
These ranges will give clues to draws and runs of liquidity.
This will also help identify changes in the character and fresh breaks of structure.
Here's another post I posted on the mechanical structures and techniques.
More in the next post.
Have a great week!
Disclaimer
This idea does not constitute as financial advice. It is for educational purposes only, our principal trader has over 25 years' experience in stocks, ETF's, and Forex. Hence each trade setup might have different hold times, entry or exit conditions, and will vary from the post/idea shared here. You can use the information from this post to make your own trading plan for the instrument discussed. Trading carries a risk; a high percentage of retail traders lose money. Please keep this in mind when entering any trade. Stay safe.
Community ideas

Tesla Rolls Out Much-Awaited Robotaxis. Buy or Sell the Stock?They’re here. After years of tweets, teasers, and timelines that aged like unrefrigerated dairy, Tesla NASDAQ:TSLA officially launched its long-awaited robotaxi service in Austin, Texas.
The self-driving revolution, we were told, would arrive like a lightning bolt. Instead, it quietly rolled up to the curb with a safety monitor riding shotgun.
On Sunday, ( as promised ) a small, highly curated fleet of Teslas — fully driverless, but not entirely unsupervised — began picking up paying passengers in an isolated section of Austin. CEO Elon Musk, as usual, led the cheer squad, declaring victory on X.
“Super congratulations to the Tesla AI software and chip design teams on a successful robotaxi launch!! Both the AI chip and software teams were built from scratch within Tesla.”
Investors, naturally, perked up. Tesla shares edged higher by more than 5% Monday morning as Wall Street tried to figure out whether this was the long-awaited catalyst for another rally… or just another “sell-the-news” moment that fizzles as quickly as the hype fades.
🔔 The Soft Launch Heard Around The Internet
Let’s not get carried away. This wasn’t a citywide revolution. Tesla’s launch was extremely limited — more of a PR exercise than a true market rollout. Only a handful of Teslas were involved, operating in a tightly controlled, geofenced area.
The riders? Carefully selected influencers, many of whom were more excited to film TikToks than analyze technical driving capability. In other words, this wasn’t exactly New York City rush-hour stress testing.
The rides cost a flat fee of $4.20, because, of course they did. And while the cars drove themselves, safety monitors sat in the front passenger seats — a very human reminder that the project is still very much in beta mode.
The bigger question for investors: Does this prove Tesla’s technology is ready for prime time? Or is it simply an appetizer served years before the main course?
📈 The Market Reaction: Buy the Rumor, Sell the Launch?
Here’s where things get tricky for traders.
The stock market, as always, is forward-looking. Tesla stock didn’t just wake up bullish on Monday because of a few rides in Austin — it’s been rallying for months because of the promise of robotaxis.
Since Tesla’s big October 10 robotaxi event — where Musk laid out plans to launch a self-driving cab service in 2025 — shares have climbed roughly 35%. Much of that gain is already baked into expectations for Tesla finally delivering on what Musk has been promising since at least 2016.
Now that the product is technically “live,” even in tiny demo form, some traders are wondering: is this the start of an even bigger rally?
The answer probably depends on how fast Tesla can scale. And that’s where reality gets stickier.
🤔 The Scaling Problem: A Long Road Ahead
As exciting as Sunday’s launch may have been for influencers and Tesla superfans, it’s not exactly proof of scalability. Deploying 10 carefully monitored cars in a tiny slice of Austin is one thing; blanketing entire metro areas, or states, or countries is another beast entirely.
Tesla’s AI software may be improving, and its in-house chip design gives it some vertical integration advantages. But scaling fully autonomous fleets will require navigating a minefield of regulatory, safety, and logistical challenges — not to mention stiff competition.
Alphabet’s Waymo is already operating robotaxi services in Phoenix, San Francisco, and Los Angeles, with years of public road testing under its belt. Cruise (General Motors) ran its own driverless service before recently pausing operations after high-profile safety incidents. The technology arms race is fierce — and far from settled.
Industry experts continue to caution that mass-market robotaxis may take years — if not decades — to fully materialize. And while Tesla loves to move fast and break things, cities, regulators, and insurance companies tend to prefer a bit more caution when thousands of driverless vehicles are involved.
📝 What’s Actually Priced Into Tesla Stock?
Here’s where this gets existential for Tesla bulls.
A huge chunk of Tesla’s market valuation — some would argue most of it — now rests on the idea that it isn’t just a car company. It’s an AI company. A software company. A robotics company. A future robotaxi empire. If those narratives start to weaken, so does the multiple.
Tesla remains dominant in EV production and it still benefits from profit margins (about half of the profits coming from selling regulatory credits to other carmakers). But even Musk himself has made clear that Tesla’s long-term valuation depends heavily on successfully delivering robotaxis and humanoid robots.
If Sunday’s soft launch is the start of something truly scalable, then maybe the valuation holds up. If it stalls — either due to regulatory hurdles, technological ceilings, or public skepticism — the market may need to reevaluate just how much of Tesla’s price reflects reality versus dreams.
👀 Bottom Line: Revolutionary or Just Another Test Ride?
So, should you buy or sell Tesla after its long-awaited robotaxi debut?
That depends on how you frame this moment. The bulls see a trillion-dollar industry being born, with Tesla perfectly positioned. The bears see a carefully staged PR event masking how far away true autonomy still is.
For now, Tesla gets credit for being bold — even if it’s bold enough to roll out a very small, very managed test.
But markets eventually ask: “What’s next?” And unless Tesla can quickly scale from 10 cars in Austin to fully functioning fleets in major cities, a victory lap here could feel a little premature.
As always with Tesla: the story is thrilling, the stock is volatile, and the future is still very much under construction.
And with its earnings just around the corner — you’re following the earnings calendar , right? — things might just be getting exciting.
Off to you : Which side are on? The bullish traders looking to add to their long positions or the bearish sellers who’ve been calling “overvalued” for years? Share your thoughts in the comments!

Will Nike’s Upcoming Earnings ‘Just Do It’ for Investors?This hasn’t been the greatest year for Nike NYSE:NKE , which will report earnings next Thursday at a time when the stock is down more than 20% year to date. What does technical and fundamental analysis say might happen to the stock from here?
Let’s take a look:
Nike’s Fundamental Analysis
NKE ended Wednesday down 21.4% year to date, and last year wasn't so hot for the athletic-gear giant, either. Shares fell 30.3% over 2024 as a whole.
In fact, it’s been a tough decade so far for Nike, a one-time Wall Street darling.
All in, the stock has fallen some 66.8% since peaking at $179.10 in November 2021. Gross.
Things got so bad that former CEO John Donahoe "retired" in October 2024 -- a retirement that the firm’s board graciously “agreed” to.
The board then pulled in Nike veteran Elliott Hill, who had retired in 2020 after 32 years with the firm, off of the bench to serve as the company’s new CEO.
While it's still early, Hill hasn’t worked much magic so far for the stock, either.
Nike shares have struggled since March, when the firm beat analyst expectations for its fiscal Q3 earnings and revenues but provided poorly received forward guidance.
As for next week’s fiscal Q4 results, the Street is looking for NKE to report just $0.11 of GAAP earning per share on roughly $10.7 billion of revenue.
That would compare badly to the $0.99 of EPS on $12.6 billion of revenues that Nike saw in the same period last year -- an 88.9% decline in earnings per share and about a 15% drop in sales.
In fact, of the 23 sell-side analysts that I’ve found that track the stock, 21 have revised their fiscal Q4 earnings estimates lower since the quarter began. Only two have moved their forecasts to the upside.
Nike’s Technical Analysis
Now let's take a look at NKE’s chart going back some four months:
Readers will see that from early April through mid-June, Nike developed a so-called “rising-wedge” pattern of bearish reversal, marked with purple shading and a red box in the chart above.
Late last week, shares broke through the wedge’s lower trend line at about $62, which is the pivot point here.
Nike also recently gave up its 21-day Exponential Average (or “EMA,” marked with a green line above). That’s likely turned some swing traders against the stock for now.
The stock will now have to look to its 50-day Simple Moving Average (or “SMA,” denoted above with a blue line) for support. That’s at $59.50 in the chart above, but NKE was trading at $59.51 on Friday afternoon as I wrote this.
Should that line crack as well, a certain percentage of portfolio managers would likely have their risk managers force them to reduce long-side exposure to the stock.
But interestingly, readers will also note that from Nike’s late-February high to its early April low, shares hit resistance at the 38.2% Fibonacci retracement level of that move twice -- first in mid-May and then again a month later. This typically implies that there are probably institutional sellers at that level.
Looking at NKE’s other technical indicators, the stock’s Relative Strength Index (the gray line at the chart’s top) is on the weak side of neutral here. It’s not awful, but it also isn’t positive.
Worse, Nike’s daily Moving Average Convergence Divergence indicator (or “MACD,” marked with blue bars and black and gold lines at the chart’s bottom) is postured quite bearishly.
Within that indicator, the 9-day EMA (the blue bars) stands below zero, while the 12-day EMA (the black line) has crossed below the 26-day EMA (the gold line). Those are all typically negative technical signals for a stock.
(Moomoo Technologies Inc. Markets Commentator Stephen “Sarge” Guilfoyle had no position in NKE at the time of writing this column.)
This article discusses technical analysis, other approaches, including fundamental analysis, may offer very different views. The examples provided are for illustrative purposes only and are not intended to be reflective of the results you can expect to achieve. Specific security charts used are for illustrative purposes only and are not a recommendation, offer to sell, or a solicitation of an offer to buy any security. Past investment performance does not indicate or guarantee future success. Returns will vary, and all investments carry risks, including loss of principal. This content is also not a research report and is not intended to serve as the basis for any investment decision. The information contained in this article does not purport to be a complete description of the securities, markets, or developments referred to in this material. Moomoo and its affiliates make no representation or warranty as to the article's adequacy, completeness, accuracy or timeliness for any particular purpose of the above content. Furthermore, there is no guarantee that any statements, estimates, price targets, opinions or forecasts provided herein will prove to be correct.
Moomoo is a financial information and trading app offered by Moomoo Technologies Inc. In the U.S., investment products and services on Moomoo are offered by Moomoo Financial Inc., Member FINRA/SIPC.
TradingView is an independent third party not affiliated with Moomoo Financial Inc., Moomoo Technologies Inc., or its affiliates. Moomoo Financial Inc. and its affiliates do not endorse, represent or warrant the completeness and accuracy of the data and information available on the TradingView platform and are not responsible for any services provided by the third-party platform.

Is Alt season dead? - June 2025Let me start by saying, Youtube influencers are lying to you. The collective narrative (from those links shared with me) talk almost exclusively about the same set of narratives for triggering “alt season”:
M2 money supply. The printer will be turned on any minute.
The FED is going to cut rates, the market will then explode.
Institutions are buying the dip! “Blackrock fills Ethereum long positions” etc
A dollar collapse.
The real season begins in 2026, stack now!
It is the same rubbish time and time again. Rarely will one of those influencers << Look left << to tell you the News as it is written on the chart.
Let me tell you the News…
The highly anticipated "alt season," where alternative cryptocurrencies (alt coins) significantly outperform Bitcoin, faces considerable challenges to deliver the much awaited “alt season” where everything blows up. However I’ve long argued those days are behind us, we’re not going to see an “alt season” again, at least not in the sense many understand the term "alt season".
Alt season refers mainly to those tokens that reside outside the top ten crypto tokens. The total market cap of this cohort outside the top 10 is referred to as INDEX:OTHERS total, as is shown in the main chart. Now I’ve long argued corrections for Ethereum to $700 and below, Litecoin to $20 and lower, generally legacy tokens should perform the worst during this bull market, that outlook does not change.
Why so pessimistic?
Headline 1 - Support and resistance
It is that simple. look left. Each alt season closed a monthly candle above the monthly 7 SMA and monthly 10 SMA (Green areas) before getting underway. Not only has this not happened during this bull market, support from the rising channel has failed and if the current monthly candle closes as it (in 7 days), then past support shall confirm as resistance. This would mean a collapse back to the 2017 market top of circa $50 billion.
Headline 2 - Bitcoin halving
The truth is “alt season” began in May 2024, that is if you’re a believer in the halving cycles. If you’re a believer then you must accept this bull market comes to an end in 90 days.
The orange vertical lines represent each Bitcoin halving, occurring in August 2016, June 2020, and lately May 2024. The so called “alt season” would follow the halving for a 518 day period. There is only 90 days left for alt tokens to do their stuff before this cycle comes to an end. However, influencers only seem to talk about how great 2026 is going to be and how now is the time to start stacking. Instead 2025 is really going to create a whole new number of bag holders of dead projects.
Headline 3 - The number of circulating tokens
In January 2017 there was 8885 tokens, the good ole days.
June 2020, still only 19,500 tokens
Fast forward to June 2025 and we have 17.45 million tokens. Utterly ridiculous.
The sheer proliferation of alt coins, now numbering in the millions, creates an overwhelming supply that far outstrips demand. This fragmentation of liquidity means that even when some tokens see brief pumps, it's often selective with only a handful of projects having strong narratives or specific utility that truly thrive.
The simple truth is the market must kill off millions of those dud projects to free liquidity to the few that matter. If you really must know where the money is going to come from that causes growth in the remaining winners, it is from the realisation that a number of those projects are dead. That includes projects such as Ethereum and Litecoin. Both those charts share an important distinction no one wants to talk or hear about.
There are projects out there that’ll buck the trend, do you know which ones they are?
Not everything will collapse to zero.
Ww

Bitcoin Long: Going for Final Wave 5 of 5Bitcoin has hit the previous target and even breached lower. Now I believe the time has come to go long again with the stop just below recent low of around $98,500 and the take profit target as the old high of $112,000.
Good luck!

US Missiles Flyin'! Buy USD vs EUR GBP AUD NZD CAD CHF JPY!This is the FOREX futures outlook for the week of Jun 22-28th.
In this video, we will analyze the following FX markets:
USD Index, EUR, GBP, AUD, NZD, CAD, CHF, and JPY.
The USD is the world's reserve currency. When there are geo-political hot spots in the world, the USD sees inflows from investors. In light of US strikes against Iranians nuke sites last night, buying the USD versus other currencies is prudent and wise.
The USD should see more gains as long as the current tensions are high. If Iran comes back to the negotiations table, then the environment switches back to a risk on scenario, where the outflows from the USD go back into riskier assets like the stock market.
Enjoy!
May profits be upon you.
Leave any questions or comments in the comment section.
I appreciate any feedback from my viewers!
Like and/or subscribe if you want more accurate analysis.
Thank you so much!
Disclaimer:
I do not provide personal investment advice and I am not a qualified licensed investment advisor.
All information found here, including any ideas, opinions, views, predictions, forecasts, commentaries, suggestions, expressed or implied herein, are for informational, entertainment or educational purposes only and should not be construed as personal investment advice. While the information provided is believed to be accurate, it may include errors or inaccuracies.
I will not and cannot be held liable for any actions you take as a result of anything you read here.
Conduct your own due diligence, or consult a licensed financial advisor or broker before making any and all investment decisions. Any investments, trades, speculations, or decisions made on the basis of any information found on this channel, expressed or implied herein, are committed at your own risk, financial or otherwise.

Multi-Timeframe Analysis & Trend Continuation TradingThe EURJPY has recently violated an important level of structure leading us to make the prediction of price continuing to go higher.
In this video we'll take a look at where the next stopping point may be and what I'm waiting for the market to do in order to get involved in the trade.
If you have any questions, comments or just want to share your views/analysis, please do so below.
Akil

$ETH: The 1-week chart is an absolute disaster!Once again, I want to make it clear: I’m naturally a bull. But I live in Thailand, far from the noise of influencers shouting "buy, buy, buy!" I’ve learned my lesson—when they scream buy, you get rekt. That’s why I rely solely on the charts.
Charts are just mathematics—they don’t lie. So here’s my honest interpretation of what I’m seeing for Ethereum:
🕐 Daily Outlook
Yes, we might see a few nice bounces in the short term. But if your plan is to hold ETH, you should be paying attention to higher timeframes, especially the weekly.
📉 Weekly Chart — It's Ugly
We’re clearly in a descending wedge, and overall, ETH is bearish. Don’t be fooled by the hype or the people trying to take your money.
- RSI is bearish, with a strong bearish divergence still unfolding.
- MACD is on the verge of a bearish crossover, and what’s worse, it’s doing that without even touching the neutral zone—a major red flag.
The last time we saw this setup? November 2021. The price crashed below $1,000.
🔍 Where’s the Support?
This cycle, the support zone looks closer to $1,500, mainly due to institutional interest and the ETF narrative. A full retracement seems unlikely, but technically speaking—it’s still a possibility.
🤔 Why Is This Happening Despite Institutional FOMO?
Here’s the key: ETH has staking, and every month, new CRYPTOCAP:ETH is minted to pay stakers. This creates constant inflation. On top of that, many stakers compound their rewards, accelerating the inflation. And guess what? These same stakers are selling as soon as ETH pumps.
So fundamentally, Ethereum is under pressure because of its own staking mechanics—a system flaw that creates long-term selling pressure.
Do your own research (DYOR). I could be wrong—but at least I’m not trying to sell you a course.

The Midyear Mindset Reset: Reboot Your Trading Before Q3Because nothing says "trader growth" like admitting you’ve been winging it for six months.
👋 Welcome to Halftime — How’s Your P&L Looking?
June’s closing bell isn’t just a date on the calendar — it’s that awkward moment where traders stare into the middle distance, coffee in hand, and quietly whisper: “Well… that went differently than I expected.”
Whether you’ve been racking up wins, nursing drawdowns, or simply surviving market whiplash, midyear is nature’s way of handing you a clean slate. Before Q3 throws its inevitable curveballs, now’s your chance to pause, reset, and actually look at what the heck you’ve been doing. And, of course, prepare for the next batch of earnings reports .
Spoiler: if your trading strategy this year has involved equal parts hope and caffeine, you’re not alone.
🔥 The Year So Far: Markets Kept It… Interesting
Let’s quickly recap 2025 so far (because trauma processing is healthy).
The Magnificent Seven? More like the Magnificent Two-And-A-Half. Meta NASDAQ:META and Microsoft NASDAQ:MSFT ran victory laps while everyone else tripped over AI headlines or regulatory landmines.
Nvidia NASDAQ:NVDA moonwalked into trillion-dollar territory, then stumbled after export bans — but somehow still has every fund manager whispering “Blackwell” like it’s a secret password.
Bitcoin BITSTAMP:BTCUSD set new highs north of $110K (who needs fiat when you can have memes?).
The Fed teased cuts, inflation teased persistence, and Trump teased… well, everyone.
And summer trading arrived with its usual low-volume traps, giving us breakouts that break hearts and liquidity that disappears faster than your broker’s customer support.
In short: volatility? Check. Opportunity? Absolutely. Discipline? That depends on whether you’re still following your rules or trading on vibes.
By June, most traders have crafted elaborate narratives in their heads. You know the type: "This breakout is different," "The Fed has to cut next month," and "There’s no way Nvidia can keep running like this."
The problem is, markets don’t care about your narrative. They care about price, volume, sentiment — and sometimes, absolute chaos. That beautifully clean chart setup? It’s not asking for your prediction. It’s begging you to respond with discipline, not bravado.
The traders who thrived in the first half didn’t win by forecasting every twist in the macro plotline. They won by following the tape. The breakout happened? They took it. The stop-loss hit? They respected it. That’s not luck — that’s execution.
🫶🏻 Emotional Capital: The Real Balance You Should Be Watching
P&L tells one story. Emotional capital tells another.
By June, a lot of traders aren’t out of money — they’re out of discipline. They’ve been revenge trading after a string of losses, chasing AI headlines that already ran, and convincing themselves they can “make it all back” on the next oversized position.
Do you know that feeling?
Resetting your trading mindset at midyear means recalibrating that emotional bankroll. Start by reviewing your trading journal (yes, you’re supposed to have one ). Revisit the trades that made sense and the ones that make you cringe. Recognize your patterns — your strengths, but also your weaknesses. Success leaves clues and there are lessons in failures.
💭 Clean Up the Clutter
There’s a special type of fatigue that sets in after six months of consuming too much trading content. You start layering on indicators like toppings at a frozen yogurt bar — RSI, MACD, Stochastics, VWAP, Fibonacci, Elliott Waves, Gann fans... until your charts light up like the billboards in Times Square.
The truth is, the best traders heading into Q3 are simplifying. They’re not chasing complexity; they’re chasing clarity. They know their setups, they trust their process, and they wait for clean signals.
Summer trading especially demands this discipline. Liquidity gets thinner, breakouts fail more often , and the tape gets choppy.
Complex systems may amplify the noise. Strip it down. Focus on price structure. Simplify your strategy so you can execute when real opportunities appear — not when your 12th oscillator blinks green.
⚾ You Don’t Need a Home Run
At this stage of the year, many traders fall into what we’ll call the desperate hero phase. They feel behind. They want to make up for drawdowns. They want “the trade” that fixes everything. If you’ve missed making bank over the first half of the year, chances are, you want to catch up — and fast.
Here’s a secret: The best traders aren’t always looking for grand slams. They’re playing small ball too — consistent singles, tight risk, controlled losses, steady gains.
Q3 isn’t about doubling your account. It’s about staying alive long enough for your edge to show up and play out. The traders who make it to year-end consistently profitable aren’t the ones chasing massive wins. They’re the ones compounding quiet, boring, disciplined trades.
Midyear Reset: Your Q3 Trading Checklist
Here’s your brutally simple plan for the back half:
✅ Journal your biggest mistakes from H1
✅ Cut your watchlist in half
✅ Size smaller than feels exciting
✅ Trust clean setups over crowded trades
✅ Stay curious — but stay selective
✅ Leave the FOMO trades to the TikTok influencers
So the real question heading into Q3 isn’t whether markets will go up or down. It’s whether you will trade better or keep winging it.
Happy midyear reset. Trade smarter, not harder.

Tesla May Be StallingTesla bounced between early April and late May, but now it may be stalling.
The first pattern on today’s chart is the weekly low of $331.39 from May 22. TSLA fell below that level two weeks ago and was rejected at the same price area last week. Has old support become new resistance?
Second, the stock has fallen under its 8- and 21-day exponential moving averages (EMAs). The 8-day EMA is also at risk of slipping below the 21-day EMA. Such patterns may reflect short-term bearishness. Falling MACD paints a similar picture.
Third, the EV stock peaked at $488.54 in December -- above its previous high of $414.50 from November 2021. But it failed to hold, which could be viewed as a false breakout.
Those signals could focus traders’ attention on the April low of $214.15, which is still more than $100 below TSLA’s close on Tuesday.
Finally, TSLA is an active options underlier. (Its average daily volume of 2.6 million contracts last month ranked third in the entire market, according to TradeStation data.) That could make it easier for traders to take positions with calls and puts.
Check out TradingView's The Leap competition sponsored by TradeStation.
TradeStation has, for decades, advanced the trading industry, providing access to stocks, options and futures. If you're born to trade, we could be for you. See our Overview for more.
Past performance, whether actual or indicated by historical tests of strategies, is no guarantee of future performance or success. There is a possibility that you may sustain a loss equal to or greater than your entire investment regardless of which asset class you trade (equities, options or futures); therefore, you should not invest or risk money that you cannot afford to lose. Online trading is not suitable for all investors. View the document titled Characteristics and Risks of Standardized Options at www.TradeStation.com . Before trading any asset class, customers must read the relevant risk disclosure statements on www.TradeStation.com . System access and trade placement and execution may be delayed or fail due to market volatility and volume, quote delays, system and software errors, Internet traffic, outages and other factors.
Securities and futures trading is offered to self-directed customers by TradeStation Securities, Inc., a broker-dealer registered with the Securities and Exchange Commission and a futures commission merchant licensed with the Commodity Futures Trading Commission). TradeStation Securities is a member of the Financial Industry Regulatory Authority, the National Futures Association, and a number of exchanges.
Options trading is not suitable for all investors. Your TradeStation Securities’ account application to trade options will be considered and approved or disapproved based on all relevant factors, including your trading experience. See www.TradeStation.com . Visit www.TradeStation.com for full details on the costs and fees associated with options.
Margin trading involves risks, and it is important that you fully understand those risks before trading on margin. The Margin Disclosure Statement outlines many of those risks, including that you can lose more funds than you deposit in your margin account; your brokerage firm can force the sale of securities in your account; your brokerage firm can sell your securities without contacting you; and you are not entitled to an extension of time on a margin call. Review the Margin Disclosure Statement at www.TradeStation.com .
TradeStation Securities, Inc. and TradeStation Technologies, Inc. are each wholly owned subsidiaries of TradeStation Group, Inc., both operating, and providing products and services, under the TradeStation brand and trademark. When applying for, or purchasing, accounts, subscriptions, products and services, it is important that you know which company you will be dealing with. Visit www.TradeStation.com for further important information explaining what this means.

German 40 Index – Sentiment Facing a Sterm TestSince hitting its most recent all time high of 24469 on June 5th the Germany 40 index has experienced some downside pressure as traders have moved to lock in profits on a very strong start to the year. This move has the potential to turn June into the worst monthly performance of 2025 so far, although there is still another 8 trading days to go.
This short-term shift in sentiment has been related to a combination of factors. The new all time high of 24469 hit on June 5th coincided with the latest ECB interest rate cut. However, at that meeting Madame Lagarde indicated in the press conference that more data on the path of inflation, trade tariffs with the US and Eurozone growth would be required before the ECB would consider cutting interest rates again.
This was followed by comments and headlines which suggested that progress on a trade deal between the US and EU was slow and would potentially continue past the original July 9th pause deadline set by President Trump.
Then in the last week sentiment has been rocked further by the spike in Oil prices driven by an escalating conflict between Israel and Iran that has seen them trade missile attacks for 7 straight days, alongside a growing concern that the US may also be seriously considering entering a direct conflict with Iran after Bloomberg reported yesterday that senior US officials are preparing for a possible strike in the coming days.
At the time of writing (0700 BST) this leaves the Germany 40 trading at 1 month lows around 23142 and suggests a consideration of the technical outlook, including potential support and resistance levels could be useful.
Technical Update: Watching 23235 Last Correction Low
Having posted a new all-time high on June 5th at 24469, a more extended price correction has developed in the Germany 40 index. Interestingly, as the chart below shows, this phase of weakness has seen closing breaks under what some might have anticipated would be support, marked by the Bollinger mid-average (currently 23862).
In previous reports, we have suggested that traders may use the Bollinger mid-average as an indicator of the possible direction of the current price trend. If the mid-average is rising with prices above it, the trend may be classed as an uptrend, while if the mid-average is falling with price activity below it, a downtrend might be in place.
As the chart shows, following the latest breaks below the mid-average, this has now turned lower, and traders might now be focusing on the possibilities for an extended phase of price weakness.
Let's consider the possible support or resistance levels that could be worthwhile for traders to focus on.
Potential Support Levels:
With Thursday’s initial price activity so far seeing further selling pressure, as the chart below shows, it might be suggested the next relevant support is already currently being tested with moves below 23235. This level is equal to the last correction low posted on May 23rd at 23235.
Traders might now be watching how this 23235 low support is defended on a closing basis over coming sessions, as confirmed breaks lower, while no guarantee of deeper price declines, might skew risks towards tests of the next potential support at 22303, which is equal to the 38.2% retracement of April 7th to June 5th strength.
Potential Resistance Levels:
Since the June 5th all-time high, an extended decline in price has already been seen, so a reactive recovery might be a possibility. However, having recently seen the mid-average turn lower, closing breaks back above its current 23862 level might now be required to trigger a phase of price recovery.
While much will depend on future price trends and market sentiment, if successful upside breaks above the 23862 mid-average are seen, it might lead to tests of 24469 which is the June 5th all-time high.
The material provided here has not been prepared accordance with legal requirements designed to promote the independence of investment research and as such is considered to be a marketing communication. Whilst it is not subject to any prohibition on dealing ahead of the dissemination of investment research, we will not seek to take any advantage before providing it to our clients.
Pepperstone doesn’t represent that the material provided here is accurate, current or complete, and therefore shouldn’t be relied upon as such. The information, whether from a third party or not, isn’t to be considered as a recommendation; or an offer to buy or sell; or the solicitation of an offer to buy or sell any security, financial product or instrument; or to participate in any particular trading strategy. It does not take into account readers’ financial situation or investment objectives. We advise any readers of this content to seek their own advice. Without the approval of Pepperstone, reproduction or redistribution of this information isn’t permitted.

Coinbase Shares Rise Following Stablecoin Legislation ApprovalCoinbase (COIN) Shares Rise Following Stablecoin Legislation Approval
Shares in Coinbase Global (COIN) surged by 11% yesterday, making the company the top performer in the S&P 500 index (US SPX 500 mini on FXOpen).
The sharp rise was driven by news that the US Senate has approved the GENIUS stablecoin bill, which sets out a regulatory framework for the use of stablecoins — crypto assets whose value is pegged to another currency or financial instrument, such as the US dollar.
The bill (which still requires approval from the House of Representatives) would pave the way for banks, fintech companies, and other financial market participants to use stablecoins. This development acted as a strong bullish catalyst for COIN shares.
Technical Analysis of Coinbase (COIN) Share Price Chart
In our previous analysis of the COIN share price chart, we:
→ identified an ascending channel (shown in blue);
→ suggested that the COIN share price could rise towards the psychological level of $300.
That projection has played out — the price is now very close to the $300 mark. So, what comes next?
In a bold, optimistic scenario, buyers may hope for a continuation of the rally, with the share price pushing towards the upper boundary of the long-term ascending channel, especially following the recent news. In the medium term, the blue ascending channel may remain relevant, given the strong signal of improved cryptocurrency regulation in the US legislative framework.
However, we also note some vulnerability to a pullback, as:
→ the $300 level may act as significant resistance;
→ the price is approaching the upper boundary of the blue channel, which also shows resistance characteristics;
→ once the initial wave of positive sentiment fades, some investors may look to take profits, especially given the more than 20% rise in Coinbase (COIN) shares since the beginning of the month.
This article represents the opinion of the Companies operating under the FXOpen brand only. It is not to be construed as an offer, solicitation, or recommendation with respect to products and services provided by the Companies operating under the FXOpen brand, nor is it to be considered financial advice.

How to Find Day Trading Momentum Plays...In this video I show the screener I use in order to find my momentum day trading setup. If you have any questions feel free to ask. Hope you enjoy!!

CRYPTO - Big Smackdown Then AltSeason ?The Crypto Cycle Gurus are telling us that AltSeason is just around the corner since the expected 4 year cycle completion is just a few months away...
But are they correct or is there a twist in the tale ?
Here's a 10 minute video to show a potential twist.
There might just be a DEEP dip buy opportunity coming down the road...
Not advice

TradingView Show: New Trade Ideas and The Leap TradeStationJoin us for a timely TradingView live stream with David Russell, Head of Global Market Strategy at TradeStation, as we break down the latest rebound in the markets and what it could mean for traders and investors. In this session, we’ll dive into:
- The upcoming Fed meeting and what policymakers might signal heading into the second half of the year
- Why the 10-year yield nearing 4.5% is important — and how to set alerts to stay ahead of key moves
- Summer trading strategies to navigate slower market conditions and spot emerging opportunities
- A closer look at Latin American equities, with names like Mercado Libre in focus
- The surprising strength in stocks that have doubled since the tariff-driven selloff
- How energy and oil markets are reacting to renewed geopolitical tensions in the Middle East
- And other trends that are shaping the broader investment landscape
Whether you're trading short-term setups or planning longer-term plays, this session will give you fresh insights and practical takeaways to help you stay prepared and informed through the summer months.
Bonus: Discover our latest broker integration update with TradeStation—now supporting equity options trading directly on TradingView. This upgrade brings advanced tools like the strategy builder, options chain sheet, and volatility analysis to your fingertips, making it easier to trade through uncertain market conditions.
This session is sponsored by TradeStation, whose vision is to provide the ultimate online trading platform for self-directed traders and investors across equities, equity index options, futures, and futures options markets. Equities, equity options, and commodity futures services are offered by TradeStation Securities Inc., member NYSE, FINRA, CME, and SIPC.
Disclosures from TradeStation:
tradestation.com/insights/etf-disclosures/
tradestation.com/important-information/

Major resistance ahead?The Aussie (AUD/USD) is rising towards the pivot which has been identified as an overlap resistance and could reverse to the 1st support.
Pivot: 0.6512
1st Support: 0.6466
1st Resistance: 0.6545
Risk Warning:
Trading Forex and CFDs carries a high level of risk to your capital and you should only trade with money you can afford to lose. Trading Forex and CFDs may not be suitable for all investors, so please ensure that you fully understand the risks involved and seek independent advice if necessary.
Disclaimer:
The above opinions given constitute general market commentary, and do not constitute the opinion or advice of IC Markets or any form of personal or investment advice.
Any opinions, news, research, analyses, prices, other information, or links to third-party sites contained on this website are provided on an "as-is" basis, are intended only to be informative, is not an advice nor a recommendation, nor research, or a record of our trading prices, or an offer of, or solicitation for a transaction in any financial instrument and thus should not be treated as such. The information provided does not involve any specific investment objectives, financial situation and needs of any specific person who may receive it. Please be aware, that past performance is not a reliable indicator of future performance and/or results. Past Performance or Forward-looking scenarios based upon the reasonable beliefs of the third-party provider are not a guarantee of future performance. Actual results may differ materially from those anticipated in forward-looking or past performance statements. IC Markets makes no representation or warranty and assumes no liability as to the accuracy or completeness of the information provided, nor any loss arising from any investment based on a recommendation, forecast or any information supplied by any third-party.

Bitcoin - Trend Shift Confirmed, Eyes on $102.8K LiquidityMarket Context
Bitcoin showed signs of exhaustion after a strong short-term rally within a clean upward channel on the 1H chart. Price action had been respecting the trend structure until a key deviation occurred near $108,500, where we saw an internal liquidity sweep that hinted at potential distribution.
Fake-Out Confirmation and Shift in Momentum
After taking out local highs around $108.5K, price failed to continue higher and instead reversed sharply, confirming the sweep as a classic fake-out. This kind of internal liquidity grab is typically used to trap breakout buyers before reversing and targeting previous lows.
Break of Structure and Channel Retest
The rising channel was broken convincingly, and price has now retested the underside of the channel, aligning with the 50% equilibrium of the entire high-to-low range. This reinforces the bearish bias and suggests the market has likely shifted from accumulation to distribution.
Downside Targets and Key Levels
Immediate support sits around $104.6K, which served as a consolidation base during the earlier run-up. If this level fails to hold, the next key target would be a sweep of the previous significant low at $102.8K. This area is marked as a point of interest and could offer a reaction or reversal.
Price Expectations and Trade Outlook
As long as price remains below the broken channel and under $107K, the bearish scenario remains in play. I’m watching for bearish continuation into $104.6K first, and a potential full sweep toward $102.8K if that support fails.
Conclusion
The internal sweep followed by impulsive rejection, combined with a clear channel breakdown and retest, shifts the bias to bearish. A move into the $104.6K region seems probable, with a lower liquidity target at $102.8K in sight if downside pressure accelerates.
Disclosure: I am part of Trade Nation's Influencer program and receive a monthly fee for using their TradingView charts in my analysis.
___________________________________
Thanks for your support!
If you found this idea helpful or learned something new, drop a like 👍 and leave a comment, I’d love to hear your thoughts! 🚀

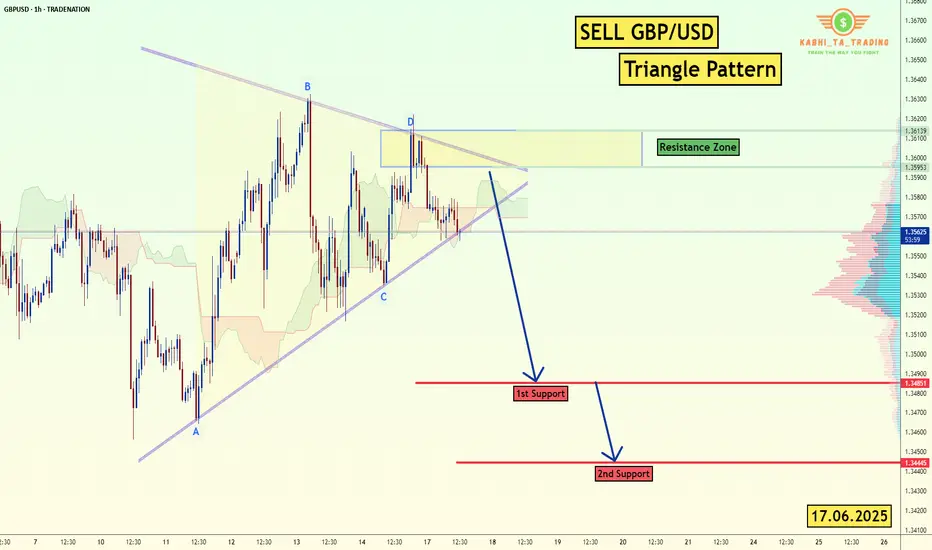
GBP/USD - H1-Triangle Breakout (17.06.2025)The GBP/USD Pair on the H1 timeframe presents a Potential Selling Opportunity due to a recent Formation of a Triangle Breakout Pattern. This suggests a shift in momentum towards the downside in the coming hours.
Possible Short Trade:
Entry: Consider Entering A Short Position around Trendline Of The Pattern.
Target Levels:
1st Support – 1.3485
2nd Support – 1.3444
🎁 Please hit the like button and
🎁 Leave a comment to support for My Post !
Your likes and comments are incredibly motivating and will encourage me to share more analysis with you.
Best Regards, KABHI_TA_TRADING
Thank you.
Disclosure: I am part of Trade Nation's Influencer program and receive a monthly fee for using their TradingView charts in my analysis.
Weekly Market Outlook: FOMC, Trade Deals and GeopoliticsIt is a holiday-shortened week, with the majority of markets halting early on Thursday, June 19, 2025, in observance of Juneteenth. See here for holiday trading schedule
Key Themes to Monitor This Week
Geopolitical Risks
Any outside intervention in the ongoing Israel-Iran conflict will likely be seen as a risk-off event by market participants. Despite Friday’s sell-off, markets shrugged off during the Sunday open and overnight sessions.
There are potential risks to trade routes and energy infrastructure, although disruptions seem unlikely at the moment. Amena Bakr at Kpler noted that, so far, there are no signs of disruptions in oil loadings from Iran. Without a supply outage, there is no pressing need for additional barrels to be brought onto the market.
Trade War and Trade Deals
There have been recent developments with the U.S. reaching key trade deal milestones with several countries. The baseline scenario remains optimistic, with expectations for an extension in negotiations and potential reciprocal tariffs for countries failing to reach agreements.
FED Week
This is a key week for U.S. monetary policy, with the FOMC decision, Summary of Economic Projections (SEP), and Chair Powell’s press conference scheduled.
Traders will be closely watching how the Fed’s inflation and growth expectations have evolved, as reflected in the SEP. All eyes will be on the dot plot to note how interest rate expectations have evolved since last quarter. Of note: Will President Trump’s continued calls for rate cuts influence Chair Powell’s tone or guidance?
Expectations for the Week Ahead
NQ futures have continued one-time framing higher, consistently creating higher lows since the week of April 21, 2025. A strong support zone exists below, anchored at the yearly Volume Point of Control (VPOC) and the Anchored VWAP from May 11, 2025, when markets gapped higher.
Key Levels to Watch
• yVAH: 22,690.50
• R2: 22,510
• R1 / Previous Week High: 22,322.50
• May 11 AVWAP: 21,672.25
• yVPOC: 21,660
Scenario 1: Market Grinds Higher but Stays Cautious
Despite several looming risk factors, the market could continue to grind higher. In this scenario, we anticipate a test above the prior week's high, followed by a potential pullback into last week’s range.
Example Trade Idea 1
• Entry: 22,000
• Stop: 21,930
• Target: 22,322
• Risk: 70 pts
• Reward: 322 pts
• Risk-Reward Ratio: 4.6R
Scenario 2: Pullback to Support, Range-Bound Consolidation
If the market pulls back, we expect the yearly VPOC and AVWAP from May 11 to act as key support levels. In this case, price action may remain range-bound within the previous week’s range, forming an inside week.
Example Trade Idea 2
• Entry: 21,672
• Stop: 21,600
• Target: 22,000
• Risk: 72 pts
• Reward: 328 pts
• Risk-Reward Ratio: 4.6R
________________________________________
Glossary
• VPOC: Volume Point of Control
• VA: Value Area
• VAL: Value Area Low
• VAH: Value Area High
• VP: Volume Profile
• AVP: Anchored Volume Profile
• Y: Yearly
• pWk: Previous Week

Meta & Microsoft: How Two Tech Titans Outran a Sinking Mag 7Forget about the Magnificent Seven and say hello to M&M — the only two winners of the year so far.
If you blinked during the first half of 2025, you might’ve missed it: the mighty Magnificent Seven are starting to look more like a Scraggly Five. While Tesla NASDAQ:TSLA fumbled its autonomy narrative and Apple NASDAQ:AAPL spent more time designing slides for the WWDC than in keynotes, two names quietly did the thing — created shareholder value.
Meta NASDAQ:META and Microsoft NASDAQ:MSFT
Both are up more than 13% year-to-date each, sitting comfortably at the top of the gains leaderboard. For comparison: Nvidia managed just 3% (and that’s with all the AI hype), and everyone else? Down. Flat. Or just ghosted by Wall Street. The iPhone maker? How’s 20% to the downside?
Let’s break down how Meta and Microsoft dodged the selloff.
📞 Meta: Not About That Meta
Meta NASDAQ:META came into 2025 like it had something to prove. Zuck had long gone full avatar with the metaverse. But now? Now he wants to win AI — and he’s putting his money where his data is. Meta’s latest foray into AI is a $14.3 billion investment into Scale AI.
A 49% non-voting stake in the AI darling isn’t for fun — but for function. It’s a full-court press to close the Llama-size gap between Meta’s in-house models and the heavyweights like OpenAI and Anthropic.
Scale AI, already one of Meta’s biggest vendors, processes and labels the data that fuels Meta’s large language models. It was only a matter of time before Zuck decided, “Hey, let’s just own a piece of the pipeline.”
And in true tech soap opera fashion, Scale CEO Alexandr Wang last week confirmed in an internal memo he’s leaving to join Meta full-time. For those keeping score: Wang, born in 1997, became the youngest billionaire in 2021. Now, he’s headed into the belly of the Menlo Park beast.
Wall Street seems to dig that. The stock shot up when the news leaked , as investors rewarded Meta for looking less like a social media giant and more like a serious AI player — even if it still serves your aunt’s minion memes.
👾 Microsoft: The OS of Enterprise Still Runs Smooth
Meanwhile in Redmond, Satya Nadella was out here quietly running the table.
Microsoft NASDAQ:MSFT hit an all-time high of $480 on June 12, pushing its market cap to a record-breaking $3.5 trillion. For about a day or two before that, Nvidia NASDAQ:NVDA was on top — and then Microsoft did what Microsoft always does: calmly pressed Ctrl+Alt+Delete on its competition and reclaimed its spot as Earth’s most valuable company .
How did that happen? Certainly not overnight.
Azure continues to gobble cloud market share, Microsoft 365 is still the gold standard for digital productivity, and Teams — love it or hate it — is now basically corporate law.
But don’t sleep on its AI game. Microsoft isn’t just throwing money at OpenAI, it’s embedding AI into everything it touches. Outlook, Excel, Word — all getting their Copilot upgrades. Want to finish that quarterly report faster? Let AI do it. Want it rewritten in pirate-speak? AI’s got you.
Microsoft isn’t just building tools. It’s establishing an infrastructure for the new AI economy. And traders see that. They understand that while Nvidia sells the shovels, Microsoft owns the mine.
👩🏻💻 Why the Rest of the Mag 7 Didn’t Make the Cut
Quick vibe check:
Apple NASDAQ:AAPL Still chasing the AI breakthrough. No one talks about the Vision Pro headset anymore, and the annual WWDC event wasn’t anything special. The stock is down 20% on the year.
Tesla NASDAQ:TSLA Robotaxis are coming ( maybe even this week ). But earnings pressure and margin squeeze made investors wish for more than tweets and timelines. The shares are underwater by 14% YTD.
Amazon NASDAQ:AMZN E-commerce growth hit cruise control, and its AI presence still feels more like an R&D lab than a monetized machine. The stock is staring at a 3.7% loss, largely thanks to Amazon getting slapped in the face from Trump’s tariffs .
Alphabet NASDAQ:GOOGL Search is still dominant, but Gemini’s bumpy launch and questionable performance has traders waiting for Google to actually ship something great, and not just strip the results from the iconic blue links . The stock is down 8%.
Nvidia NASDAQ:NVDA Yes, still the king of chips. And yes, it’s still delivering. But with valuation stretched like Lululemons in a CrossFit class and export bans weighing heavy , it’s getting harder to maintain the pace.
🍻 Trading Lesson: Leadership Rotates
If you’re a trader who’s been glued to Nvidia’s every tick or still buying dips on Apple because it “has to come back,” let this be your mid-year reminder: the market doesn’t care what used to lead.
Leadership rotates. Fundamentals shift. And sometimes, the best trade is the one hiding behind less hype and more function.
Case in point: While Apple’s been trying to find a catalyst, Meta just found a whole new business partner. While Nvidia’s been spinning plates on export rules, Microsoft’s just printing money off the back of Office subscriptions and Azure servers.
👀 What Happens Next?
With the second half of the year approaching, all eyes are on:
Meta’s AI ambitions — can the Scale deal accelerate model performance fast enough to close the gap with rivals?
Microsoft’s cloud dominance — can Azure continue its double-digit growth without hitting the regulatory radar?
Earnings, earnings, earnings — it’s almost the season again! Earnings reports kick off in about a month and things will get cracking.
Whatever happens, don’t bet the farm on what used to work. Watch the rotation. Track the strategy shifts. And for the love of charts — keep one eye on the Earnings Calendar .
💬 Final Thought
If Meta and Microsoft can shine while their peers flounder, what does that say about the real winners in this new AI economy? Maybe it’s not about who builds the flashiest model — but who actually knows how to monetize it. What’s your thought?

The "True Close" Institutions Don't Talk About — But Trade On█ My Story from the Inside
I worked at a hedge fund in Europe, where I served as a Risk Advisor. One thing I never expected before joining the institutional side of the market was this:
They didn’t treat the current day’s close as the "true" close of the market.
Instead, they looked at the first hour of the next day — once all pending flows had settled, rebalancing was done, and execution dust had cleared — that was the true close in their eyes.
Here’s why that changed everything I knew about trading:
█ Institutional Reality vs Retail Fantasy
⚪ Retail traders are taught:
“The daily close is the most important price of the day.” But institutions operate under constraints that most retail traders are never exposed to:
Orders too large to fill before the bell
Internal compliance and execution delays
Batch algorithms and VWAP/TWAP systems that extend into the next session
So while the market might close on paper at 17:30 CET, the real trading — the stuff that matters to funds — might not wrap up until 09:30 or 10:00 the next morning.
Although the official “close” prints here, institutional volume ends quickly. It drops off sharply, almost immediately. Once the books are closed and final prints are done, big players exit — and what's left is thin, passive flow or noise.
The first hour of the New York session reveals structured flows, not random volatility. This is where institutions finalize yesterday’s unfinished business, which is why many consider this the “true” close.
And that’s the price risk managers, portfolio managers, and execution teams internally treat as the reference point.
█ Example: The Rebalance Spillover
Let’s say a fund needs to offload €100 million worth of tech stocks before month-end. They start into the close, but liquidity is thin. Slippage mounts. They pause execution. Next morning, their algo resumes — quietly but aggressively — in the first 30 minutes of trade.
You see a sharp spike. Then a reversal. Then another surge.
That’s not noise. That’s structure. It’s the result of unfinished business from yesterday.
█ Why the First Hour is a War Zone
You’ve probably seen it:
Prices whip back and forth at the open
Yesterday’s key levels are revisited, sometimes violently
Big moves happen without any overnight news
Here’s what’s happening under the hood:
Rebalancing spillovers from the day before
Late-position adjustments from inflows/outflows
Risk parity or vol-targeting models triggering trades based on overnight data
The market’s not reacting to fresh news — it’s completing its old to-do list.
█ What the Research Really Says About Morning Volatility
The idea that "the true close happens the next morning" isn’t just insider intuition — it’s backed by market microstructure research that highlights how institutional behaviors disrupt the clean narrative of the official close.
Here’s what the literature reveals:
█ Heston, Korajczyk & Sadka (2010)
Their study on intraday return patterns shows that returns continue at predictable 30-minute intervals, especially around the open.
The key driver? Institutional order flow imbalances.
When big funds can’t complete trades at the close, they spill into the next session, creating mechanical, non-informational momentum during the first hour. These delayed executions are visible as persistent price drifts after the open, not random volatility.
█ Wei Li & Steven Wang (SSRN 2010)
This paper dives into the asymmetric impact of institutional trades. It shows that when institutions are forced to adjust positions — often due to risk limits, inflows/outflows, or model-based triggers — the market reacts most violently in the early hours of the day.
When funds lag behind the clock, the next morning becomes a catch-up window, and price volatility spikes accordingly.
█ Lars Nordén (Doctoral Thesis, Swedish Stock Exchange)
In his microstructure research, Nordén found that the variance of returns is highest in the early part of the session, not at the close. This is especially true on days following macro events or at the end/start of reporting periods.
The data implies that institutions “price in” what they couldn’t execute the day before, making the next morning more informative than the actual close.
█ Bottom Line from the Research:
The first hour isn’t wild because it’s full of emotion.
It’s wild because it’s full of unfinished business.
These studies reinforce that price discovery is a rolling process, and for institutional flows, the official close is just a checkpoint, not a final destination.
█ How to Use This as a Trader
⚪ Don't assume the official close is final
Treat it as a temporary bookmark. Watch what happens in the first hour of the next day — that’s when intentions are revealed.
⚪ Volume in the first 30–60 minutes matters
It’s not noise — it’s flow completion. Often non-price-sensitive. Often mechanical.
⚪ Design strategies around “true close” logic
Test fade setups after the first hour’s range is established. That’s often the real “settled” level.
⚪ Use the first-hour VWAP or midpoint as a reference
Institutions may anchor to that — not the official close — for mean reversion or risk metrics.
█ Final Thought
The first hour is not the start of something new.
It’s the conclusion of yesterday’s market.
And unless you understand how institutions truly close their books — and how long that takes — you’ll always be a step behind.
So next time you see chaos at the open, stop calling it random.
👉 It’s just the market putting yesterday to bed — late.
-----------------
Disclaimer
The content provided in my scripts, indicators, ideas, algorithms, and systems is for educational and informational purposes only. It does not constitute financial advice, investment recommendations, or a solicitation to buy or sell any financial instruments. I will not accept liability for any loss or damage, including without limitation any loss of profit, which may arise directly or indirectly from the use of or reliance on such information.
All investments involve risk, and the past performance of a security, industry, sector, market, financial product, trading strategy, backtest, or individual's trading does not guarantee future results or returns. Investors are fully responsible for any investment decisions they make. Such decisions should be based solely on an evaluation of their financial circumstances, investment objectives, risk tolerance, and liquidity needs.

Why Recursion Pharmaceuticals RXRX Could Be the NVDA of BiotechRecursion Pharmaceuticals RXRX is rapidly emerging as a transformative force in drug discovery, leveraging cutting-edge artificial intelligence and automation to industrialize and accelerate the development of new medicines. Here’s why RXRX could be the next NVIDIA (NVDA) of biotechnology and why its stock could soar by year-end:
1. AI-Powered Drug Discovery Platform with Unmatched Scale
Recursion integrates AI, machine learning, automation, and advanced data science to decode biology and chemistry, dramatically reducing the time and cost of drug discovery.
The company’s proprietary BioHive-2 supercomputer, built with NVIDIA’s DGX H100 systems, is the most powerful AI computing system wholly owned by any biopharma company, enabling Recursion to process biological data at unprecedented speeds.
By reducing the number of compounds needed for clinical candidates from thousands to just 136–200 and shrinking development timelines to under a year, RXRX is fundamentally changing the economics of pharmaceutical R&D.
2. Strategic Partnerships and Industry Validation
RXRX has forged high-profile partnerships with pharmaceutical giants such as Bayer, Roche/Genentech, Takeda, and Sanofi, validating its platform and unlocking milestone payments that could exceed $20 billion over time.
The company’s collaboration with AI biotech Exscientia in a $700 million deal further cements its leadership in the AI-driven drug discovery space, creating a pipeline of 10 clinical and preclinical programs with hundreds of millions in potential milestones.
NVIDIA itself holds over 7.7 million shares of RXRX, making it one of NVIDIA’s largest biotech investments and a strong endorsement of Recursion’s technology and long-term vision.
3. Explosive Revenue Growth and Strong Cash Position
Analysts forecast Recursion’s revenue to grow at a 65% CAGR from $58.8 million in 2024 to $263 million by 2027, far outpacing the broader biotech sector.
The company ended 2024 with over $600 million in cash, providing a solid runway for continued investment in R&D, platform expansion, and clinical trials.
Wall Street analysts expect more than 50% upside in RXRX stock over the next 12–24 months, with multiple clinical milestones and partnership announcements as near-term catalysts.
4. Disruptive Vision: The “Virtual Cell” and Beyond
RXRX is building toward a “virtual cell,” where AI models can simulate biological processes with such accuracy that wet lab experiments shift from data generation to validating computational predictions.
This approach could dramatically improve drug development success rates, addressing the industry’s notorious 95% failure rate and positioning Recursion as the go-to platform for next-generation drug discovery.
5. Market Sentiment and Institutional Support
RXRX has caught the attention of growth investors and major funds, including Cathie Wood’s ARK Invest, further boosting its profile and liquidity.
Recent stock surges and high trading volumes reflect growing investor confidence in Recursion’s disruptive potential and the broader AI-in-biotech trend.

MGY: Technical Breakout + Fundamental Momentum = Quiet Winner?Magnolia Oil & Gas (MGY) is showing one of the cleanest technical breakouts in the energy sector — and the market hasn’t priced it in yet. After months of pressure, price has broken above both the 50-day and 200-day moving averages with rising volume, signaling a clear phase shift from distribution to accumulation. Recent candles confirm control shifting to the buyers, with a tight structure, rising lows, and bullish momentum building underneath resistance.
The fundamentals back the technical setup. In the latest earnings report, MGY delivered a 9.7% revenue increase, $110M in free cash flow, and continues to pay dividends with low leverage. UBS upgraded the stock with a $29 target, which aligns precisely with the post-breakout projection. Operationally, the company is expanding in key U.S. basins like Eagle Ford, while seeing growing demand from Australia and Latin America.
With oil prices pushing higher and geopolitical tensions rising, MGY stands out as a stable energy play in a volatile world. Holding above the $24.00–$24.30 zone keeps the breakout valid, with $29+ as a natural magnet for price. Most investors are still asleep on this name — but the structure is already telling a very different story.
