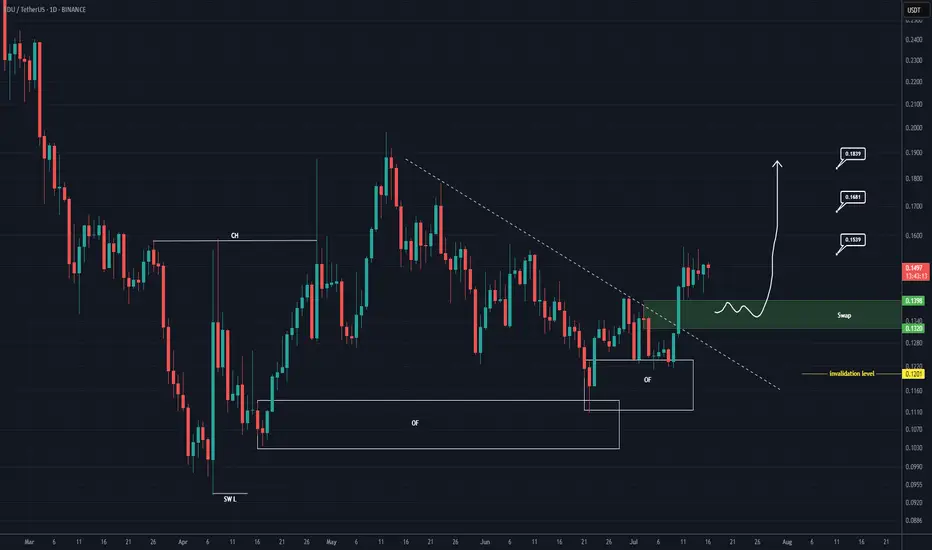
EDU Buy/Long Setup (1D)After forming a swing low, the price has created a bullish Change of Character (CH), and it has flowed well from the origin order blocks.
The trigger line has been broken, and the price has formed a SWAP zone.
Given the bullish signs on the chart, we can consider entering a buy position within the SWAP zone.
The targets are marked on the chart.
A daily candle closing below the invalidation level will invalidate this analysis.
For risk management, please don't forget stop loss and capital management
When we reach the first target, save some profit and then change the stop to entry
Comment if you have any questions
Thank You
EDU
EDUUSDT Forming Descending TriangleEDUUSDT has recently broken out of a descending triangle pattern on the daily timeframe, which is typically a bullish signal when confirmed with volume. The breakout has occurred with notable strength and solid green candle momentum, indicating a potential trend reversal and the beginning of a strong upward move. With price currently trading near $0.1499, this technical breakout opens the door for a projected gain of 60% to 70%+ in the coming days or weeks.
EDU, the native token of the Open Campus project, is gaining attention as the Web3 education narrative grows stronger. As traditional sectors like education integrate blockchain, EDU stands out as a project with real-world utility and adoption potential. The fundamentals are aligning well with the technical picture, and the increased investor interest is starting to reflect in both volume spikes and social media chatter.
If EDUUSDT maintains support above the breakout trendline, traders could see a continuation toward the $0.25 to $0.27 region — aligning with the chart projection of nearly 80% upside. This setup is further supported by increasing market sentiment, and EDU’s strategic partnerships in the education sector make this move fundamentally sound.
This is a high-potential setup for traders looking to ride breakout momentum in trending altcoins. EDU is not just riding the wave of hype but is backed by utility, strong technical structure, and market interest — making it a standout in the current altcoin rotation.
✅ Show your support by hitting the like button and
✅ Leaving a comment below! (What is You opinion about this Coin)
Your feedback and engagement keep me inspired to share more insightful market analysis with you!

#EDU/USDT#EDU
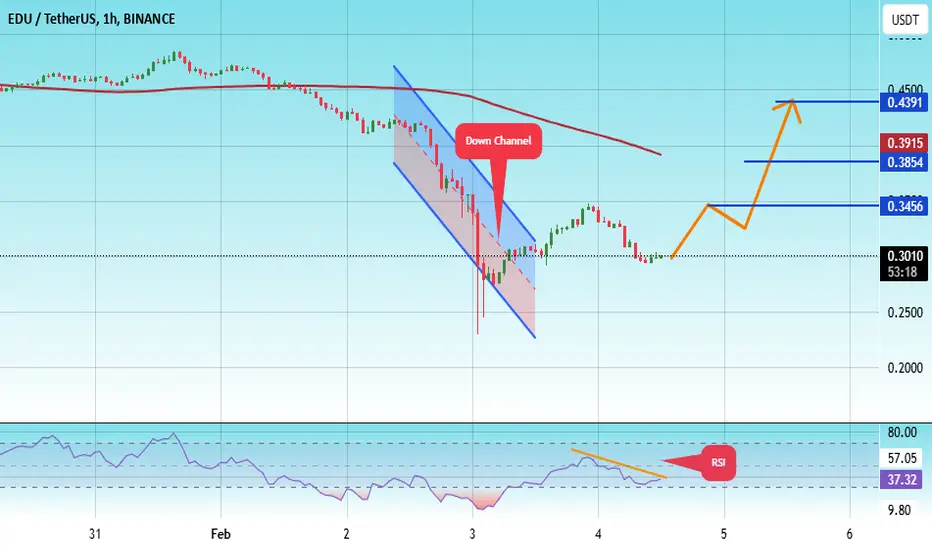
The price is moving within a descending channel on the 1-hour frame, adhering well to it, and is heading toward a strong breakout and retest.
We are experiencing a rebound from the lower boundary of the descending channel. This support is at 0.1400.
We are experiencing a downtrend on the RSI indicator, which is about to break and retest, supporting the upward trend.
We are heading toward stability above the 100 Moving Average.
Entry price: 0.1434
First target: 0.1463
Second target: 0.1488
Third target: 0.1522

#EDU/USDT#EDU
The price is moving in a descending channel on the 1-hour frame and is adhering to it well and is heading to break it strongly upwards and retest it
We have a bounce from the lower limit of the descending channel, this support is at a price of 0.2300
We have a downtrend on the RSI indicator that is about to break and retest, which supports the rise
We have a trend to stabilize above the moving average 100
Entry price 0.2997
First target 0.3456
Second target 0.3854
Third target 0.4391
Open Edu Surged 20% Today Gearing to Reclaim $100 Mln Mkt CapOpen Edu ( NYSE:EDU ) native token spike 20% today amidst breaking out of key resistant point setting the coast to reclaim the $100 million market cap.
Built on the BNB chain, The Open Campus Protocol is a decentralized solution for educators, content creators, parents, students, and co-publishers designed to address the major challenges in education today. Despite the critical role of educators in shaping the future generation, they are often undervalued and underpaid.
With growing interest in the world of web3.0 and NFT's, NYSE:EDU might just be a ticking time bomb that is setting the stage for a billion dollar in market cap.
As of the time of writing, NYSE:EDU is up 18% with build up momentum and RSI at 57, NYSE:EDU is gearing for a 50% breakout as conformation for the $100 million market cap sojourn.
Similarly, failure to break further above the resistant level could lead to a sell-off to the $0.096 support point.
Open Campus Price Data
The Open Campus price today is $0.153184 USD with a 24-hour trading volume of $69,244,194 USD. Open Campus is up 17.44% in the last 24 hours. The current CoinMarketCap ranking is #466, with a market cap of $62,914,963 USD. It has a circulating supply of 410,715,985 EDU coins and a max. supply of 1,000,000,000 EDU coins.

#EDU/USDT#EDU
The price is moving within a descending channel on the 1-hour frame, adhering well to it, and is on its way to breaking it strongly upwards and retesting it.
We are seeing a rebound from the lower boundary of the descending channel, which is support at 0.1430.
We have a downtrend on the RSI indicator that is about to break and retest, supporting the upward trend.
We are looking for stability above the 100 Moving Average.
Entry price: 0.1480
First target: 0.1511
Second target: 0.1540
Third target: 0.1580

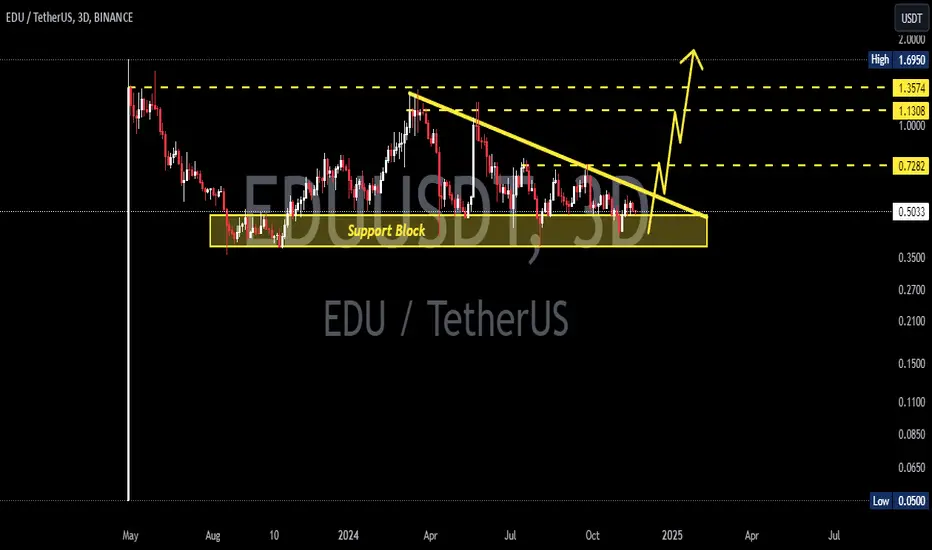
EDUUSDT 4DEDU ~ 4D
#EDU If you still have a Conviction on this coin,. This is a very good support block for now. buy gradually with a minimum target of 20%

5 Mistakes to Avoid When Trading Futures(My Personal Experience)Hi everybody🫶
Many of You have been asking about trading futures! So, I decided to write a post about the mistakes I’ve made in futures trading and how to avoid them. Of course, everyone has their own journey and will make their own mistakes, but learning from someone else’s experience can be incredibly valuable too!
Trading futures can be highly rewarding, but it also carries significant risks. Based on my own experience, here are five common mistakes I made and how to avoid them:
1. Ignoring Stop-Losses
Mistake:
Many traders skip setting stop-losses, hoping the price will reverse in their favor. This can lead to devastating losses.
How to avoid it:
Always set stop-losses before entering a trade. They are a simple yet effective way to limit losses. If you're worried about stop-hunts, place them considering market volatility or use trailing stops.
2. Overusing Leverage
Mistake:
High leverage can amplify profits, but it also significantly increases potential losses, especially in volatile markets.
How to avoid it:
Use minimal leverage, particularly if you're a beginner. Calculate your position size so that any potential loss does not exceed 1-2% of your capital per trade.
3. Trading Without a Clear Plan
Mistake:
Trading based on emotions or intuition often leads to chaotic decisions and loss of capital.
How to avoid it:
Develop and stick to a clear trading plan. Define your entry and exit points, position size, and risk levels before opening a trade. Regularly review and analyze your results.
4. Neglecting Risk Management
Mistake:
Putting too much capital into a single trade or failing to account for market volatility can result in substantial losses.
How to avoid it:
Diversify your positions and follow the rule: never risk more than 2% of your total capital at once. Assess current market volatility and adjust your position size accordingly.
5. Letting Emotions Drive Your Trades
Mistake:
Greed, fear, or the urge to "get even" can lead to impulsive and poorly thought-out decisions.
How to avoid it:
Stick to your pre-defined strategy instead of reacting emotionally. If you feel emotions taking over, take a break. Trading requires discipline and a calm mindset.
Avoiding these mistakes and following these tips, which come from my personal experience, can help you reduce risks and improve your chances of success in futures trading. Remember, the market is always full of opportunities, stay calm to catch them!
Thank You for staying with me
Sincerely yours,
Kateryna💋

Short Signal on EDUUSDT / Making profit even in Bleeding MarketBINANCE:EDUUSDT
📈Which side you pick?
Bull or Bear
Low-risk status: 3x-4x Leverage
Mid-risk status: 5x-8x Leverage
(For beginners, I suggest low risk status)
👾Note: The setup is active but expect the uncertain phase as well. also movement lines drawn to predict future price reactions are relative and approximate.
➡️Entry Area:
Yellow zone
⚡️TP:
0.6725
0.6375
0.5955
🔴SL:
0.7923
🧐The Alternate scenario:
If the price stabilizes against the direction of the position, below or above the trigger zone, the setup will be canceled.

Open CampusEDU has been going in sideways since approximately it's issuance.
I think it's performing a bullish pattern to target either a new ATH or to reach the tops.
Passing $0.74 is a confirmation of the idea.
Breaking $0.47 is a stop-loss and invalidates the idea.

EDUUSDT 3DEDU ~ 3D
#EDU retest this support block,. if you still have Conviction on this coin,. Buy in stages from here. With a short term target of at least 20%+
Alikze »» EDU | Descending channel🔍 Technical analysis: Descending channel
- It is moving in a descending channel in the 8H time frame.
- At the bottom of the channel, a strong buying pressure candle has been encountered.
- Currently, we have to wait for the failure of the supply zone to exit the downward channel.
- If the supply zone breaks, it can have the targets of 0.9769 and 1.1719.
💎 Alternative scenario: In addition, if it encounters selling in the middle of the channel and below the supply range, it can retest the bottom of the channel. The first target of the downtrend will be the 0.39 range.
»»»«««»»»«««»»»«««
Please support this idea with a LIKE and COMMENT if you find it useful and Click "Follow" on our profile if you'd like these trade ideas delivered straight to your email in the future.
Thanks for your continued support.
Best Regards,❤️
Alikze.
»»»«««»»»«««»»»«««

Mastering the Risk/Reward Ratio: A Key to Trading ProfitabilityMastering the Risk/Reward Ratio: A Key to Trading Profitability
In the world of trading, achieving success isn't merely about selecting the right stocks or making spot-on predictions. True profitability lies in managing risk effectively, a skill that can be the difference between sustained growth and heavy losses. A primary tool for this is the risk/reward ratio—a fundamental element in a trader’s toolkit. This metric helps traders maintain discipline and clarity, ensuring each trade has a strong potential for profit while keeping possible losses in check.
Whether you’re new to trading or have years of experience, understanding and using the risk/reward ratio can transform your approach. It’s not about maximizing the number of wins but ensuring that the rewards consistently outweigh the risks. Here, we’ll explore how this ratio impacts trading strategy and why it’s critical for long-term success.
Understanding the Risk/Reward Ratio
The risk/reward ratio is a straightforward formula that compares the profit potential of a trade to its possible loss. Essentially, it answers the question: How much can I gain for every dollar I risk?
For example, if you're willing to risk $100 for a possible $300 gain, your risk/reward ratio is 1:3, meaning you could make $3 for every $1 at risk.
Example of a 1:3 risk-reward ratio in EUR/USD
This concept encourages traders to evaluate the potential downside of a trade before jumping in, moving away from focusing solely on potential gains. By keeping a balanced view of risk and reward, traders can avoid seemingly attractive trades that may carry excessive risk, enabling them to approach the market with a disciplined, long-term mindset.
Why Risk/Reward Matters
Every trade involves risk, and the ability to manage it effectively often differentiates successful traders from those who struggle. Using the risk/reward ratio ensures that each trade is structured with a clear plan, protecting capital while allowing for potential profits. Without this focus on risk, traders may chase high returns without properly assessing the downside, leading to costly mistakes.
Combined with tools like stop-loss orders and position sizing, the risk/reward ratio becomes part of a broader risk management strategy. These components work together to balance profit potential with loss control, which is essential for traders aiming to sustain profitability over time.
Here you can find a comprehensive article on stop-loss strategies.
Risk/Reward Ratio vs. Win Rate
A common misconception among novice traders is that trading success depends on winning more trades than losing ones. Experienced traders know that profitability has more to do with how risk is managed in losses than how many wins you achieve. The risk/reward ratio addresses this, making it possible to be profitable even if a trader wins less than half of their trades, as long as the wins are substantial enough to offset the losses.
For example, if a trader wins only 40% of the time but maintains a 1:3 risk/reward ratio, the profits from winning trades can cover losses from losing trades while still yielding an overall profit.
Here is a comprehensive table comparing risk/reward ratios to win rate profitability.
Advantages of a Disciplined Risk/Reward Approach
One of the most valuable benefits of using the risk/reward ratio is the structure it brings to trading. It helps traders stay rational and minimizes emotionally driven decisions, such as holding onto losing positions with the hope of a reversal. By maintaining a favorable risk/reward ratio, traders enter each trade with a defined plan, reducing the chance of impulsive, loss-heavy decisions.
Furthermore, applying a risk/reward framework ensures that trades are entered only when the reward justifies the risk. Over time, this disciplined approach fosters consistency and sets the stage for more predictable results.
Steps to Calculate Risk/Reward Ratio
Calculating the risk/reward ratio is a simple yet impactful process that enhances trade planning. Here’s a step-by-step guide:
1- Determine Your Risk: Define the amount you’re willing to lose if the trade moves against you, which is the difference between your entry price and stop-loss level.
2- Define Your Reward: Establish the potential profit if the trade goes in your favor, measured from the entry price to your target profit level.
3- Calculate the Ratio: Divide the potential reward by the potential risk to get your risk/reward ratio.
For instance, if you’re buying a stock at $100 with a stop-loss at $95, your risk is $5. If you aim to sell at $115, your reward is $15, giving you a 1:3 risk/reward ratio.
Choosing an Ideal Risk/Reward Ratio
The ideal risk/reward ratio can vary based on trading style and goals, though many traders aim for a minimum of 1:2 or 1:3. Higher ratios like 1:3 allow for a more forgiving approach to losses, where a trader doesn’t need a high win rate to be profitable. However, shorter-term traders might use lower ratios (e.g., 1:1.5) while aiming for a higher win rate to balance profitability.
Ultimately, the best ratio depends on factors like trading frequency, volatility, and risk tolerance. Day traders may prefer a 1:2 ratio, allowing for quicker exits with decent returns. Swing traders, on the other hand, might look for a 1:3 ratio or higher to justify holding positions longer despite potential market fluctuations.
Managing Risk with the Right Tools
Achieving long-term profitability requires more than just a favorable risk/reward ratio; it also demands effective risk management. Stop-loss orders, for instance, are invaluable for capping potential losses. Placing stops at logical price points, such as below support levels or above resistance levels, helps protect positions without risking premature exits.
Similarly, maintaining discipline by skipping trades that don’t meet your risk/reward criteria can prevent excessive losses. Proper position sizing and a detailed trading plan round out this approach, ensuring that each trade aligns with your overall strategy and risk tolerance.
Here is a comprehensive guide about the Risk Management
Final Thoughts: The Power of the Risk/Reward Ratio in Trading
The risk/reward ratio is more than a calculation—it’s a mindset that can lead to stronger, more disciplined trading decisions. By assessing potential risks and rewards before each trade, you can avoid impulsive choices and safeguard your capital. This approach brings clarity and control to trading, even amid market unpredictability.
While the risk/reward ratio may be a straightforward tool, its impact is profound. Focusing on balancing risk with reward enables traders to protect themselves from major losses while pursuing worthwhile gains. The next time you plan a trade, remember to ask: “Does this meet my risk/reward criteria?” If not, stepping back could be the wisest move.
Risk management is essential for lasting success, and the risk/reward ratio serves as a constant guide. Consistently applying this ratio fosters discipline, confidence, and, ultimately, greater profitability in your trading journey.
✅ Please share your thoughts about this article in the comments section below and HIT LIKE if you appreciate my post. Don't forget to FOLLOW ME; you will help us a lot with this small contribution.

Patience Pays Off: Key Strategies for Long-Term InvestorsInvesting is a fundamental pillar in building wealth and securing financial stability. Among the myriad strategies available, long-term investing stands out as one of the most reliable and rewarding. Unlike short-term trading, which seeks to capitalize on price fluctuations over days or weeks, long-term investing focuses on holding assets for several years, or even decades, to allow for substantial growth. This approach is deeply rooted in the principle of patience, which enables investors to navigate market volatility, leverage compounding returns, and achieve their financial goals.
Patience is more than simply waiting; it requires discipline, confidence, and the ability to withstand short-term market turbulence. For long-term investors, patience plays a key role in benefiting from compounding returns, reducing transaction costs, and minimizing tax liabilities. The patience-driven investor is less prone to impulsive decisions and is better positioned to reach financial success over time.
Understanding Long-Term Investing
Long-term investing involves purchasing and holding assets like stocks, bonds, mutual funds, or real estate for extended periods—typically five years or more. The main objective is to benefit from the growth of the investment over time, whether through capital appreciation, dividends, or interest. Unlike short-term strategies, which aim for quick profits, long-term investing emphasizes steady and sustainable growth.
Key to this approach is the power of compounding. Compounding occurs when earnings from investments are reinvested, generating additional returns. Over time, this snowball effect can lead to exponential growth. Long-term investing also benefits from lower transaction costs, as frequent buying and selling of assets is avoided. Furthermore, long-term capital gains are taxed at lower rates than short-term gains, offering additional financial advantages.
While long-term investing still carries risks, particularly during market downturns, it provides the potential for recovery and continued growth. In contrast, short-term investors may face higher volatility and risk due to frequent trades and quick shifts in market sentiment.
S&P500 from 1980 monthly chart
Advantages of Long-Term Investing
The long-term investing approach comes with several compelling advantages:
Compounding Returns: The most powerful advantage of long-term investing is the compounding effect, where reinvested earnings generate additional returns. The longer the investment period, the more significant the compounding becomes. Even modest returns can lead to considerable wealth over time.
Lower Costs: With fewer trades, long-term investors incur significantly lower transaction fees and commissions. This not only preserves capital but also enhances overall returns.
Tax Efficiency: Long-term capital gains are generally taxed at a lower rate than short-term gains, leading to more favorable after-tax returns. The buy-and-hold strategy reduces the frequency of taxable events.
Reduced Stress: Long-term investing minimizes the need for constant market monitoring, providing peace of mind. Investors don’t need to react to daily market swings, allowing them to remain focused on their long-term financial goals.
Alignment with Financial Goals: Long-term investing is well-suited for achieving major financial milestones, such as funding retirement, education, or home purchases. It provides a structured and systematic approach to accumulating wealth over time.
GC1! GOLD FUTURES From 1980 Monthly Chart
Why Patience is Essential in Long-Term Investing
Patience is the cornerstone of long-term investing, as it helps investors remain focused on their goals despite market fluctuations and emotional pressures. Here are key reasons why patience is critical:
1. Navigating Market Volatility
Financial markets are inherently volatile, with asset prices fluctuating due to economic data, geopolitical events, and shifts in investor sentiment. While short-term investors may react to these movements, long-term investors recognize that volatility is part of the market cycle. Patience allows them to ride out these fluctuations, avoiding impulsive decisions and giving their investments time to recover and grow. By not panicking during downturns, long-term investors can stay committed to their strategy and avoid selling assets at a loss.
2. Compounding Returns
Patience is vital in maximizing the benefits of compounding. Compounding requires time to work its magic, as reinvested earnings generate further returns. The longer an investor remains in the market, the greater the potential for compounding to significantly boost their wealth. Even modest annual returns can accumulate into substantial wealth over decades.
3. Behavioral Finance and Emotional Control
Investing often involves emotional decision-making driven by fear, greed, and market noise. Behavioral finance studies show that emotions like panic during market downturns or overconfidence during rallies can lead to poor investment decisions. Patience helps investors manage these emotions by keeping their focus on long-term goals rather than short-term market movements. Investors who remain patient and disciplined are more likely to make rational decisions that align with their overall strategy.
NDX Nasdaq 100 Index Monthly Chart
Strategies to Cultivate Patience in Investing
Maintaining patience as a long-term investor requires a combination of strategies that foster discipline and reduce emotional reactivity:
1. Set Realistic Expectations
Establishing clear, realistic financial goals helps investors stay grounded. Understanding that markets fluctuate and that significant returns take time can reduce impatience. Setting specific goals, such as saving for retirement over a 20- or 30-year period, provides a long-term perspective and a framework for measuring progress.
2. Regular Monitoring Without Overreacting
While it's important to monitor your portfolio, it’s equally important to avoid overreacting to short-term market moves. Periodic reviews, such as quarterly or annual check-ins, allow investors to assess performance without being influenced by daily volatility. By maintaining a big-picture view, investors can avoid impulsive decisions and stay on track with their goals.
3. Diversification
Diversification spreads risk across various asset classes, sectors, and regions, helping to reduce the impact of poor performance in any single investment. A well-diversified portfolio provides a smoother experience, allowing investors to remain patient even during periods of underperformance in certain areas.
4. Continuous Learning and Education
Staying informed about market trends and investment strategies helps investors feel more confident in their decisions. The more knowledge an investor has about market behavior, historical trends, and the benefits of long-term investing, the more patient they can remain during challenging times. Education empowers investors to understand that short-term volatility is part of the process.
Case Studies and Historical Examples
Several well-known examples illustrate the power of patience in long-term investing:
Warren Buffett: One of the most famous proponents of long-term investing, Warren Buffett has built his wealth through patience and disciplined investing. His purchase of Coca-Cola shares in 1988 is a prime example. Despite periods of market volatility, Buffett held his shares, allowing the company's growth and compounding returns to generate significant wealth.
KO Coca-Cola Monthly Chart
Index Funds: Index funds, which track major market indices like the S&P 500, demonstrate the benefits of long-term investing. Over decades, these funds have delivered solid returns, often outperforming actively managed funds. Investors who stay invested in index funds, even during market downturns, benefit from overall market growth.
Common Pitfalls and How to Avoid Them
While patience is key, there are common mistakes that can derail long-term investing:
Panic Selling: Investors who panic during market downturns often sell at a loss, only to see the market recover later. Staying patient and focused on long-term goals helps avoid this costly mistake.
Trying to Time the Market: Attempting to predict market highs and lows is a risky strategy that often leads to missed opportunities. Staying invested allows investors to benefit from overall market growth without the risk of mistimed trades.
Overtrading: Frequent buying and selling erode returns through higher transaction costs and taxes. A buy-and-hold approach helps preserve capital and reduces unnecessary trading.
Conclusion
Patience is not just a virtue in long-term investing—it is a necessity. By maintaining discipline, staying focused on long-term goals, and avoiding emotional reactions to market volatility, investors can harness the full potential of compounding returns and achieve financial success. The strategies of setting realistic expectations, diversifying, and staying informed provide the foundation for a patient, long-term approach to wealth building. Through patience, long-term investors can navigate the ups and downs of the market and emerge with a stronger financial future.

#EDU/USDT#EDU
The price is moving in a descending channel on the 4-hour frame upwards and is expected to continue
We have a trend to stabilize above the moving average 100 again
We have a downtrend on the RSI indicator that supports the rise by breaking it upwards
We have a support area at the lower limit of the channel at a price of 0.4800
Entry price 0.5200
First target 0.5791
Second target 0.6285
Third target 0.7047

EDU Looks bullishFrom where we put the red arrow on the chart, it looks like a FLAT pattern is formed on the chart. The FLAT pattern has 3 ABC waves.
Wave C, which was a terminal pattern, has now ended and the price can move higher.
The targets are marked on the chart.
Closing a daily candle below the invalidation level will violate the analysis
For risk management, please don't forget stop loss and capital management
When we reach the first target, save some profit and then change the stop to entry
Comment if you have any questions
Thank You

These Market Structures Are Crucial for EveryoneIn this article, we will simplify complex market structures by breaking them down into easy-to-understand patterns. Recognizing market structure can enhance your trading strategy, increase your pattern recognition skills in various market conditions. Let’s dive into some essential chart patterns that every trader should know.
Double Bottom / Double Top
A double bottom is a bullish reversal pattern that occurs when the price tests a support level twice without breaking lower, indicating strong buying interest. This pattern often suggests that the downtrend is losing momentum and a potential uptrend may follow. Conversely, a double top signals a bearish reversal, formed when the price tests a resistance level twice without breaking through. This pattern indicates selling pressure and suggests that the uptrend may be coming to an end.
Bull Flag / Bear Flag
A bull flag is a continuation pattern that appears after a strong upward movement. It typically involves a slight consolidation period before the trend resumes, providing a potential entry point for traders looking to capitalize on the ongoing bullish momentum. On the other hand, a bear flag forms during a downtrend, signaling a brief consolidation before the price continues its downward movement. Recognizing these flags can help traders identify potential breakout opportunities.
Bull Pennant / Bear Pennant
A bull pennant is a continuation pattern that forms after a sharp price increase, followed by a period of consolidation where the price moves within converging trendlines. This pattern often indicates that the upward trend is likely to continue after the breakout. Conversely, a bear pennant forms after a sharp decline, with the price consolidating within converging lines. This pattern suggests that the downtrend may resume after the breakout.
Ascending Wedge / Descending Wedge
An ascending wedge is a bearish reversal pattern that often forms during a weakening uptrend. It indicates that buying pressure is slowing down, and a reversal may be imminent. Traders should be cautious as this pattern suggests a potential downtrend ahead. In contrast, a descending wedge appears during a downtrend and indicates that selling pressure is weakening. This pattern may signal a bullish reversal, suggesting a possible upward breakout in the near future.
Triple Top / Triple Bottom
A triple top is a bearish reversal pattern that forms after the price tests a resistance level three times without breaking through, indicating strong selling pressure. This pattern can help traders anticipate a potential downtrend. Conversely, a triple bottom is a bullish reversal pattern where the price tests support three times before breaking higher. This pattern highlights strong buying interest and can signal a significant upward move.
Cup and Handle / Inverted Cup and Handle
The cup and handle pattern is a bullish continuation pattern resembling a rounded bottom, followed by a small consolidation phase (the handle) before a breakout. This pattern often indicates strong bullish sentiment and can provide a solid entry point. The inverted cup and handle is the bearish counterpart, signaling potential downward movement after a rounded top formation, suggesting that a reversal may occur.
Head and Shoulders / Inverted Head and Shoulders
The head and shoulders pattern is a classic bearish reversal signal characterized by a peak (head) flanked by two smaller peaks (shoulders). This formation indicates a potential downtrend ahead, helping traders to identify possible selling opportunities. The inverted head and shoulders pattern serves as a bullish reversal indicator, suggesting that an uptrend may follow after the price forms a trough (head) between two smaller troughs (shoulders).
Expanding Wedge
An expanding wedge is formed when price volatility increases, characterized by higher highs and lower lows. This pattern often indicates market uncertainty and can precede a breakout in either direction . Traders should monitor this pattern closely, as it can signal potential trading opportunities once a breakout occurs.
Falling Channel / Rising Channel / Flat Channel
A falling channel is defined by a consistent downtrend, with price movement contained within two parallel lines. This pattern often suggests continued bearish sentiment. Conversely, a rising channel indicates an uptrend, with price moving between two upward-sloping parallel lines, signaling bullish momentum. A flat channel represents sideways movement, indicating consolidation with no clear trend direction, often leading to a breakout once the price escapes the channel.
P.S. It's essential to remember that market makers, whales, smart investors, and Wall Street are well aware of these structures. Sometimes, these patterns may not work as expected because these entities can manipulate the market to pull money from unsuspecting traders. Therefore, always exercise caution, and continuously practice and hone your trading skills.
What are your thoughts on these patterns? Have you encountered any of them in your trading? I’d love to hear your experiences and insights in the comments below!
If you found this breakdown helpful, please give it a like and follow for more technical insights. Stay tuned for more content, and feel free to suggest any specific patterns you’d like me to analyze next!

EDU sell/short setup (1D)Note, this is not a buy/long setup but a sell/short setup.
The EDU token is building a large liquidity pool at the bottom, eventually, this liquidity pool will be broken.
Our big structure is a bear.
We have a good supply range on the chart that if the price reaches this area, we can look for sell/short positions.
For risk management, please don't forget stop loss and capital management
Comment if you have any questions
Thank You

#EDU/USDT#EDU
The price is moving within a descending channel pattern on the 4-hour frame, which is a retracement pattern
We have a bounce from a major support area in the color EUR at 0.5300
We have a tendency to stabilize above the Moving Average 100
We have a downtrend on the RSI indicator that supports the rise and gives greater momentum and the price is based on it
Entry price is 0.5760
The first target is 0.6700
The second target is 0.7526
The third goal is 0.8467

EDUUSDT.1DAs I analyze the EDU/USDT chart, a few critical elements stand out in the current technical setup:
Support and Resistance Levels:
Support Levels (S1, S2, S3): The primary support level (S1) is currently at $0.5329. This level needs to hold to prevent further declines toward S2 and S3, which are significantly lower. The breach of S1 could trigger a sell-off, making these lower supports relevant.
Resistance Levels (R1, R2): The immediate resistance (R1) is not visible on this chart, but R2 is placed at $0.7913, indicating a potential upside target if the market sentiment turns bullish and EDU can break past its nearest resistance.
Technical Indicators:
Relative Strength Index (RSI): The RSI is at 52.38, suggesting a relatively balanced market condition with no immediate overbought or oversold signals. This level indicates that there is potential for movement in either direction without much resistance from RSI extremes.
Moving Average Convergence Divergence (MACD): The MACD is hovering just below the signal line but above zero, which suggests slight bearish momentum but not strong enough for significant concern. The proximity to the signal line also indicates potential for a reversal if bullish momentum picks up.
From this technical perspective, the strategy would be to closely monitor the $0.5329 support. If this level holds, it could serve as a springboard for price to test upper resistances, particularly aiming for a breakout above the nearest resistance level to target R2 at $0.7913. Given the current MACD and RSI readings, there's a cautious optimism that suggests a balanced approach, preparing for both potential advancement or retraction based on how strongly the price reacts at these key levels.
However, should S1 fail, the downside risk increases, and it would be wise to consider defensive measures such as tightening stop-loss orders to protect against a sharper decline. The neutrality shown by the RSI provides the flexibility to adapt quickly to changes, and thus, it's crucial to stay updated on any shifts in market dynamics that might influence EDU's price trajectory. This approach ensures readiness for either continuation of the current consolidation phase or a breakout/breakdown, depending on upcoming market developments.

The price might approach the $0.65 support levelEDU has been trending lower after breaking the previous support level and exiting a consolidation range. This decline indicates increased selling pressure and a potential shift in market sentiment. The current resistance level is at $0.80, which acts as a ceiling preventing upward movement. The price is continuing to decline and may approach the support area around $0.65.

More Than Money 💸Hello, friends! 😊 What do you associate trading with? 🧐 For most of us it's exchanges and investments are primarily associated with big money. However, trading in the financial markets not only provides opportunities for earning but also for significant skill development and personal growth.
Here are the top 4 qualities that trading helps to develop:
1. Strategic thinking 🧠
Systematic approach and having a well-thought-out strategy distinguish a professional trader from a gambler. Seeing that Bitcoin is rising and immediately buying it – that's not how it works: You need to follow rules to earn not situatively, but in the long term. First and foremost, adhere to risk management, which determines 90% of success.
The main rules of risk management in trading that are useful in any endeavor:
In trading: Invest no more than 1-2% of your deposit in one trade.
In life: Don't put everything at stake for short-term gain: soberly assess what you can risk so you won't regret it later.
In trading: It's not so important how much you earn. It's more important how much you lose or don't lose.
In life: Weigh the pros and cons of every serious decision.
In trading: Diversify risks, invest in different instruments so that potential losses from one asset are offset by profits from another.
In life: Always have a plan B, and preferably plan C as well, to achieve your goal. Because if something can go wrong, it will.
In trading: Cut losses to a minimum, let profits grow.
In life: Don't waste energy, time, and resources on what doesn't bring benefits or doesn't work out. Strengthen what's strong: focus on what You do best.
2.Stress tolerance 🫨
Trading is not the easiest way to earn a living: you need to be mentally prepared for both profits and losses, not succumb to emotional impulses, and maintain self-control. Sometimes you have to " rise from the ashes " and start over from scratch. However, just like in life. Only 2-3% of traders have natural resilience: the rest need to develop it.
Here are some tips from me, which I have formulated from my own experience:
"To develop resilience, allow yourself to make mistakes, take on challenges, and solve complex problems. In doing so, you become stronger."
"Learn to be flexible, not confined to your internal boundaries. "
"Don't be afraid to be yourself, to develop internal freedom and individuality, so you can accept your mistakes without criticism. A successful trader is confident, free from societal judgment, and doesn't need to be perfect: they pursue their own goals, not dreams imposed by others."
3. Independence 🕊️
One of the main advantages of trading is freedom : there are no bosses above you, you manage your own time and resources, and you are solely responsible for your actions. You decide how, where, and how much to invest, what risks to take, and so on.
The ability to take responsibility for oneself, not blame others for one's mistakes, and be independent in decision-making is a quality that is valued not only in trading. Independent, self-aware individuals progress faster in their careers, build harmonious relationships, and establish large-scale businesses.
4. Developing 🎓
You can't learn trading once and for all: the market is not static, it's constantly changing. Yesterday, for example, only a few knew about cryptocurrencies, and today fortunes are made on them.
So don't miss the opportunity to learn more , interact with like-minded individuals. Thanks to the Trading View platform for providing such an opportunity. Here You can create your own charts, see what others think, and study educational content.
In conclusion , folks, trading is a unique simulator that develops discipline, forecasting skills, responsibility, independence, psychological resilience, and a drive for self-improvement. All You need is diligence, discipline, and a community of like-minded people! Wishing You success!😘
🫶If You found this post interesting, hit the like button or as it's called now (boost) and subscribe so You won't miss out!
Always sincerely yours, Kateryna💙💛

#EDU/USDT#EDU
We have a bearish channel pattern on a 4-hour frame, the price moves within it and adheres to its limits well
We have a green support area at 0.4900 after the price touched it and bounced from it
We have a tendency to stabilize above moving average 100
We have an uptrend on the RSI indicator that supports the price higher
Entry price is 0.5133.
The first target is 0.5575
The second target is 0.6000
The third target is 0.6455
