EDU previous top is now the bottom?EDU
Today is coming down to price of $108 area where it was the top resistance back in July and Aug. Watch closely if go back down to the previous range or stay above $108.
EDU

$EDU: Top of the range with odd fundamentals$EDU has tested and failed at the $108 level for the 3x in 20 months. Short-term price action has confirmed a break in the immediate trend.
This is a company which has sacrificed margins for earnings growth. Earnings growth is at +1 standard deviation while operating margins have crashed from 22.5% (end 2009) to a miserable 8.9%, at -2 standard deviation level. Either competition is too severe in the after school learning space (it is a very fragmented space) or $EDU has lots of under-utilized learning centers which is dragging on margins. Furthermore, you have a company whose operating profits growth is slowing while eps growth is increasing???
With funny numbers, weak markets, weak spending power in China, weak USDCNY (EDU earns RMB reports in USD) and near +1 standard deviation valuations, I smell blood.

BTC IN END OF 2018DO NOT MAKE ANY TRADES BASED ON THIS IDEA. DYOR!
hey guys. as we see BTC fails to break the triangle once again and goes to support zone. In my opinion i think with RED Strategy BTC will fall to 5800-5600 support zone and then bounce back to the hypotenuse of the triangle. if it succeed we go to BLUE strategy and a bounce to mid support zone is expected and then we go GREEN . We have a minor resistance in GREEN strategy and i hope we can pass this and go further. I will track and update this post. it will be very helpful if you write your opinions and tell me if i'm wrong or some.
Good Luck!

Support & ResistanceSupport and resistance levels are critical in financial markets.
They are very similar to pivot points, except simpler.
When the price of a pair goes up to $10,000 and goes down to $9000 USD, that $10,000 USD zone is now resistance. If it bounces from $9000 and up to $11,000, the $9000 level is now support and the $10,000 resistance is now broken and could potentially turn support, where it can bounce.
Generally, for resistance or support to break, a candle has to close above or below support and resistance. A wick above either is only the price “testing” resistance.
I generally wait for a close above / below as well as further movement in the same direction, and a possible volume break-out short term.
This is because a close above / below itself can be a fake-out, or a fake breakout, and continue doing what it originally was.The blue box is an example of a fake-out.
The more often support and resistance is tested, the stronger it is.
The stronger support or resistance zones are, the stronger they will break out.
For example, if a support is tested 5 times and breaks to the downside, it will move down further than for example, if it was tested 2 or 3 times.
Next post we will get into support or resistance zones and also examples on how to trade them.

EDU beastchinese names have been hot lately I entered at 53 because of the enormous resistance level (top trend line). and strong support(bottom trend line). It's just been beasting and i wouldnt recommend buying after such a big move. Don't need excess indicators ke NYSE:EDU ep it simple.

EDU - Upward channel breakdown trade from $41.57 to $37.33EDU broken down from a long term upward channel.Retested it & seems rolling over. We think it will be good short from here.
Trade Criteria
Entry Target Criteria- Break of $41.57
Exit Target Criteria- $37.33
Stop Loss Criteria- $43.13
Option: $40 Apr-17 Puts
You can check detailed analysis on EDU in the trading room/ Executive summary link here-
www.youtube.com
Time Span- 10:10"
Trade Status: Pending

EDU Correction is not over yetBased on the slope of the first down wave, there must be another one coming soon. Waiting for a better entry.


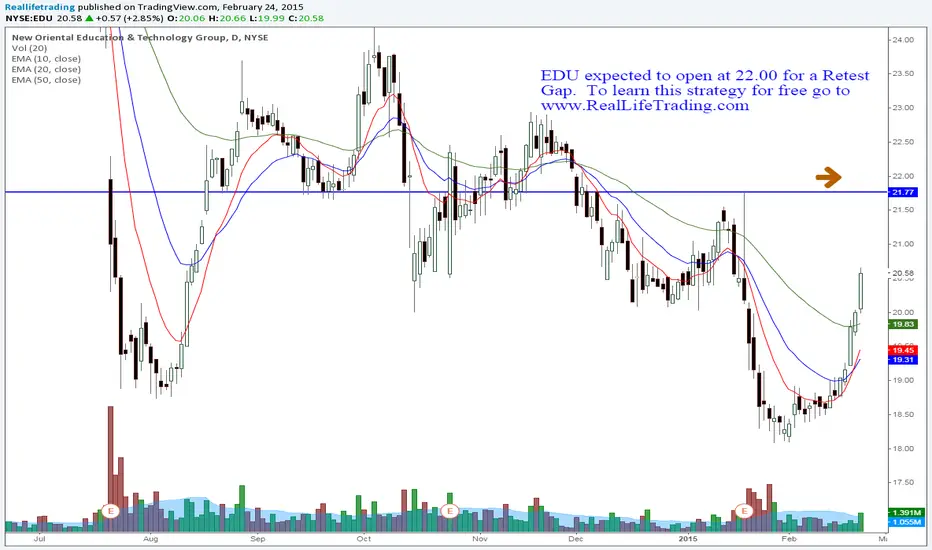
EDU Day Trade Retest Gap (Brad Reed Feb24,2015)EDU expected to open at 22.00 for a Retest Gap. To learn this strategy for free go to www.RealLifeTrading.com
Missed OpportunityLast summer I was learning about Stock Screeners and was playing around with the tool. I had inputted some very difficult ranges for several evaluation categories.
I followed the stock for a little while and then gave up, only now following up.
Missed Opportunity as it was a strick set of criteria (almost impossible) I had inputted into the screener. I actually thought it was to good to be true as the TSM and EDU (both NYSE) were the only stocks that appeared in the results.
EDU went from $22 to $34 in about 6 months. Wow, I have to believe!
