14-Day Mindset Challenge: Become a Top Trader — Day 114 Days. Challenge: How to Become a Mindset-Strong Trader
Day 1: The Power of Physical Exercise in Enhancing Trading Performance
Embarking on a trading journey demands more than just technical knowledge and market analysis; it requires a resilient and focused mindset. One often overlooked but incredibly powerful tool to develop this mental strength is physical exercise. Regular movement not only benefits your body but also profoundly influences your mental clarity, emotional stability, and overall performance as a trader.
When you engage in physical activity, your brain releases a cascade of chemicals that improve mood, focus, and resilience—crucial qualities for navigating the volatile world of trading. Think of your body and mind as interconnected systems: by strengthening your physical health, you lay a solid foundation for a sharper, more disciplined trading mindset. Over the next 14 days, committing to a simple, consistent exercise routine can transform how you approach your trading sessions, helping you stay calm under pressure, make better decisions, and recover quickly from setbacks.
Let's start!
How Physical Exercise Improves Your Trading Results
1. Boosts Endorphin Production for Positive Feelings
One of the most immediate benefits of exercise is the release of endorphins—natural chemicals that promote feelings of happiness and reduce stress and pain. This positive mood boost helps traders maintain a calm and focused mindset, even amidst market volatility. Scientific studies have shown that regular physical activity increases endorphin levels, which can combat anxiety and improve overall emotional resilience.
2. Enhances Insulin Activity and Energy Levels
Exercise improves insulin sensitivity, enabling your body to more efficiently process glucose for energy. This increased metabolic efficiency helps combat fatigue and sustains mental alertness during prolonged trading sessions. Research indicates that physically active individuals experience higher energy levels and better stamina, which are vital for maintaining attention and decision-making capacity.
3. Reduces Disease Risk and Promotes Long-Term Health
Regular physical activity reduces the risk of cardiovascular disease, diabetes, and other chronic health issues. By maintaining good health, traders are less likely to experience unexpected absences due to illness and can trade consistently over time. Scientific evidence supports that healthier individuals have better cognitive function and emotional stability, both crucial for trading success.
4. Boosts Brain Health and Cognitive Function
Exercise increases heart rate and blood flow, delivering more oxygen and nutrients to the brain. Numerous studies have demonstrated that physical activity stimulates the growth of new neural connections and enhances neuroplasticity—the brain’s ability to adapt and learn. This leads to improved memory, concentration, and problem-solving skills, all essential for analyzing markets and executing trades efficiently.
5. Enhances Stress Regulation and Emotional Control
Research shows that regular exercise helps regulate the hypothalamic-pituitary-adrenal (HPA) axis, which controls stress responses. By improving your body’s ability to handle stress, exercise reduces the likelihood of emotional reactions such as impulsivity or panic during trading. This emotional regulation is key to maintaining discipline and sticking to your trading plan under pressure.
6. Improves Sleep Quality
Quality sleep is fundamental for cognitive performance and emotional regulation. Scientific studies have consistently shown that physical activity, especially aerobic exercise, improves sleep quality and duration. Better sleep enhances focus, decision-making, and emotional resilience—traits that directly impact trading performance.
7. Promotes Neurotransmitter Balance
Exercise influences the production and regulation of neurotransmitters such as dopamine, serotonin, and norepinephrine. These chemicals play a vital role in mood, motivation, and alertness. Balanced neurotransmitter levels support a positive mindset, resilience to setbacks, and sustained motivation—key ingredients for consistent trading.
8. Increases Resilience to Market Stressors
Finally, regular physical activity builds overall resilience—both physically and mentally. This resilience helps traders recover quickly from losses, handle unexpected market shocks, and stay committed to their strategies without succumbing to frustration or panic.
Incorporating these scientifically-backed points emphasizes how exercise not only benefits physical health but also fundamentally enhances the mental and emotional capacities critical for successful trading.
Taking Action: Your 14-Day Exercise Implementation Plan
1. Decide Your Exercise Routine
Choose activities that you enjoy and can commit to every day for the next two weeks. Whether it’s walking, jogging, weightlifting, yoga, Pilates, push-ups, mountain climbers, or any other physical activity—what matters is consistency. Pick something that makes you feel energized and motivated.
2. Set a Daily Time Commitment
Determine how much time you can dedicate each day—start with 30 minutes to 1 hour. Make it a non-negotiable part of your daily schedule. For example, you might decide to go for a brisk walk in the morning, do bodyweight exercises at home, or hit the gym. The goal is to establish a routine that becomes a natural part of your day.
3. Use Reminders and Push Through Initial Discomfort
Especially during the first two weeks, it’s normal to feel some resistance or emotional stress about starting new habits. Set reminders on your phone or calendar to prompt you. Be patient and persistent—initial discomfort will fade as your body adapts. Once exercise becomes a habit, it will feel less like a chore and more like a source of strength.
Final Tips for Success
Start Small, Progress Gradually: Don’t overcommit at the beginning; build gradually to avoid burnout.
Stay Consistent: Consistency beats intensity—daily effort compounds over time.
Track Your Progress: Keep a journal or use an app to monitor your activity and observe how you feel over the days.
Enjoy the Process: Find joy in the movement itself. As it becomes part of your routine, you'll notice improvements not only physically but also in your trading mindset.
Conclusion
A 14-day commitment to physical exercise can be a game-changer for your trading mindset. By boosting endorphins, increasing energy, enhancing brain function, and reducing health risks, you set the stage for more disciplined, confident, and resilient trading. Embrace this challenge—your mind and your portfolio will thank you.
✅ Follow me and save this educational post: "14-Day Mindset Challenge: Become a Top Trader — Day 1". Tomorrow, I'll be releasing Day 2 of the transformation... Stay tuned!
✅ Please share your thoughts about this article in the comments section below and HIT LIKE if you appreciate my post. Don't forget to FOLLOW ME; you will help us a lot with this small contribution.
Educacion

The Dangers of Holding Onto Losing Positions...One of the most common — and costly — mistakes in trading is holding onto a losing position for too long. Whether it's driven by hope, ego, or fear, this behavior can damage your portfolio, drain your capital, and block future opportunities. Successful trading requires discipline, objectivity, and the willingness to accept when a trade isn’t working. Understanding the risks behind this behavior is essential to protecting your capital and evolving as a trader.
-- Why Traders Hold Onto Losing Trades --
It’s not always poor strategy or lack of experience that keeps traders locked in losing positions — it’s often psychology. Several cognitive biases are at play:
1. Loss Aversion
Loss aversion refers to our instinctive desire to avoid losses, often stronger than the desire to realize gains. Traders may hold onto a losing position simply to avoid the emotional pain of admitting the loss, hoping the market will eventually turn in their favor.
2. Overconfidence
When traders are overly confident in their analysis or trading thesis, they can become blind to changing market conditions. This conviction may cause them to ignore red flags and hold on out of sheer stubbornness or pride.
3. The Sunk Cost Fallacy
This is the belief that since you’ve already invested money, time, or effort into a trade, you need to keep going to “get your investment back.” The reality? Past investments are gone — and continuing the position often compounds the loss.
These mental traps can distort decision-making and trap traders in unproductive or damaging positions. Being aware of them is the first step toward better judgment.
-- The True Cost of Holding Losing Positions --
Holding onto a bad trade costs more than just the money it loses. It impacts your entire trading strategy and limits your growth. Here’s how:
1. Opportunity Cost
Capital tied up in a losing trade is capital that can’t be used elsewhere. If you keep $8,000 in a stock that’s fallen from $10,000 — hoping it rebounds — you're missing out on placing that money in higher-performing opportunities. Inactive capital is wasted capital.
2. Deeper Compounding Losses
A 20% loss doesn’t sound catastrophic until it becomes 30%… then 40%. The deeper the loss, the harder it becomes to break even. Holding out for a recovery often makes things worse — especially in markets with high volatility or downtrends.
3. Reduced Liquidity
Successful traders rely on flexibility. When your funds are tied up in a losing position, you limit your ability to respond to new opportunities. In fast-moving markets, this can be the difference between success and stagnation.
Recognizing these costs reframes the decision from “holding on until it turns around” to “preserving capital and maximizing potential.”
Consider this simple XAUUSD (Gold) weekly chart example. If you base a trading strategy solely on the Stochastic oscillator (or any single indicator) without backtesting and ignoring the overall trend, focusing solely on overbought signals for reversals, you'll quickly see the oscillator's frequent inaccuracies. This approach will likely lead to substantial and prolonged losses while waiting for a reversal that may never occur.
-- Signs It’s Time to Exit a Losing Trade --
The hardest part of trading isn’t opening a position — it’s closing a bad one. But if you know what to look for, you’ll know when it’s time to let go:
1. Emotional Attachment
If you find yourself feeling “married” to a trade, it’s a warning sign. Traders often assign meaning or identity to a position. But trading should be based on data and strategy, not sentiment.
2. Ignoring or Adjusting Your Stop Loss
Stop Loss orders exist for a reason: to protect your capital. If you habitually move your stop further to avoid triggering it, you’re letting hope override risk management.
3. Rationalizing Losses
Statements like “It’ll bounce back” or “This company always recovers” can signal denial. Hope is not a strategy. When you catch yourself justifying a bad position without objective reasoning, it’s time to reevaluate.
Consider also reading this article:
-- How to Cut Losses and Move Forward --
Cutting a loss isn’t a failure — it’s a skill. Here are proven techniques that help you exit with discipline and confidence:
1. Use Stop Losses — and Respect Them
Set a Stop Loss at the moment you enter a trade — and stick to it. It takes the emotion out of the exit and protects your downside. Moving the stop is the fastest path to deeper losses.
2. Trade With a Plan
Every trade should be part of a bigger strategy that includes risk tolerance, entry/exit points, and profit targets. If a position hits your predetermined loss threshold, exit. Trust your system.
3. Apply Position Sizing and Diversification
Never risk more than a small percentage of your capital on a single trade. Keep your portfolio diversified across different instruments or sectors to avoid one position derailing your progress.
4. Review and Reflect
Post-trade analysis is vital. Review both wins and losses to learn what worked — and what didn’t. This practice sharpens your strategy and builds emotional resilience over time.
-- Why Cutting Losses Strengthens Your Portfolio --
There’s long-term power in letting go. Here’s what cutting losses early can do for you:
1. Preserve Capital
The faster you cut a losing trade, the more capital you retain — and the more opportunities you can pursue. Capital preservation is the foundation of longevity in trading.
2. Reduce Emotional Stress
Sitting in a losing trade weighs heavily on your mindset. The stress can cloud your judgment, increase risk-taking, or cause hesitation. Exiting early reduces this emotional drag and keeps you clear-headed.
3. Reallocate to Better Setups
Exiting losing trades frees up both capital and mental energy for higher-probability opportunities. This proactive approach builds momentum and reinforces the idea that it’s okay to be wrong — as long as you act decisively.
Consider also reading this article:
-- Final Thoughts: Discipline Over Denial --
Holding onto losing trades may feel like you're showing patience or commitment — but in reality, it's often denial wrapped in hope. Trading is about probabilities, not guarantees. The most successful traders aren’t the ones who win every trade — they’re the ones who manage losses with discipline.
Letting go of a bad trade is a show of strength, not weakness. It’s a deliberate choice to protect your capital, stay agile, and refocus on trades that serve your goals. The market doesn’t owe you a comeback — but with a clear head and disciplined approach, you can always find your next opportunity.
✅ Please share your thoughts about this article in the comments section below and HIT LIKE if you appreciate my post. Don't forget to FOLLOW ME; you will help us a lot with this small contribution.
#EDU/USDT#EDU
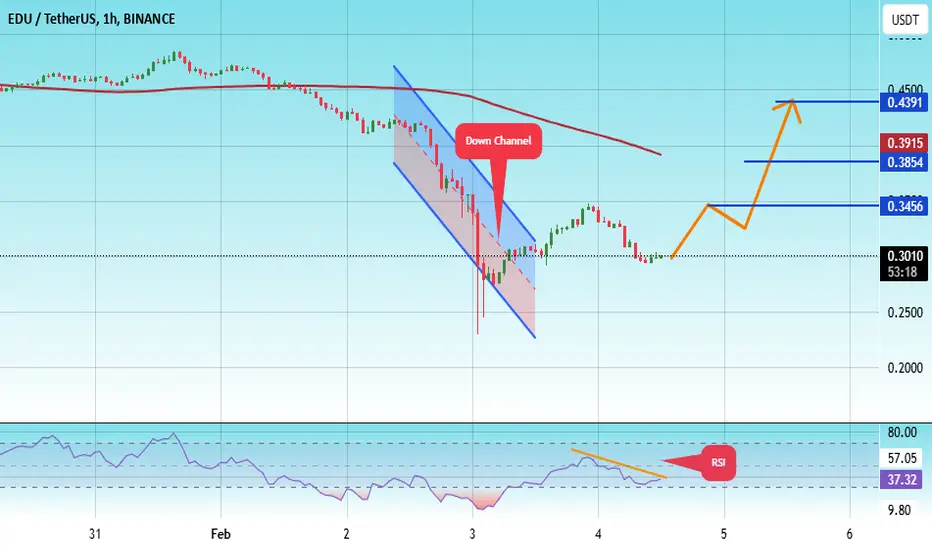
The price is moving in a descending channel on the 1-hour frame and is adhering to it well and is heading to break it strongly upwards and retest it
We have a bounce from the lower limit of the descending channel, this support is at a price of 0.2300
We have a downtrend on the RSI indicator that is about to break and retest, which supports the rise
We have a trend to stabilize above the moving average 100
Entry price 0.2997
First target 0.3456
Second target 0.3854
Third target 0.4391
#EDU/USDT#EDU
The price is moving within a descending channel on the 1-hour frame, adhering well to it, and is on its way to breaking it strongly upwards and retesting it.
We are seeing a rebound from the lower boundary of the descending channel, which is support at 0.1430.
We have a downtrend on the RSI indicator that is about to break and retest, supporting the upward trend.
We are looking for stability above the 100 Moving Average.
Entry price: 0.1480
First target: 0.1511
Second target: 0.1540
Third target: 0.1580

Impulsive Trading:Understanding the Risks and Regaining ControlHave you found yourself hastily clicking the “Buy” or “Sell” button only to be engulfed by regret almost immediately afterward? If so, you're in good company 😃.
Impulsive trading is a widespread issue that affects traders of all experience levels, often leading to significant financial losses. Studies reveal that a considerable portion of traders battle with impulsive decision-making, which can drastically influence their overall financial health.
Impulsive trading typically arises from emotions rather than careful market analysis or strategic planning. Factors such as the fear of missing out (FOMO), frustration after a loss, or the temptation of quick profits often cloud judgment, resulting in decisions that deviate from disciplined trading practices. This behavior is especially pronounced during volatile market conditions, where emotions can run high. Acknowledging the signs of impulsive trading is essential for fostering discipline and achieving sustained trading success.
Understanding the Risks of Impulsive Trading
The implications of impulsive trading reach far beyond individual poor trades. Each impulsive action can generate a cascade of errors, diverting traders from their predefined strategies. Engaging in impulsive trading often leads to overtrading, where traders make numerous trades in quick succession while hoping for fast returns, ultimately resulting in mounting losses. This not only increases exposure to market volatility but also raises transaction costs, systematically eroding any potential gains.
Another major risk associated with impulsive trading is flawed decision-making. Actions born out of emotional responses lack the rational foundation necessary for sound trading, pushing traders towards choices that diverge from their overall objectives. For instance, abandoning a Stop Loss order or ramping up position sizes following a loss can lead to dramatic financial damage. Moreover, the psychological impact of impulsive trading can result in burnout, heightened stress, and diminished confidence, all of which threaten a trader's long-term viability. Recognizing and understanding these risks highlights the need for self-regulation and a disciplined approach—critical elements for successful trading.
Psychological Triggers Behind Impulsive Trading
The tendency to trade impulsively often stems from various psychological factors that can be difficult to manage. One of the main culprits is the fear of missing out (FOMO); in fast-paced markets, traders may feel an urgent need to enter positions quickly to seize potential profits. This urgency can lead to ill-timed trades, making them more vulnerable to reversals.
Greed is another significant factor that plays a role in impulsive trading. The relentless pursuit of maximizing profits can quickly overshadow a trader’s original plan. As a result, they may prolong a successful trade or increase leverage in hopes of capturing even greater returns, leading to heightened risks. Loss aversion, the instinct to avoid losing money, also contributes to impulsivity. When faced with setbacks, traders might engage in “revenge trading,” making rash decisions in an attempt to recover losses—often dismissing their foundational analytical methods.
External factors like social media and market news also amplify these emotional triggers. The overload of information—from Twitter updates to various trading forums—can create a sense of urgency and spur impulsive behavior, even among experienced traders. By acknowledging these psychological influences, traders can cultivate a more deliberate and strategic approach to their decision-making processes.
Read also:
Identifying Impulsive Trading Behavior
Recognizing the signs of impulsive trading is crucial for anyone looking to regain control and establish a more strategic trading method. Indicators of such behavior include:
- Ignoring Your Trading Plan: Frequently deviating from established entry and exit criteria in favor of fleeting emotions can indicate a pattern of impulsivity.
- Constantly Monitoring Trades: Habitually checking price movements or refreshing trading platforms often suggests an emotional attachment to positions, prompting unnecessary reactions to minor fluctuations.
- Execution of Unplanned Trades: Making trades without forethought, especially after emotional highs from winning trades or lows from losses, disrupts a carefully crafted trading plan and exposes one to greater risks.
- Neglecting Risk Management Practices: Exceeding leverage limits or disabling Stop Loss orders indicates a tendency to focus on immediate gains rather than sustainable trading strategies.
By becoming aware of these behaviors and taking deliberate steps to reflect on each trade's alignment with the overarching strategy, traders can minimize impulsivity and foster a disciplined mindset grounded in rationality.
Read Also:
Strategies for Overcoming Impulsive Trading
Successfully overcoming impulsive trading requires a blend of discipline, self-awareness, and effective strategies. Here are some actionable steps:
1. Set Clear Entry and Exit Criteria: Define explicit guidelines for entering and exiting trades, based on predetermined market conditions or technical indicators. Adhering to these rules minimizes the likelihood of impulsive actions.
2. Employ Stop Loss Orders: Utilize Stop Loss orders to automatically close trades when certain price levels are met. This helps protect against significant losses and allows traders to step back from their positions.
3. Maintain a Trading Journal: Keeping a detailed record of every trade—including motivations, emotions experienced, and outcomes—encourages self-reflection and helps to identify recurring patterns in behavior.
4. Practice Self-Discipline: Establish realistic trading goals and commit to your trading plan. Taking a pause before executing trades can help you refocus on your long-term objectives, minimizing the urge to act impulsively.
5. Restrict Trading Frequency: Set limits on the number of trades you make each day or week to ensure that you only engage in high-quality opportunities, rather than reacting to every market fluctuation.
By adopting these strategies, traders can cultivate the discipline necessary to move away from impulsive decision-making, emphasizing logical and goal-oriented actions instead.
Cultivating a Rational Trading Mindset
Developing a rational mindset is essential for long-term trading success and evading the pitfalls of emotional decision-making. Consider implementing the following techniques:
- Mindfulness and Relaxation Practices: Engage in mindfulness exercises to enhance awareness of your thoughts and feelings. Awareness allows you to recognize when emotions may be influencing trading decisions. Even short moments of focused breathing can provide clarity.
- Take Breaks Regularly: Long trading sessions can lead to fatigue and impaired judgment. By stepping away from your work periodically, you can recharge and return to your trading activities with fresh insight.
- Avoid Trading During Emotionally Charged Situations: If you find yourself facing personal stress or strong emotions, it may be wise to refrain from trading until you regain an even temperament.
- Focus on Long-Term Objectives: Prioritize sustained success over immediate rewards. Remind yourself that while impulsive decisions might provide short-term satisfaction, they often result in long-term setbacks.
Building a rational trading mindset requires patience and dedicated effort, but it is instrumental in improving trading performance. By incorporating these habits into your routine, you can enhance emotional control and make decisions that reflect logic rather than impulse.
I suggest to read also..:
The Critical Role of a Trading Plan
An effective trading plan is a cornerstone for preventing impulsive decisions that can undermine a trader's performance. The emotional responses associated with impulsive trading—such as fear and greed—can derail even the best-laid strategies. A comprehensive trading plan serves as a guiding framework, providing clarity and structured guidelines to help traders manage emotional impulses.
By defining specific goals, a trading plan equips traders with a clear sense of direction, reducing the temptation to chase fleeting opportunities or react to market noise. Furthermore, by integrating principles of risk management into your trading strategy, you ensure that engagement with risks aligns with your personal threshold, thereby minimizing unnecessary exposure. Establishing entry and exit guidelines allows traders to base their decisions on objective criteria, independent of emotion-driven impulses.
Read also:
Enhancing Trading Discipline with Tools and Techniques
Employing specific tools and strategies can support a disciplined trading approach and reduce impulsive behavior. Trading software with alert functions can help by notifying traders when predefined conditions for trades are met, ensuring decisions are based on strategic analysis rather than reactive impulses.
Regularly reviewing trading performance is equally vital. This practice allows traders to analyze trades, recognize behavior patterns, fine-tune their strategies, and verify their alignment with their trading plan. Drawing insights from these reviews fosters adherence to disciplined trading and helps traders remain focused and make informed decisions.
Read also:
In conclusion..
Achieving lasting success in trading depends on rational thought processes and emotional management. A well-developed trading plan, complemented by the right tools and techniques, empowers traders to avoid impulsivity and concentrate on their goals. Although the temptation for quick gains can be powerful, maintaining a disciplined approach is essential for sustainable success. Remember, trading is a journey rather than a sprint. By remaining consistent and methodical, traders can navigate risks effectively, ultimately crafting a strategy that yields long-term results.
✅ Please share your thoughts about this article in the comments section below and HIT LIKE if you appreciate my post. Don't forget to FOLLOW ME; you will help us a lot with this small contribution.

The Power of a Trading Journal: Key to Consistent SuccessHave you ever pondered what distinguishes successful traders from those who struggle for consistent profits? One key tool, often underestimated, is the trading journal. Both research and practical experience demonstrate that traders who diligently track their performance and critically assess their decisions tend to enhance their trading skills and overall results over time. While financial markets can seem erratic, a well-maintained trading journal can provide clarity regarding your trading behavior and highlight areas ripe for improvement.
Understanding the Trading Journal
At its core, a trading journal serves as a comprehensive record of your trades, detailing every decision and its corresponding outcome. However, it goes beyond a mere tally of wins and losses; it acts as a robust instrument for self-reflection and growth. By keeping an organized log, traders can identify recurring patterns, refine their strategies, and cultivate greater discipline in their trading practices. In essence, a trading journal empowers you to track your performance while offering meaningful insights for informed decision-making.
What Constitutes a Trading Journal?
A trading journal is a personalized record of your trading journey designed to document every aspect of your experiences. Unlike a basic transaction log, it encompasses insights into your decisions, emotional states, and strategies, thereby providing an in-depth perspective on your trading habits and performance over time. This journal functions as a roadmap, enabling you to analyze your actions, learn from missteps, and recognize successful patterns to replicate in future trades.
Essential Components of a Trading Journal
1. Trade Details:
Log fundamental information for each trade, including the date, instrument, entry and exit points, position size, and the outcome.
2. Trade Analysis and Rationale:
Capture the reasons behind each trade, such as market analysis, utilized indicators, or significant news events influencing your decision.
3. Emotional Insights:
Document the emotions felt before, during, and after each trade, which will help you identify emotional triggers impacting your decision-making.
4. Results and Lessons Learned:
Reflect on the trade’s outcome and the insights gained. Did it align with your expectations? What could be improved next time?
By consistently maintaining these entries, your trading journal will allow for systematic performance tracking, enabling you to conduct insightful trade analysis and continuously enhance your trading methodology.
The Key Benefits of a Trading Journal
Maintaining a trading journal provides numerous benefits that can significantly elevate your trading performance over time. From honing decision-making skills to fostering emotional discipline, a trading journal is an invaluable asset for anyone committed to enhancing their trading approach.
1. Enhanced Decision-Making:
Analyzing past trades enables you to discern patterns in your decision-making process, both successful and otherwise. You might uncover that certain strategies work better under specific market conditions or that impulsive trades frequently lead to losses. Understanding these patterns grants you valuable insights for making informed, calculated choices in future trades.
2. Improved Emotional Control:
Trading often involves a rollercoaster of emotions, with factors like fear and greed skewing decision-making. Documenting your feelings during trades can help you identify emotional triggers and develop strategies to manage them, maintaining objectivity and preventing emotions from derailing your trading plan. Over time, this fosters emotional control, which is crucial for sustained trading success.
3. Increased Consistency and Discipline:
A trading journal encourages consistency by promoting adherence to your trading plan and strategies. By recording every trade—regardless of its outcome—you cultivate a disciplined mindset that helps you avoid impulsive decisions and maintain a structured approach aligned with your objectives.
How to Establish Your Trading Journal
Creating a trading journal is quite simple; the key lies in selecting the right format and knowing what to document. Follow this guide to set up a journal that effectively tracks your trading performance and identifies growth opportunities.
Selecting Your Format:
1. Digital Applications:
Tools like Evernote, OneNote, or specialized trading journal software offer accessibility, data backup, and automation. Many apps include analytics features for streamlined performance tracking.
2. Spreadsheets:
Utilizing Excel or Google Sheets affords flexibility and customization. You can craft a spreadsheet tailored to your needs, complete with specified fields, formulas, and visualizations.
3. Paper Journals:
For those who prefer a tactile approach, a traditional notebook can suffice. While writing by hand fosters reflection, it lacks digital conveniences like searchable records.
Crucial Information to Record:
To enhance the effectiveness of your trading journal, make sure to include these key data points:
- Entry and Exit Points:
Log the precise times and prices at which trades are entered and exited.
- Position Size and Trade Details:
Note the trade size, instrument, and any pertinent details.
- Motivation for the Trade:
Document the analysis or strategy that influenced your trade decision, whether rooted in technical analysis, fundamental factors, or broader market trends.
- Emotional State:
Record your feelings throughout the trading process to better understand emotional influences.
- Trade Outcome and Lessons:
Reflect on the trade's success and any insights gained, noting what worked well or what didn’t.
Starting a trading journal requires minimal time but can significantly affect your long-term ability to track performance and improve.
Read Also:
Reviewing Your Trading Journal for Growth
A trading journal can only yield benefits if you regularly review and analyze its contents. Consistent reviews enable you to identify patterns, adjust strategies, and enhance your trading acumen.
Setting Review Periods:
Designate time—weekly, biweekly, or monthly—to review your journal. These sessions reinforce your commitment to your goals and reveal areas needing adjustment, ensuring ongoing learning from your trades.
Spotting Patterns and Mistakes:
Analyze your trades for recurring themes. Determine if you consistently act on particular signals or if emotional responses lead to poor decision-making. Acknowledging frequent mistakes marks the first step toward correcting detrimental behaviors.
Implementing Adjustments:
Leverage insights from your journal to modify your trading strategies. If a specific method isn’t yielding results, revise or replace it accordingly. If certain emotional triggers lead to losses, develop coping mechanisms to mitigate their influence.
By committing to regular reviews, you can transform your trading experiences into invaluable lessons that foster better habits and skills.
Read Also:
Maximizing the Benefits of Your Trading Journal
To fully reap the rewards of a trading journal, it's crucial to engage with it effectively. Here are tips to enhance your journaling experience:
1. Maintain Consistency:
Regularly enter details after every trade or at least daily. This practice captures relevant details while they’re recent, building a robust record for analysis.
2. Practice Honesty:
Accurately document both successes and failures. A truthful account allows for clearer insights into areas needing improvement, as self-awareness plays a vital role in progress.
3. Utilize Visuals:
Incorporate charts, graphs, or screenshots to enrich your journal. Visual aids facilitate pattern recognition and provide a more comprehensive understanding of your trading performance.
Read Also:
Conclusion: The Transformative Role of a Trading Journal
A trading journal is an essential tool for any trader pursuing consistent success. By meticulously recording trades, scrutinizing decisions, and learning from both victories and defeats, you can sharpen your skills, master your emotions, and cultivate a disciplined approach to the markets. Beyond merely documenting past trades, a trading journal offers critical insights that can profoundly influence your long-term performance. By consistently utilizing this resource, you can decipher your unique trading habits, refine strategies, and ultimately boost your confidence in decision-making.
✅ Please share your thoughts about this article in the comments section below and HIT LIKE if you appreciate my post. Don't forget to FOLLOW ME; you will help us a lot with this small contribution.

Day Trading: A Comprehensive GuideDay trading is a dynamic trading style that attracts many traders, particularly those looking to capitalize on short-term market movements. Unlike other trading strategies that span days, weeks, or even months, day trading involves executing trades within the same trading day, taking advantage of price fluctuations throughout that period. This guide will explore the essence of day trading, its strategies, pros and cons, and tips for success, delving deeper into the intricacies of the market and the techniques required to navigate it effectively.
What is Day Trading?
Day trading involves the buying and selling of financial instruments within a single trading day. Traders do not hold positions overnight; instead, they aim to profit from daily market movements. This approach is particularly appealing to novice traders, who may believe that frequent trades can exponentially increase profits. However, the fast-paced nature of day trading requires discipline and a solid trading plan, as emotional decision-making can lead to significant losses.
Traders typically utilize various time frames, often ranging from one minute (M1) to one hour (H1). While beginners may gravitate towards shorter time frames like M5 or M15, these often result in increased noise and the potential for quickly hitting stop-loss orders. Successful day traders understand that consistent profitability stems from maintaining discipline and developing a robust trading strategy rather than chasing quick wins.
Understanding Market Psychology
Market psychology plays a significant role in day trading. Fear, greed, and anxiety are the primary emotions driving investor behavior, leading to price movements. Traders must remain aware of market sentiment, gauging the mood of other traders and market participants. This involves:
1. Sentiment Analysis: Assessing current market sentiment can help traders position themselves correctly. Bullish sentiment often leads to higher prices, while bearish sentiment causes prices to drop.
2. Economic Indicators: Monitoring economic indicators and news releases helps traders anticipate potential price movements, influencing their trading decisions.
3. Support and Resistance: Key support and resistance levels indicate areas of price stability and potential for price reversal.
Read also:
--- Strategies for Successful Day Trading ---
To thrive in day trading, adherence to particular strategies is essential. Here’s a look at some of the most common techniques employed by day traders:
1. Scalping
Scalping is one of the oldest and most popular strategies in day trading. It involves making numerous trades throughout the day to capture small price movements. Scalpers analyze charts and execute quick trades based on technical indicators, entering and exiting positions in mere minutes. This method thrives in low-volatility environments, where assets tend to fluctuate within tight ranges, allowing traders to realize small but consistent profits.
Example of Scalping on 5-Minute EURUSD with Simple Moving Average and Standard RSI Indicator
2. Reverse Trading
Reverse trading capitalizes on market range-bound conditions. Traders identify key support and resistance levels and execute trades based on the price retracing from these points. This strategy typically requires a combination of technical analysis and an understanding of fundamental data. It's crucial to remain vigilant about scheduled news releases, as these can create sudden price surges or drops that impact positions.
Read also:
3. Momentum Trading
Momentum trading relies on the strength of existing price movements. This strategy involves entering trades in the direction of a prevailing trend, often guided by fundamental analysis and technical indicators such as Moving Averages. Traders monitor economic news and events that may influence market dynamics, utilizing these insights to execute long or short trades accordingly.
Read also:
4. Range Trading
Range trading involves buying an asset when its price falls to the lower boundary of a trading range and selling when it reaches the upper boundary. This strategy requires a keen eye for identifying support and resistance levels and a deep understanding of market volatility.
Read also:
Pros and Cons of Day Trading
Day trading comes with a distinct set of advantages and challenges. Here’s a balanced view of its pros and cons:
Pros:
- Access to Capital: Traders can start day trading with lower capital requirements since each trade can yield a profit in just a few pips.
- Flexibility: Traders have control over their trading schedule, allowing them to choose when and how long to engage in trades.
- Potential for High Returns: Successful day trading can produce significant profits compared to longer-term strategies, provided that trades are executed prudently and systematically.
Cons:
- High Risk: Day trading is inherently risky, especially for those inexperienced in market dynamics. The potential for quick losses is significant.
- Psychological Pressure: The fast-paced nature of day trading can lead to emotional decision-making, which can derail even the most disciplined traders.
Read also:
- Time Commitment: Day traders must be patient and ready to dedicate long hours to monitoring the markets, which may not suit everyone.
- Commissions and Fees: Trading frequently can lead to increased commissions and fees, eating into potential profits and making it essential to maintain a high win-to-loss ratio.
Managing Risks in Day Trading
Risk management is paramount to surviving in the world of day trading. Here are some risk management techniques to consider:
1. Position Sizing: Proper position sizing is critical to risk management in day trading. This involves allocating the right amount of capital to each trade to minimize the impact of potential losses.
2. Stops and Limits: Traders use stops and limits to limit potential losses. Stops are triggered when prices reach a predefined level, closing out the position, while limits are triggered when prices reach a certain level, closing out the position.
3. Risk Reward Ratio: Setting a risk reward ratio helps traders maintain profitability. This involves setting a ratio of reward to risk, typically around 1:3 to 1:4.
Read also: /b]
and..
and...
Conclusion
Day trading can be a lucrative venture for those willing to invest time in understanding market mechanics, developing strategies, and exercising disciplined decision-making. While it may appear attractive, particularly for beginners, the reality is that successful day trading requires meticulous planning, emotional control, and a well-thought-out strategy.
For those new to day trading, practicing on a demo account is advised to build skills and confidence. Starting with simpler strategies, such as pullback trading or scalping, can help beginners navigate the complexities of intraday trading. Ultimately, comprehensive knowledge of technical analysis and a clear grasp of market sentiment are critical for achieving consistent success in day trading.
✅ Please share your thoughts about this article in the comments section below and HIT LIKE if you appreciate my post. Don't forget to FOLLOW ME; you will help us a lot with this small contribution.

Strategies for Building Confidence and Achieving SuccessDid you know that psychological factors play a pivotal role in determining trading success, accounting for nearly 50% of an individual's performance? Among the various psychological barriers traders face, the fear of making mistakes is often the most significant challenge to overcome.
This fear frequently manifests as indecision, overthinking, or even a complete avoidance of trading opportunities. When traders adopt an overly cautious approach, they risk missing out on valuable opportunities, disregarding their research, or making ill-timed decisions. Such indecision stems from a preoccupation with avoiding errors instead of focusing on making strategic moves. Consequently, this mindset can lead to outcomes that negatively impact overall performance.
To foster the confidence and decisiveness necessary for successful trading, overcoming the fear of mistakes is essential. By confronting and addressing this fear directly, traders can transition from a mindset of wariness to one characterized by calculated risk-taking—an essential quality for achieving long-term success in the markets.
Understanding the Influence of Fear in Trading
The psychological effects of fear on trading are profound, often subtly steering decision-making processes in ways that may go unnoticed. At its core, fear stems from deep-rooted concerns about various forms of loss, including financial, reputational, and self-esteem related to trading success. This fear can transform the trading experience into a high-stakes endeavor, where every potential misstep feels consequential. Such a mindset can drain mental energy and cultivate habits that hinder long-term success.
One of the most detrimental consequences of fear is "analysis paralysis." Traders find themselves caught in a loop of excessive information-seeking or waiting for the “perfect” trade setup. This over-analysis leads to crippling indecision at vital moments, resulting in missed opportunities and delayed entries that ultimately diminish potential profitability. In fast-moving market conditions, this paralysis can be particularly harmful, as chances can evaporate before traders can act.
Moreover, fear often results in a risk-averse mentality, steering traders towards prioritizing safety over growth. In an effort to minimize potential losses, they may focus on low-yield investments while avoiding riskier options that could offer greater rewards. This tendency can manifest in prematurely exiting trades to secure minor profits rather than allowing their strategies to play out to completion. Such premature exits limit potential gains and obstruct the trader’s ability to navigate complex market dynamics where well-calculated risks can yield significant rewards.
The fear of making mistakes can be particularly crippling, triggering self-doubt that leads traders to constantly second-guess their decisions. This self-doubt tends to result in erratic strategy adjustments or, in some cases, an outright withdrawal from trading altogether. Such fluctuations undermine trading discipline, especially when traders struggle to approach the markets with clarity and composure. This habitual reevaluation of strategies not only leads to lost opportunities but also fosters a lingering uncertainty about one’s trading capabilities.
Recognizing the influence of fear is critical for developing resilience. Once traders understand the role fear plays in their decision-making, they can convert paralyzing hesitation into calculated confidence, enabling them to focus on sustainable long-term growth. Embracing challenges and viewing setbacks as learning opportunities are crucial steps in enhancing one’s trading journey.
Read also:
Common Mistakes Traders Make Due to Fear
Fear can trigger a series of mistakes that disrupt a trader’s strategy and undermine their self-confidence. One prevalent error stems from impulsive selling. In the face of sudden market downturns, the anxiety of incurring losses often drives traders to liquidate their assets hastily, resulting in selling at unfavorable prices instead of staying the course or waiting for the market to rebound. For instance, during unexpected dips, some traders resort to panic-selling to quickly “cut their losses,” only to witness a rebound shortly after, transforming what could have been a temporary setback into actual financial loss. This impulsive action erodes long-term profitability and disrupts the trader’s adherence to their planned strategy.
Another common pitfall is clinging to losing positions for too long. Here, fear of acknowledging a loss blinds traders to clear exit signals, causing them to hope that a trade will turn around. Consider a situation where a trader remains invested in a stock that continues to falter despite negative indicators. The fear of conceding a “failed” investment can leave a trader trapped in a stagnant position, missing the opportunity to exit early and curtail losses. The psychological attachment to the original investment decision exacerbates this reluctance, making it difficult to detach from the trade when it no longer aligns with their investment strategy.
Avoiding profitable opportunities represents yet another fear-driven error. Traders may recognize a potentially rewarding trade but hesitate due to fear of making an erroneous decision. This hesitation leads to missed entry points, resulting in substantial gains slipping through their fingers. In the fast-paced forex market, for instance, traders who delay their entries due to apprehension often find that the moment has passed, thus limiting their earning potential. Over time, such patterns of avoidance can amplify self-doubt, creating a vicious cycle of missed chances and hesitation.
These common mistakes highlight the necessity for traders to address and manage fear proactively. Without effective strategies to navigate fear, it can become a formidable barrier to disciplined and successful trading, keeping traders trapped in cycles of lost opportunities and unnecessary losses.
Strategies for Conquering the Fear of Mistakes in Trading
To successfully overcome the fear of mistakes in trading, a combination of education, risk management, and emotional regulation is crucial. Here are several key strategies that can help traders cultivate confidence and make more decisive, well-informed choices.
Enhance Knowledge and Build Confidence
One of the most effective ways to counteract fear is by enhancing trading knowledge. A solid understanding of trading principles, strategies, and market mechanics can significantly alleviate uncertainty and mitigate anxiety. When traders are well-informed, they start to perceive mistakes as part of the growth process rather than threats to avoid. Investing time in learning both technical and fundamental analysis, market trends, and trading tools can empower traders to make decisions based on data rather than emotion.
For example, mastery of reading and interpreting candlestick patterns or understanding economic indicators provides traders with a sense of control, enabling them to make confident decisions. Moreover, staying abreast of market news and developments helps to dispel unpredictability, allowing traders to feel prepared for various scenarios.
Embrace Risk with Structured Approaches
Fear in trading is often closely tied to the possibility of loss, but risk is an inherent aspect of all trading. Implementing structured risk management strategies enables traders to engage in the market with a sense of security. Establishing Stop Loss and Take Profit levels prior to entering a trade is essential for defining acceptable risk and limiting exposure. Even if a trade doesn’t unfold as expected, knowing that losses are controlled helps reduce panic and regret.
Position sizing is another effective technique. By risking only a small percentage of their capital on each trade, traders can minimize the impact of any single loss on their portfolio. This thoughtful acceptance of risk helps shift the perspective from fearing loss toward understanding it as a part of growth. When traders recognize that not every trade will succeed, but that losses can be managed, they are more likely to approach trading with clarity and confidence.
Cultivate Emotional Discipline
Emotional discipline is vital in managing fear during trading. Mindfulness practices—including deep breathing exercises and meditation—can equip traders with the tools necessary to remain grounded, promoting calm and rational decision-making. Additionally, making a habit of journaling can aid in reflecting on trades, emotions, and outcomes, helping traders identify patterns conducive to fear-induced decision-making.
Visualization techniques are also powerful tools for emotional management. Imagining successful trades and favorable outcomes allows traders to focus on their strengths and alleviate anxiety about potential mistakes. Regular practice of visualization can foster resilience, enabling traders to confront setbacks without succumbing to fear.
Through a combination of enhanced knowledge, effective risk management, and emotional discipline, traders can cultivate greater control and confidence. By integrating these strategies, they can gradually transform their fear of mistakes into a tool for learning and improvement, enhancing their overall trading experience.
Developing a Growth Mindset for Resilience
Fostering a growth mindset in trading is essential for promoting resilience and optimizing performance. This perspective encourages traders to view mistakes not as failures but as valuable learning experiences. By adopting this approach, traders can remain motivated in the face of setbacks, analyzing their trades with objectivity rather than discouragement. They focus on identifying patterns, recognizing areas for growth, and adjusting strategies accordingly.
This transformative mindset positions errors as integral to the learning process, facilitating skill development and better decision-making over time. By perceiving mistakes as stepping stones rather than obstacles, traders can refine their strategies, ultimately boosting their confidence. This commitment to continuous improvement is crucial for attaining long-term success in trading.
Moreover, traders who cultivate a growth mindset are more resilient, allowing them to maintain focus and motivation amid market challenges. This resilience empowers them to adapt to fluctuating market conditions, drawing lessons from both successes and failures and approaching trading with renewed determination. As they embrace a growth-oriented perspective, traders become better equipped to navigate the complexities of financial markets, improving their ability to thrive amid uncertainty. Ultimately, adopting a growth mindset elevates individual performance while transforming the trading journey into an enriching process of exploration and advancement.
Read also:
Practical Tips for Cultivating Confidence in Your Trading Journey
Building confidence in trading is a gradual journey, enhanced by small yet impactful steps that promote a positive mindset and reduce fear over time. Here are some effective strategies to consider:
1. Set Achievable Goals: Break down larger objectives into smaller, achievable steps. Each small victory reinforces a sense of capability and nurtures assurance in trading skills.
2. Celebrate Wins: Acknowledge both minor and major successes to foster a sense of achievement. Celebrating milestones helps to refocus on progress rather than setbacks.
3. Use Demo Accounts: Practicing with demo accounts provides a risk-free environment for traders to test their strategies and decision-making skills. This hands-on experience enhances preparedness, boosting confidence when transitioning to live trading.
4. Commit to Consistent Practice: Regular practice is essential for building confidence. Familiarity with market scenarios and decision-making processes reduces the likelihood of fear dominating thoughts and actions.
By incorporating these practical tips, traders can gradually strengthen their confidence, ultimately paving the way for more decisive and successful trading experiences.
Read Also:
Conclusion
Fear in trading isn’t inherently detrimental; when approached effectively, it can become a valuable asset that strengthens decision-making and promotes personal growth. By recognizing and managing fear, traders can prevent it from dictating their actions and instead utilize it to maintain discipline and focus.
Strategies such as cultivating a growth mindset, achieving small victories, and engaging in low-risk environments are all effective methodologies to harness fear constructively. Each of these approaches aids in developing a resilient trading mentality, allowing traders to transform anxiety into motivation. Ultimately, by viewing fear as a catalyst for improvement rather than an impediment, traders can navigate market complexities with enhanced clarity and intent, paving the way to sustainable success.
✅ Please share your thoughts about this educational post in the comments section below and HIT LIKE if you appreciate! Don't forget to FOLLOW ME; you will help us a lot with this small contribution

When Investing Turns into GamblingThe distinction between high-risk investing and gambling is a nuanced topic that draws considerable debate among financial experts and everyday investors alike. At what point does a bold investing strategy transition into a gamble? This question is particularly pertinent as more individuals explore the world of trading, often with little experience or understanding of complex financial instruments.
Understanding Gambling
Gambling, at its core, involves wagering something of value on uncertain events with the hope of attaining a greater reward. The term is rooted in the Old English word ‘gamenian,’ which conveys the idea of playfulness or merriment. While this historical context hints at leisure, modern associations with gambling primarily lean towards casino games and sports betting—activities that often prioritize entertainment over profit.
Legally and socially, gambling is characterized by three fundamental elements: consideration (the wager), chance, and prize. It is primarily the element of chance that fundamentally separates gambling from investing as a disciplined practice.
Read Also:
Characteristics of High-Risk Investing
High-risk investing manifests in various forms and is typically characterized by volatile assets, leveraged positions, and intricate financial tools. Examples include CFDs, options trading, and short-selling. While these strategies can yield impressive returns, they come with heightened risks and the possibility of substantial losses, particularly for those who are inexperienced.
The key difference between gambling and investing generally hinges on skill versus chance. Professional CFD traders may acknowledge the unpredictability involved but can also apply strategic approaches to increase their chances of success. This skill component is often what investors cling to, differentiating their methodical approaches from pure gambling.
Read Also:
Psychological Drivers Behind High-Risk Investing
The psychological dynamics involved in high-risk investing bear significant similarities to gambling behaviors. A prominent factor is the dopamine rush associated with successful trades—an exhilarating feeling that can become addictive. While such responses are often embraced in gambling environments, they must be regulated in investing to prevent detrimental decision-making.
Fear of Missing Out (FOMO) also plays a crucial role in driving investors toward risky trades. In our social media-saturated era, tales of sudden wealth can instigate impulsive behaviors, propelling individuals into investments without adequate research or risk assessment.
Overconfidence bias is another pitfall; novice investors may overestimate their ability to navigate markets, often resulting in shallow analysis and misguided decisions. Coupled with loss aversion—the tendency to feel losses more acutely than equivalent gains—these cognitive biases can lead to irrational choices, mirroring behaviors common in problem gambling.
Read Also:
Perception vs. Reality
The interplay between perception and reality complicates the discourse around high-risk investing. Many individuals erroneously equate their financial activities solely with mastery over skill and chance. However, overconfidence can mislead beginners into adopting complex strategies without a robust understanding of the underlying mechanics. While they may perceive their actions as investments, outsiders may recognize them as reliance on sheer luck, categorizing such behaviors as gambling.
Emerging asset classes, like cryptocurrencies, add another layer of complexity. Their relative novelty means that market participants often lack the historical data necessary to inform sophisticated strategies, resulting in some deeming these investments as mere gambling.
The Importance of Self-Awareness
Ultimately, self-awareness emerges as a crucial aspect of distinguishing between high-risk investing and gambling. Understanding personal motivations is vital; the riskiness of an asset alone does not dictate its categorization. Allowing emotions to override a carefully charted financial strategy is indicative of gambling-like behavior. Similarly, employing untested or misunderstood strategies can signal a drift away from genuine investment practices toward a gambling mentality.
Read Also:
Final Thoughts
In the realm of finance, it is essential to maintain a clear bifurcation between calculated investing and haphazard gambling. Self-awareness, comprehensive research, and a disciplined approach to risk management are key to ensuring that individuals engage in sound investment practices, rather than crossing over into the unpredictable territory of gambling. Individuals must strive to understand the nuances of their financial choices, recognizing when the line is blurred and committing to informed decision-making. Only then can they navigate the market landscape with confidence and prudence.
Read Also:
✅ Please share your thoughts about this article in the comments section below and HIT LIKE if you appreciate my post. Don't forget to FOLLOW ME; you will help us a lot with this small contribution.

THE CYCLE OF MARKET EMOTIONSWhen delving into the world of trading, one pivotal aspect often overlooked is psychology. In trading, we engage in two distinct psychological aspects: the collective psychology of the trading community and our unique mindset as individual traders. While we cannot change the psychology of the masses, understanding it is crucial. Equally important is the necessity to reflect on and, if needed, adjust our own psychological framework. In this article, we will primarily focus on the psychology of the individual trader.
The Complex Nature of Trading
As an aspiring trader, sooner or later, you will come to appreciate that the intricacies of trading go far beyond merely analyzing charts and fundamental data. It’s a common belief that a majority of new traders—around 80%—will face failure early on. If you haven’t experienced failure yet, consider yourself fortunate, and prepare for the inevitable realization: many of your trading challenges stem from within.
One of the most significant emotional hurdles traders face is fear—fear of missing opportunities, fear of losing money, fear of leaving profits untapped, and fear of making mistakes. If you wish to thrive in this field, overcoming these fears is essential.
The Weight of Fear
Throughout our lives, we’re conditioned to avoid being wrong and to strive to secure our finances. However, trading operates on a different frequency. Many traders dedicate their time solely to identifying promising trades. Once they enter a position, they often experience a tumultuous rollercoaster of emotions, ranging from anxiety over potential losses to elation during winning streaks. It’s vital to recognize that successful trading is not only about these emotions but about keeping them in check.
Experienced traders understand the fundamental role psychology plays in trading; conversely, novices may overlook or dismiss it. I aim to help you develop a better understanding of emotional management as a trader.
Prioritizing Survival
Before anything else, as a trader, you must prioritize staying in the game; survival comes first. Research shows that approximately 90% of traders fail before they ever achieve consistent profits. To belong to the successful 10%, you must adopt a different mindset.
It’s unfortunate that many individuals are drawn to trading due to the thrill it offers—the allure of quick profits with little initial capital. For such traders, the thrill often leads to reckless decisions, with no concrete strategy in place. Instead of following a thorough trading plan that accounts for risk management, they bounce from one tip to another, often neglecting the discipline crucial for success.
The Pitfalls of Emotional Trading
Trading motivated purely by excitement leads to poor decisions characterized by high risk and unfavorable odds. When a loss occurs, many traders seek external factors to blame: the market’s fluctuations, manipulation by large players, or insider trading. However, the harsh reality is that the primary person to be held accountable is you—the trader.
Accepting personal responsibility is a fundamental step towards becoming a successful trader.
Essential Ingredients for Trading Success
To navigate the path of successful trading, you will need to master four critical components: psychology, market analysis, a robust trading plan, and effective money management. In this exploration, we will focus primarily on the psychological component.
Read Also:
The Value of Psychological Awareness
People often ponder whether my background in psychology has contributed to my trading success. The answer is yes. Psychology equips me with the ability to face reality and introspect regarding my emotional responses. This training has taught me that dwelling on past mistakes or feeling regretful is unproductive—what truly matters is taking actionable steps for improvement.
Learn to view each trade as an isolated event, unaffected by previous or subsequent trades. Losses are an inevitable part of trading, and embracing them as a reality is crucial for long-term success.
Understanding Your Trading Style
It’s essential to reflect on your trading personality. Are you a discretionary trader—one who relies on instinct and external inputs such as news articles, broker tips, or peer opinions? Or are you a mechanical trader—someone who follows a well-defined trading plan, adapting it slowly over time while avoiding changes during open trades?
Identifying your style will not only help you understand your reactions to the stresses of trading but will also guide you in crafting a suitable trading plan.
Discovering the Secret to Success
Every trader grapples with the pressures of this challenging profession. Yet, what gives you an edge in this competitive landscape filled with seasoned professionals equipped with advanced tools? The answer lies within you.
Your perception shapes your trading experience. Only you can gauge how you will respond to criticism, endure losing streaks, or celebrate significant wins. Your beliefs and values dictate your attitude toward money, risk, excitement, and perseverance. Becoming aware of these elements is the first step toward mastery—controlling or, if necessary, transforming them.
Read Also:
Crafting Your Trading Plan
To better understand your trading persona, consider maintaining a trading journal. Document your emotional responses, trading behaviors, and overall experiences. This exercise will reveal vital insights about whether you're suited for a specific trading style—be it investment, day trading, or longer-term strategies—and help you craft an appropriate trading plan that aligns with your unique personality.
Read Also:
Conclusion: The Road Ahead
Trading is undoubtedly a difficult and stressful endeavor. However, with the right mindset and tools at your disposal, you can navigate this challenging field with confidence. This article serves as an introduction to understanding the vital psychological factors that can influence your trading performance. As you progress, remember to continually assess your emotional health and refine your trading strategy. Establish a comprehensive trading plan before you leap into future trades, ensuring that you’re as prepared as possible for the challenges ahead. With dedication and self-awareness, you can significantly increase your chances of thriving in the trading world.
By focusing on your mental approach and understanding the roots of your trading behavior, you can pave the way for a successful future in the exciting world of share trading.
Happy trading!
Read Also:
✅ Please share your thoughts about this educational post in the comments section below and HIT LIKE if you appreciate! Don't forget to FOLLOW ME; you will help us a lot with this small contribution

The Psychology behind the OverconfidenceHave you ever been convinced that your next trade was destined to succeed, only to watch it go south? Overconfidence is a prevalent obstacle in trading, affecting both novices and veterans alike. Research indicates that traders who feel a high level of control over market dynamics are often the ones who incur substantial losses due to erroneous decisions.
Overconfidence manifests when traders inflate their perception of their skills, market knowledge, or ability to forecast price movements. This dangerous mindset can blind them to lurking risks and lead to impulsive decisions. While confidence can be a positive trait when rooted in careful analysis and experience, overconfidence typically arises from emotional biases and previous successes. In an unpredictable market, managing overconfidence is crucial for a sustainable trading journey.
Understanding Overconfidence in Trading
Overconfidence in trading refers to the tendency of traders to believe they possess superior abilities in predicting market behavior. Unlike constructive confidence, which is born from experience and diligent decision-making, overconfidence is a cognitive bias that creates the illusion of enhanced control and skill. This self-delusion can be especially harmful in volatile markets where outcomes can shift unexpectedly.
Traders who fall into the trap of overconfidence often assume they can consistently "outsmart" the market based on a few prior successes or assumptions. This can lead to a reckless disregard for risks, such as underestimating potential market downturns or ignoring crucial economic indicators.
The impact of overconfidence on decision-making is significant. It clouds a trader’s judgment, prompting hasty actions rather than careful evaluations. Instead of thoroughly analyzing market data or considering a range of perspectives, overconfident traders often rely on gut instincts, frequently without backing their decisions with technical or fundamental analysis. As a result, they might enter high-risk trades without an appropriate risk assessment, leading to avoidable trading errors and considerable losses, especially during rapid market shifts.
How Overconfidence Impacts Trading Performance
The detrimental effects of overconfidence on trading performance are multi-faceted and primarily encourage heightened risk-taking. One of the clearest signs of this tendency is the tendency to increase position sizes. Overconfident traders, convinced they have a distinct advantage, may take on larger positions than their risk appetite allows, exposing themselves to greater potential losses if the market moves against them. The allure of leveraging can amplify both gains and losses, and excessive leverage can lead to margin calls, resulting in forced position liquidations.
Overconfidence can also lead traders to disregard essential market signals. Such traders may overlook technical and fundamental analysis in favor of their instincts or previous successes. For instance, a trader might open a position even when indicators suggest a decline, purely because of their strong conviction. This tendency can result in them holding onto losing trades for too long, hoping for a reversal when the market's trajectory might not support such optimism. Over time, this behavior can accumulate losses and negatively impact overall profitability.
Ultimately, overconfident traders become less adaptable, often resistant to acknowledging their mistakes. This rigidity and the failure to adhere to a disciplined trading strategy can deplete the gains achieved during fortunate periods, leading to inconsistent performance and in some cases, catastrophic financial repercussions.
Psychological Triggers Behind Overconfidence
Several psychological factors contribute to overconfidence in trading. Success bias and confirmation bias are two of the most prominent. Success bias occurs when traders experience a successful streak, leading them to believe their strategies or skills are foolproof. This temporary success can create a misleading sense of invulnerability, causing traders to take excess risks, overlook critical market signals, or stray from their established trading plans. The thrill of achievement can obstruct the ability to see potential pitfalls.
Confirmation bias compounds these issues by shaping how traders process information. Overconfident traders tend to seek and interpret information that aligns with their existing beliefs, discarding any contradictory data. For example, if a trader has a steadfast belief in the potential of a particular asset, they may only focus on favorable news or indicators, ignoring negative developments. This selective analysis reinforces their overconfidence, leading to poor judgment and increased exposure to risk.
Understanding these psychological triggers is key for traders who wish to keep their overconfidence in check and enhance their trading acumen. By recognizing the influences of success bias and confirmation bias, traders can actively take steps to mitigate their impact, fostering a more disciplined and analytical trading approach.
Cautionary Tales of Overconfidence in Trading
Real-world examples of overconfidence in trading serve as sobering reminders for traders at all experience levels. One notable case is Jesse Livermore, a renowned trader from the early 20th century. Livermore achieved significant profits through his exceptional ability to predict market trends. However, after experiencing considerable success, he developed an overinflated sense of his capabilities, prompting him to engage in reckless trading decisions. This overconfidence ultimately led him to invest heavily in stocks just before the 1929 market crash, resulting in devastating financial losses. His story highlights that even the most skilled traders can succumb to overconfidence, underscoring the importance of discipline and humility.
Another cautionary tale is that of Nick Leeson, who orchestrated the downfall of Barings Bank in the late 1990s. Initially praised for his trading skills, Leeson’s overconfidence burgeoned after a series of successful trades. This hubris drove him to employ unauthorized and excessively risky trading strategies, culminating in £827 million in losses. His failure to acknowledge the severity of his actions, fueled by a belief in his trading prowess, played a pivotal role in the collapse of one of the oldest banks in the UK. This illustrates that overconfidence can have profound consequences, both for individuals and the institutions they represent.
Strategies to Combat Overconfidence in Trading
Mitigating overconfidence is essential for achieving long-term profitability and minimizing risks. Here are several strategies traders can implement to strike a balance between confidence and caution:
#1 Cultivating Discipline and Humility
Discipline is foundational for successful trading. Traders should commit to their trading strategies and rules, resisting the impulse to deviate due to emotional reactions. Creating a detailed trading plan that outlines entry and exit strategies, position sizes, and risk-reward ratios can help prevent impulsive decisions driven by overconfidence.
Humility is equally vital in counterbalancing confidence. By acknowledging the unpredictability of the market and the limitations of their knowledge, traders can help temper their overconfidence. This humble approach promotes continuous learning and enables traders to adapt their strategies based on new information and shifting market conditions.
Read Also :
#2 Data-Driven Decision-Making
Relying on data to guide decisions is a robust strategy against overconfidence. Traders who rely on instincts or past successes may overlook critical information. A comprehensive trading plan should incorporate both technical and fundamental analyses and be rooted in objective data rather than subjective feelings. Regularly reviewing and adjusting trading strategies based on performance metrics and market developments can reinforce discipline and counteract emotional decision-making.
Read Also:
#3 Implementing Strong Risk Management
Robust risk management strategies are crucial in curbing overconfidence. Traders are often drawn to excessive risk when confidence is high, so outlining a maximum acceptable loss for each trade can provide a protective barrier against substantial losses. Stop-loss orders can be effective tools for limiting downside risk.
Diversification of investments across various asset classes, sectors, and geographic regions can mitigate the adverse effects of individual trade losses. Recognizing that trading inherently carries risks allows traders to adopt a more prudent and balanced approach to their investments.
Read Also:
Conclusion
Overconfidence in trading is a prevalent yet perilous barrier that can lead to severe financial setbacks. Identifying key psychological factors, including success bias and confirmation bias, is essential in addressing and reducing the impact of overconfidence. By practicing discipline, relying on data-driven insights, and implementing effective risk management strategies, traders can defend against the pitfalls of overconfidence.
✅ Please share your thoughts about this educational post in the comments section below and HIT LIKE if you appreciate! Don't forget to FOLLOW ME; you will help us a lot with this small contribution

1 - The Winning MentalityTo navigate the path of success, many individuals seek inspiration from the past. Historical figures teach us valuable lessons about achieving financial goals, avoiding common pitfalls, and navigating the complexities of life.
Trading stands out as one of the most demanding professions. Without proper training and education, mastering this field can be nearly impossible. What can aspiring traders do? The answer lies in learning from those who have excelled—studying their words, actions, writings, and seminars.
Every highly successful trader in the global currency market once started as a novice, transitioning from ordinary lives to remarkable success. None emerged from the womb as seasoned traders; each dedicated years to personal development, learning, and creating their own unique trading strategies. The names of such traders are now recognized by nearly all in the industry.
George Soros
George Soros, born György Schwartz in Budapest in 1930, grew up in a modest Jewish family. His family relocated to England in 1947, where Soros attended the London School of Economics, often juggling multiple jobs to make ends meet.
His journey took him to New York in 1956, armed with just $500. Over three decades on Wall Street, Soros gained notoriety for his innovative trading methods, amassing a fortune of $100 million.
A pivotal moment came on September 16, 1992, dubbed "Black Wednesday," when Soros famously shorted the British pound, profiting nearly $1 billion in a single day. Following similar strategies in Southeast Asia at the end of the 1990s, he declared a shift to philanthropy, ultimately donating approximately $32 billion to various causes.
On his 90th birthday, Soros shared a key insight into his success: his approach was more psychological than financial. He emphasized that distorted perceptions can lead to misguided actions—an understanding rooted in his concept of reflexivity.
Larry Williams
Born in Miles City, Montana in 1942, Larry Williams graduated from the University of Oregon before embarking on a varied career that ultimately led him to the stock markets. His interest sparked from observing stock price fluctuations, and he was particularly intrigued by the potential for profit despite market downturns.
By 1965, Williams was actively trading and became known for creating the acclaimed Williams %R indicator. He garnered remarkable success in the Robbins World Cup trading championship, where he achieved a staggering annual return of 11,376%, transforming a $10,000 investment into over $1.1 million.
Williams believed that historical events do not dictate future price movements, asserting that his indicators primarily shed light on current market conditions rather than predict future trends.
Steven Cohen
Stephen Cohen gained fame for his analytical prowess and his ability to anticipate market crises. Born in 1957, he demonstrated early on a talent for analysis, particularly through poker, where he honed skills in evaluating risk.
Cohen's trading career gained momentum after he invested $1,000 in a brokerage firm, subsequently launching S.A.C. Capital Partners with a $20 million initial fund. His savvy investment strategies led to an impressive annual profit nearing 50% at times, with his firm consistently outperforming competitors.
Even amidst market fluctuations, Cohen remained an active participant in his firm, demonstrating a hands-on approach that continues to define his success.
Paul Tudor Jones
Known for his discretion and aversion to fame, Paul Tudor Jones embarked on his trading journey in the 1970s with a clear ambition to succeed on Wall Street. Guided by influences from successful mentors, he initially traded on the cotton exchange, gradually transitioning to more lucrative futures trading.
His investment fund, Tudor Futures, grew substantially, particularly during periods of market volatility. Jones’s successful navigation led him to establish a renowned firm that today manages a diverse array of global investments, boasting a net worth of over $3 billion.
John Arnold
John Arnold represents a different path, as he transitioned from trading to entrepreneurship. He began his career at Enron, leveraging computer technology to excel in trading, ultimately earning $1 billion by 2001.
Following Enron’s collapse, Arnold founded Centaurus Energy Advisors, a hedge fund specializing in energy markets. Today, his business thrives with over $3 billion in assets, reflecting his exceptional leadership and strategic acumen.
Joe Lewis
Joe Lewis, billionaire and investor, built his wealth primarily through currency trading. Born in East London in 1937, he transitioned from a family catering business to becoming a formidable player in the financial markets.
Lewis achieved significant profits during the 1992 pound crisis, partnering with Soros. Now residing in the Bahamas, he actively manages the Tavistock Group, boasting investments across numerous industries.
Unpacking the Mindset of Successful Traders
The success stories outlined illustrate the diverse paths taken by some of the world’s most recognized traders. What common threads run through their journeys? Each trader faced significant challenges in their early years, and most were undeniably talented; however, talent alone does not guarantee success.
A defining characteristic of these traders is their unwavering focus on their objectives. Throughout their journeys, they sought knowledge from a variety of sources, driven by a desire to achieve their goals.
Despite the inevitable ups and downs, these traders recognized that perseverance and continuous learning are essential. For them, trading is not just a job but a lifelong passion.
Ultimately, success in trading—and in any endeavor—stems from tenacity, self-belief, specialized knowledge, and relentless pursuit of one’s goals. With a clear vision and dedicated effort, anyone can achieve remarkable success in the financial markets.
✅ Please share your thoughts about this educational post in the comments section below and HIT LIKE if you appreciate! Don't forget to FOLLOW ME; you will help us a lot with this small contribution

The Role of Meditation in Navigating the Forex MarketThe forex market, recognized as the largest financial market globally, operates around the clock, enabling traders to engage in currency exchange with a staggering daily trading volume exceeding $6 trillion. While the opportunities for profit are immense, the market's complexities can overwhelm many novice traders, leading to significant losses. This article highlights how meditation can serve as a crucial tool for traders looking to cultivate a more disciplined and resilient approach to trading.
Understanding the Challenges in Forex Trading
Many traders enter the forex market with the hope of quick gains but soon discover the numerous pitfalls that can hinder their success. Common challenges include:
1. Lack of Education and Understanding: Many are drawn to forex without grasping essential concepts, resulting in costly mistakes. A solid foundation in fundamental and technical analysis is critical for navigating the market successfully.
2. Poor Risk Management: Effective risk management is key to preserving capital. Traders often expose themselves to excessive risk through overleveraging, neglecting stop-loss orders, or focusing on a single currency pair.
3. Emotional Trading: Emotional responses like fear, greed, and impatience can cloud judgment, leading to impulsive decisions that stray from well-considered trading plans.
4. Lack of Trading Discipline: Success in forex requires adherence to a structured strategy, yet many traders falter by chasing losses or overtrading.
5. Unrealistic Expectations: The allure of immediate profits can create unrealistic expectations, causing frustration when outcomes do not meet anticipations.
Read also:
The Beneficial Role of Meditation
Amidst these challenges, meditation emerges as a valuable practice for traders looking to enhance their mental fortitude and emotional resilience. Here's how it can help:
1. Enhanced Focus and Clarity: Meditation practices, such as mindfulness, enable traders to cultivate a state of heightened awareness. This clarity allows them to analyze market conditions objectively, helping to reduce impulsive trading driven by emotional responses.
2. Improved Emotional Regulation: Regular meditation can provide traders with tools to manage anxiety, fear, and impatience. By fostering a sense of calm, traders can approach the market with a balanced mindset, making decisions rooted in strategy rather than emotion.
3. Cultivation of Patience and Discipline: Meditation teaches the value of patience and self-discipline. By engaging in focused breathing or guided mindfulness exercises, traders can reinforce their commitment to adhering to their trading plans and strategies, even in volatile market conditions.
4. Stress Reduction: The forex market can be a high-pressure environment. Meditation acts as an antidote to stress, helping traders maintain composure and clarity when facing market fluctuations.
5. Increased Self-Awareness: Meditation fosters introspection, enabling traders to reflect on their behaviors and decisions. This self-awareness can highlight patterns of emotional trading and reinforce the importance of following their trading discipline.
Read also:
Implementing Meditation into Daily Trading Routines
To effectively incorporate meditation into a trading routine, consider the following steps:
1. Set Aside Regular Time for Meditation: Allocate a specific time each day, perhaps before trading, to engage in meditation. Even just 10-15 minutes can provide a significant benefit.
2. Find a Comfortable Space: Choose a quiet and comfortable environment free from distractions. This can be anywhere in your home or even a serene outdoor space if possible.
3. Explore Various Techniques: Experiment with different forms of meditation, such as guided meditations, breathing exercises, or mindfulness practices, to find what resonates best with you.
4. Practice Deep Breathing: In moments of stress or anxiety while trading, take a moment to pause and practice deep breathing. This can ground your thoughts and help you regain focus.
5. Reflect on Your Trading Journal: After your meditation session, consider reflecting on your trading experiences and decisions. Journaling can complement your meditation practice by helping you process your thoughts and emotions.
Read Also:
Conclusion
The forex market presents unique challenges that can lead to losses for many traders. However, by integrating meditation into their routines, traders can enhance their mental resilience, emotional control, and overall trading performance. Emphasizing education, risk management, and disciplined strategies is essential, but these efforts can be significantly bolstered through the practice of meditation. By fostering a calm and focused mindset, traders can navigate the complexities of the forex market with greater confidence and increased chances of success.

The Top Ten Money Habits Every Trader Should EmbraceSuccess in trading is more than just making strategic entry and exit decisions; it demands a holistic approach that encompasses effective profit realization, diligent capital protection, and a nuanced understanding of the psychological challenges posed by money. Many traders, especially novices, overlook these critical aspects, which can impede their journey to achieving full potential. By cultivating robust money habits, traders can sidestep common pitfalls and enhance their trading practices from haphazard speculation driven by luck to a disciplined methodology that enhances the chances of success over time.
Positive money habits function like the gears in a well-oiled machine. They help traders manage stress and maintain focus in the face of market volatility, enabling them to adhere to their strategies rather than succumbing to impulsive actions. In this article, we explore ten key money habits that successful traders embrace.
1. Conservatively Allocate Your Net Worth to Trading
In the realm of retail trading, the importance of a cautious approach to capital allocation cannot be overstated. New traders should consider investing only a small percentage of their total net worth into their trading accounts. This strategy serves several purposes, the foremost being financial preservation. When stakes are relatively low, the emotional impact of inevitable losses diminishes, allowing for greater objectivity and composure. This approach helps traders manage their mental resources, which are just as critical as financial capital, by minimizing the emotional stress associated with fluctuating account balances.
2. Limit Per-Trade Risk
The 1% rule is a cornerstone of sound risk management, advising traders to commit no more than 1% of their total capital to a single trade. Adhering to this guideline is essential for maintaining stability and consistency within one’s trading operations. Small, manageable losses preserve trading capital and serve as a buffer against the emotional turmoil that larger losses can cause. By keeping losses minimal, traders can maintain emotional balance and avoid engaging in destructive behaviors such as overtrading or deviating from their established strategies.
3. Implement Stop-Loss Orders
Stop-loss orders are a vital risk management tool that dictates a pre-established exit point for trades that begin to lose value. When conditions turn unfavorable, these orders automatically limit losses, transforming small setbacks into manageable situations, which prevents catastrophic financial consequences. By setting stop-loss orders, traders can detach from the emotional weight of each trade, reducing the temptation to react impulsively. Much like a life jacket keeps you afloat in turbulent waters, stop-loss orders protect traders from significant loss during market storms.
Read Also:
4. Know When to Stop Trading
Establishing a clear boundary for when to cease trading is essential to maintaining emotional health and discipline. Whether it’s after two consecutive losses or reaching a predetermined percentage of capital loss, these self-imposed limits serve as crucial safeguards against emotional decision-making and impulsive reactions to market shifts. Avoiding the trap of "chasing losses" is vital for long-term survival, as relentless attempts to recover lost funds can lead to reckless trading behavior.
Read Also:
5. Maintain Accurate Records to Understand Your Performance
Successful traders often keep a detailed trading journal to track their history of trades and analyze performance metrics. Regularly assessing key statistics—such as win/loss ratios, average trade sizes, and recurring mistakes—enables traders to identify patterns and areas for improvement. This diligent record-keeping allows for data-driven decision-making and objective assessments, facilitating strategic adjustments based on performance rather than emotion. In essence, a trading journal becomes more than a record; it transforms into an essential tool for growth and competitive advantage.
Read Also:
6. Keep Trading Capital Separate from Personal Finances
A fundamental principle for serious traders is to maintain a clear separation between trading funds and personal finances. This involves designating a specific amount of capital exclusively for trading, shielding everyday finances from the volatility that can arise in the markets. Treating trading as a business with its own financial structure fosters discipline and enables traders to navigate market fluctuations without compromising essential personal expenses, such as rent or family obligations.
7. Develop Emotional Control
Successful trading is deeply rooted in emotional discipline. This trait differentiates a professional trader from an amateur gambler. Those capable of regulating their emotions can execute their trading plans with confidence, resisting the lure of impulsive, fear-driven decisions. Regular self-evaluation and mindfulness techniques contribute to emotional resilience, fostering a mindset that prioritizes strategic processes over short-term returns. Practicing emotional control enhances consistency and ultimately serves as a pillar of long-term success.
Read Also:
8. Cultivate Patience for Sustainable Capital Growth
Patience is a valuable asset in the trading world. Success is often achieved incrementally, necessitating a disciplined and sustained approach to trading rather than a frantic dash for immediate profits. By adhering to risk management principles and avoiding over-leverage, traders can gradually build their accounts, acknowledging that success is a marathon, not a sprint. Impatience can lead to hasty decisions that undermine a trader’s strategy, while a patient, methodical approach allows for the powerful compounding of gains over time.
9. Maintain Balance Beyond Trading
It’s crucial for traders to remember that their self-worth should not solely depend on their trading outcomes. An inherent risk exists when traders overly identify with their trading performance, potentially clouding judgment and fueling emotional volatility. Fostering a balanced lifestyle that includes varied interests helps mitigate the effects of trading fluctuations on overall well-being. This broader perspective can help traders remain level-headed, ensuring that their mood and decision-making processes are not solely influenced by trading results.
10. Establish an Emergency Fund for Financial Security
Finally, traders should prioritize building an emergency fund covering several months’ worth of living expenses. This safety net provides mental clarity and reduces the pressure that arises from needing consistent trading income. The unpredictable nature of trading can lead to significant financial stress, making it essential to separate one’s day-to-day financial needs from trading outcomes. With an emergency fund in place, traders can focus on making rational decisions without the looming pressure of immediate financial obligations.
Conclusion
In summary, successful trading transcends the mechanics of market entry and exit; it encompasses a comprehensive approach to profit realization, capital protection, and psychological resilience. By adopting sound money habits, whether you are an experienced trader or just starting, you can enhance your trading methodology and significantly improve your chances for long-term success. These strategies, from prudent capital allocation to emotional discipline, form the backbone of a resilient trading practice. Ultimately, cultivating these habits transforms trading from a game of chance into a systematic, strategic endeavor, paving the way for consistent profitability over time.
✅ Please share your thoughts about this educational post in the comments section below and HIT LIKE if you appreciate! Don't forget to FOLLOW ME; you will help us a lot with this small contribution

FOMO: The Trader’s Silent Enemy and How to Defeat ItIn the world of trading, emotional influences can significantly impact decision-making and outcomes. Two contrasting profiles emerge: those shadowed by Fear of Missing Out (FOMO) and those who adhere to disciplined trading practices. Understanding these profiles can help traders navigate the often volatile and unpredictable landscape of financial markets.
Distinctions Between FOMO and Disciplined Traders
The fundamental differences between traders influenced by FOMO and their disciplined counterparts can be distilled into several critical areas:
Research and Due Diligence
Disciplined Trader: A disciplined trader approaches the market with caution, dedicating time to comprehensive research before making any trades. They analyze market trends, harness technical indicators, and assess the fundamentals of the assets they are considering.
FOMO Trader: In stark contrast, the FOMO trader tends to act impulsively, often entering trades based solely on a recent surge in an asset's price. This lack of due diligence can lead to poor decision-making and significant financial losses.
Psychological Well-being
Disciplined Trader: The peace of mind that comes from preparation and understanding fosters resilience. Disciplined traders possess a clear vision of their strategies, which translates into greater emotional stability during market fluctuations.
FOMO Trader: Conversely, FOMO traders live in a constant state of anxiety, driven by the fear of missing out on potential profits. This stress can cloud their judgment, resulting in hasty decisions that may not align with their long-term goals.
Read Also:
Setting Expectations
Disciplined Trader: Traders with discipline recognize that markets fluctuate, and they set realistic expectations for their trades. They understand that no asset will rise indefinitely and prepare themselves for potential downturns.
FOMO Trader: FOMO traders may harbor unrealistic expectations of perpetual price increases, often leading to poor risk management and reactions based on emotional impulses rather than careful analysis.
Additionally, disciplined traders maintain structured practices, such as keeping a trading journal and employing risk management strategies, including stop-loss and take-profit orders, to safeguard their investments.
The Psychological Origins of FOMO in Trading
FOMO is not simply a passing feeling; it is deeply rooted in psychological and emotional dynamics that affect traders' behaviors. Here are a few of the significant psychological components that fuel FOMO:
Emotional Drivers
- Fear: At its core, FOMO is driven by the fear of missing out on lucrative opportunities. This fear leads to impulsive decision-making without adequate analysis.
- Greed: The promise of quick gains can lead to overconfidence, where traders disregard their due diligence processes in favor of immediate rewards.
- Anxiety: Market volatility heightens anxiety, driving traders to act hastily out of fear of being left behind as prices surge.
- Jealousy: Observing others' success can cultivate feelings of jealousy, which may compel traders to chase performance without conducting their own assessments.
- Impatience: Many FOMO traders are eager for instant gratification, resulting in rushed trading decisions that may not align with their overall strategy.
Read Also:
External Influences
- Market Hype: The buzz surrounding trending assets—often amplified by social media and news platforms—creates urgency among traders to partake, regardless of personal conviction.
- Herd Behavior: Sensational news can trigger a collective rush to join in on trending trades, leading to exaggerated market movements and increased volatility.
- Cognitive Biases: Psychological biases, such as loss aversion and confirmation bias, can exacerbate FOMO, pushing traders to act on emotions rather than logic.
Strategies to Combat FOMO in Trading
Recognizing and overcoming FOMO is paramount for successful trading. Implementing the following strategies can help cultivate a disciplined mindset:
1. Craft a Thorough Trading Plan
A well-defined trading plan outlines clear entry and exit strategies, risk parameters, and criteria for asset selection. By establishing this framework early in your trading endeavors, you create a disciplined approach that minimizes the chances of impulsive decisions.
2. Utilize a Trading Checklist
Create a comprehensive checklist that evaluates various conditions and technical indicators before executing a trade. This practice encourages thorough research and analysis, helping to prevent hasty, emotionally-driven decisions.
3. Maintain a Trading Journal
Documenting each trade helps identify patterns in decision-making and allows for reflection on the motivations behind your trades. Analyzing past experiences can empower you to make more informed choices moving forward.
4. Develop a Consistent Trading Routine
Establishing a structured routine—whether it involves regular analysis or adhering to a specific sequence for trade execution—helps maintain discipline and reinforces a systematic trading approach.
5. Implement Risk Management Tools
Utilizing tools such as stop-loss orders aids in controlling the emotional toll of trading. These measures automatically mitigate losses and preserve capital, supporting a rational decision-making framework.
Read Also:
Final Thoughts: Building Resilience in Trading
Understanding the dynamics behind FOMO provides traders with important insights into their psychological triggers. The emotional roots of FOMO—shaped by fear, social influence, and psychological biases—underline the critical importance of maintaining a disciplined trading approach. By implementing structured strategies, such as creating a trading plan, utilizing checklists, maintaining journals, and employing risk management, traders can better navigate the complexities of financial markets. Ultimately, cultivating resilience against FOMO allows for more informed and confident decision-making, leading to long-term success in trading endeavors.
✅ Please share your thoughts about this educational post in the comments section below and HIT LIKE if you appreciate! Don't forget to FOLLOW ME; you will help us a lot with this small contribution

Trading Recovery: Why Stopping After a Loss is Key to SuccessIntroduction
In the world of trading, the psychological landscape can be as treacherous as the financial one. The notion of knowing when to stop trading after a string of losses is crucial, yet often overlooked by many aspiring traders. As I evolved into a more serious trader, I realized the significance of halting my activity when faced with a bad start to the day. My trading strategy—clear and well-defined, including sound money management principles—became my lifeline.
Dr. David Paul once stated, “You will become a professional trader when you open positions only following your strategy; try to do it 30 times, and you will grow emotionally and psychologically.”
Since adopting this mindset, I’ve stopped allowing emotion to dictate my trades and began setting boundaries. If I experience three consecutive losing trades, I recognize that it simply isn’t my day. Tomorrow, I remind myself, offers a fresh start. In this article, I aim to delve deeply into why knowing when to step back can be the key to long-term success in trading.
---
The Cycle of Chasing Losses
How often have you found yourself scrambling to recover losses after a string of bad trades? Many traders fall into the familiar trap of frantically trying to win back what they’ve lost. This common phenomenon shifts the focus from sensibility to a desperate urge for break-even. Research shows that nearly 80% of traders give into this emotional response after experiencing a loss, leading to a destructive cycle of poor decision-making and dwindling finances.
Chasing losses has become synonymous with impulsive trading, often resulting in even larger setbacks. When traders act without a structured plan in the attempt to recover losses, they typically encounter even greater risks. What starts as an emotional response can escalate into a series of ill-fated choices, going against established strategies and money management rules.
---
The Underlying Psychological Factors
To fully grasp why chasing losses is counterproductive, we must explore the psychological underpinnings of this behavior. At its essence, chasing losses is an emotional reaction steeped in fear and desperation. Loss aversion—a concept from behavioral finance—illustrates how humans feel the sting of losing money more severely than the joy of gaining. This emotional pain can lead to irrational behaviors that only exacerbate the problem.
Several psychological triggers contribute to this compulsive reaction:
1. Overconfidence: Early success can lead a trader to overestimate their market capabilities. Faced with losses, they often take undue risks to recoup their perceived misfortune.
2. Fear of Missing Out (FOMO): The rapid nature of financial markets can create a heightened urgency to capitalize on opportunities, leading traders to make abrupt decisions rather than careful assessments.
3. Emotional Turmoil: The distress accompanying losses can compel traders to act impulsively, disregarding their strategic foundations for the sake of emotional repair.
4. Revenge Trading: This impulsive approach emerges from frustration, where traders attempt to “get back at” the market, often leading them to compound their losses further.
These emotional responses illustrate the dangers associated with letting feelings guide trading decisions. Developing an awareness of these triggers is vital for maintaining discipline.
---
The Consequences of Chasing Losses
Chasing losses can induce a plethora of negative consequences, both financial and psychological. The financial ramifications are often severe. Impulsive recovery attempts heighten risk exposure, leading to compound losses that can spiral out of control. Instead of cutting losses at 10%, a desperate trader might double their stakes, potentially leading to a catastrophic account downturn.
Emotionally, the toll can be equally ruinous. Continuous attempts to recover from losses can breed frustration and stress, leading traders to experience anxiety and helplessness. This emotional burden can culminate in burnout or, worst of all, a complete withdrawal from trading altogether.
---
Why You Shouldn’t Chase Losses
While the instinct to recover losses feels natural, it is arguably one of trading's most hazardous pitfalls. The psychological pressures involved can lead traders to deviate from their strategies and make impulsive decisions born out of fear, ultimately resulting in further financial and mental strain.
Chasing losses is particularly perilous in volatile markets. Reacting to emotions rather than analytical assessments can exacerbate unpredictability, leading to ill-advised trades that ultimately multiply losses. Furthermore, as traders deviate from their planned methods, they surrender control over their trading process, risking instability in both financial standing and mental health.
---
Strategies to Recover Without Chasing Losses
Rather than succumbing to the impulse to chase losses, traders should adopt disciplined recovery methods. Here are a few strategies that can facilitate a more effective and controlled recovery:
1. Maintain Trading Discipline: Stick firmly to your pre-defined trading plan. Resisting the urge to make impulsive trades can significantly minimize the psychological toll of losses.
2. Implement Robust Risk Management: Use tools like Stop Loss orders to safeguard your capital. Keep individual trade risks to manageable percentages, thus preventing significant downtrends.
3. Take a Break: If emotions run high after losses, stepping away from trading can help restore perspective and clarity. It’s crucial to approach the market with a calm mindset to avoid making knee-jerk reactions.
4. Adopt a Long-Term Recovery Mindset: Focus on patience and resilience rather than immediate recovery. Viewing setbacks as opportunities for growth can cultivate a healthier trading mindset.
5. Accept Losses as Learning Experiences: Instead of framing losses as failures, view them as valuable lessons. Analyzing what went wrong helps refine strategies and better prepares you for future trades.
---
Conclusion
Understanding when to cease trading following a series of losses is pivotal for sustaining a successful trading career. Chasing losses may appear to be a natural response, but it leads to a cycle of impulsive decisions and escalating setbacks. The journey to becoming a disciplined trader relies on the capability to recognize when to step back, adhere to a solid strategy, and appreciate the invaluable lessons losses impart. In trading, every day is a new opportunity; by mastering the art of knowing when to stop, traders equip themselves for long-term success and emotional resilience in the markets.
Read also:
✅ Please share your thoughts about this article in the comments section below and HIT LIKE if you appreciate my post. Don't forget to FOLLOW ME; you will help us a lot with this small contribution.

Commodities: Safeguarding Your Wealth in Uncertain TimesInvesting in Commodities: A Comprehensive Guide
In the quest for a balanced investment portfolio, commodities emerge as a crucial component, contributing to diversification and risk management. Commodities refer to raw materials or primary agricultural products traded globally, ranging from oil and gold to corn and wheat. Their unique characteristics offer investors opportunities to safeguard their assets and potentially profit during economic fluctuations, making them an essential element in mitigating risks associated with stock and bond markets.
At their core, commodities are fundamental materials employed in the production of goods and services, acting as a foundation for the global economy. These assets can be traded, bought, or sold, with their market value primarily driven by supply and demand dynamics. Unlike equities or fixed-income instruments, which represent ownership stakes or debt commitments, commodities are tangible resources that investors can physically possess or leverage for financial gain.
The primary allure of commodities lies in their potential to hedge against inflation and enhance portfolio diversification. Their often independent price movements compared to traditional asset classes, like stocks and bonds, make them valuable during times of economic uncertainty. For instance, when inflation rises, the prices of commodities frequently increase, preserving investor purchasing power and protecting against currency devaluation.
Commodities can be broadly classified into two categories:
- Hard Commodities: This group includes energy resources such as oil and natural gas, as well as metals like gold, silver, and platinum.
- Soft Commodities: These encompass agricultural products like wheat, corn, and coffee, along with livestock such as cattle and hogs.
By diversifying investments across both categories, investors can tap into various market trends and opportunities, whether it’s responding to geopolitical events affecting oil prices or poor harvests leading to increases in agricultural commodity costs.
Investing in commodities can take several forms, each with distinct characteristics and associated risks. Here are the main avenues available to investors:
- Direct Purchase
Buying physical commodities—like gold bars or silver coins—allows investors to own tangible assets. This method provides a straightforward hedge against inflation but comes with challenges in terms of storage and security, particularly for significant investments.
- Futures Contracts
Futures contracts are agreements to buy or sell a specified quantity of a commodity at a predetermined price on a future date. While futures trading can yield high returns due to leverage, it also poses substantial risks, requiring a thorough understanding of market dynamics and careful management.
- Commodity ETFs
Exchange-Traded Funds (ETFs) that track the prices of individual commodities or a basket of them offer a more passive investment option. These funds provide liquidity and diversification without the need for physical ownership or the complexities of futures trading.
- Commodity Stocks
Rather than investing directly in commodities, one can consider buying shares of companies engaged in the production of commodities, such as mining firms or oil companies. This strategy allows investors to benefit indirectly from commodity price movements while also receiving dividends.
- Contracts for Difference (CFDs)
CFDs are agreements that enable investors to speculate on commodity price movements without owning the underlying assets. This trading method is well-suited for experienced investors looking to capitalize on short-term market fluctuations but comes with amplified risks due to leverage.
Gold Futures Monthly Chart from 1975
- Hedge Against Inflation
Commodities are often viewed as a safe haven during inflationary periods. As general prices rise, so too do commodity values, making them an effective strategy for preserving purchasing power.
- Portfolio Diversification
Incorporating commodities into an investment strategy can enhance diversification. They generally exhibit low or negative correlations with stocks and bonds, helping to cushion portfolios against market downturns.
- Cyclical Performance
Commodities typically respond to economic cycles, performing well during times of growth when demand increases. Conversely, they may benefit from investor behavior during market instability, particularly in the case of precious metals.
- Supply and Demand Insights
Investors can leverage the fundamental principles of supply and demand to identify profitable investment opportunities. For instance, seasonal changes or geopolitical disruptions may create market imbalances affecting commodity prices.
While the potential rewards of commodity investing are considerable, the associated risks warrant careful consideration:
- Price Volatility
Commodity markets can be highly volatile. Investors may face sharp price swings, influenced by speculation, macroeconomic trends, or unexpected changes in supply and demand, which can lead to significant financial losses.
- Geopolitical Instability
Conflicts and political events can disrupt commodity supply chains, spurring unexpected price changes. For example, sanctions on oil-exporting countries can impact global supply and drive up prices.
- Environmental Changes
Natural events, including droughts and extreme weather, significantly impact agricultural commodities, while environmental regulations can affect energy-related assets. These factors introduce unpredictability and risk into commodity investments.
Silver Futures Monthly Chart from 1975
Interested in exploring commodity investments? Here’s a step-by-step guide to help navigate this investment landscape:
- Evaluate Your Risk Appetite
Before you commence commodity trading, assess your risk tolerance. If you prefer stable investments, consider allocating funds to less volatile commodities or diversified commodity ETFs. Conversely, if you’re open to high-risk scenarios, explore potential opportunities in more volatile markets.
- Select the Right Commodities
Research and identify commodities that align with your financial goals. For instance, gold may serve as a hedge against inflation, while industrial metals may thrive during economic growth phases.
- Determine Your Investment Method
Choose from various investment methods, whether direct purchases, futures, ETFs, stocks, or CFDs. Each approach carries its risk/reward profile, so it’s paramount to select one that suits your investment strategy.
Cocoa Futures Monthly Chart from 1980
Looking ahead to 2024 and beyond, several trends will shape the landscape of commodity investing:
- Transition to Green Energy
The ongoing shift toward renewable energy is poised to affect traditional fossil fuels, especially oil. As nations aim to reduce carbon footprints, the demand for oil may taper, albeit gradually, while renewable energy commodities like lithium and cobalt gain momentum.
- Emerging Markets Demand
Countries in rapid industrialization, particularly in Asia, are expected to drive demand for industrial metals. Investors should keep a close watch on these markets as they become increasingly vital players in the global commodity landscape.
- Rising Interest in Renewable Commodities
As the world gravitates toward sustainable practices, the demand for renewable commodities essential for electric vehicles and clean energy technologies is anticipated to surge. This shift presents exciting investment opportunities aligned with the growing push for decarbonization.
Copper Futures Monthly Chart from 1988
In conclusion, investing in commodities presents both opportunities and challenges. For those looking to diversify their portfolios and hedge against inflation, commodities can be an attractive option. However, the inherent volatility and unique risks make it crucial for investors to carefully consider their financial objectives and risk tolerance.
By staying informed about market trends, employing sound strategies, and understanding the dynamics of both supply and demand, investors can navigate the complex world of commodities to potentially achieve long-term success. Embracing this asset class effectively entails a proactive approach, ensuring alignment with broader investment goals in an ever-evolving financial landscape.
✅ Please share your thoughts about this article in the comments section below and HIT LIKE if you appreciate my post. Don't forget to FOLLOW ME; you will help us a lot with this small contribution.

From Gambling to Investing: A ShiftInvesting vs. Gambling: Differentiating Between Strategic Trading and Risky Behavior
Many traders believe they have a foolproof strategy, yet they may be engaging in gambling rather than true investing without even realizing it. The distinction between investing and gambling can often appear ambiguous, particularly for newcomers in the financial markets. Understanding these critical differences is essential for achieving long-term financial success. If your trading approach lacks structure and discipline, you may be risking the integrity of your portfolio and ultimately compromising your wealth-building efforts. So, is your strategy geared toward creating wealth, or are you merely playing a high-stakes game of chance?
Investing: A Strategic Approach to Wealth Creation
Investing is a methodical approach to accumulating wealth over time, characterized by careful analysis and strategic planning. It's not merely about buying assets with the hope of making quick returns; true investing focuses on achieving sustainable, long-term financial growth. Investors ground their decisions in fundamental research, market trends, and controlled risk management strategies designed to balance potential gains with well-calculated risks.
The core tenet of investing is to cultivate wealth gradually, whether through stocks, bonds, real estate, or other financial instruments. For instance, investing in the stock market typically means acquiring shares of a company you believe will experience growth over time, enhancing the value of your investment in the process. Instead of pursuing immediate results, investors tend to hold onto assets with the expectation that they will appreciate over the long haul.
Key elements of successful investing include diversification, patience, and discipline. Diversification spreads risk across various assets, reducing dependence on any single investment or sector. Patience enables investors to endure market fluctuations without impulsive reactions. Disciplined investors adhere to their strategies, understanding that successful investing is a long-term endeavor.
Research plays a monumental role in investing. Investors scrutinize company performance, industry trends, and broader economic indicators to inform their decisions. This approach stands in stark contrast to gambling behaviors, wherein decisions are often made haphazardly and devoid of analytical backing.
In essence, investing is about taking proactive measures, preparing for the future, and assembling a portfolio that will generate wealth over time. This stands in direct opposition to gambling, which relies on chance rather than informed strategy.
Gambling in Trading: The Perils of Impulsive Decisions
In contrast to the structured foundation of investing, gambling within trading is characterized by impulsiveness, emotional responses, and a pursuit of immediate rewards. Traders who approach the markets with a gambling mindset often ignore the associated risks, opting instead for gut instincts and instinctive choices rather than data-driven analysis.
One hallmark of gambling in trading is the reliance on high-risk strategies, including excessive leverage and day trading without a coherent plan. Leverage allows one to control significant trades with a relatively small initial capital outlay, but it also magnifies potential losses. Traders who gamble often neglect to manage their risks adequately; a single misstep can lead to substantial financial losses.
Impulsive trading is another red flag. These traders leap into positions based on market hype, rumors, or fear of missing out (FOMO), making decisions without thorough analysis. This behavior resembles that of a gambler in a casino, chasing quick profits while allowing the allure of winning to cloud their judgment.
Emotions can drive decision-making in gambling approaches to trading. Rather than adhering to a consistent strategy, traders follow whims fueled by fear or greed. For instance, an investor might panic and liquidate assets after a market downturn, only to miss out on a subsequent recovery. Conversely, they might hold onto declining assets, hoping for an upswing—this behavior is known as "loss chasing."
Ultimately, gambling in trading proves to be unsustainable. Although there may be sporadic wins, these are often overshadowed by significant losses over time. Without a structured strategy and disciplined risk management, traders who engage in gambling behaviors are likely to watch their financial goals slip further from reach.
Identifying Gambling Behavior in Trading
Recognizing signs that your trading habits have veered into gambling territory is vital for safeguarding your financial future. Various indicators can signal whether your activities align more with disciplined investing or impulsive gambling.
One prominent sign is the act of chasing losses. Traders who chase losses hold onto losing positions in the hope that the market will eventually favor them. This mirrors a gambler's refusal to walk away, instead choosing to bet more in an attempt to recover previous losses. Rather than taking a step back to reassess and minimize losses, these traders continue to pour money into a futile situation—an extremely risky mindset, as the market can remain unfavorable for extended periods.
Another concerning behavior is over-leveraging, which occurs when traders utilize borrowed funds to increase the size of their positions. While leverage can amplify profits, it also heightens the risk of devastating losses. A small adverse price movement can wipe out an entire leveraged account, reflecting a reckless approach usually associated with gambling rather than strategic investing.
Emotional decision-making serves as another indicator of gambling behavior. Traders driven by fear of missing out, greed, or panic often make impulsive trades without proper analysis or predetermined strategies. This sharply contrasts with disciplined investing, where decisions are based on logic and research rather than emotional reactions to market fluctuations.
Frequent changes to trading strategies, an obsession with high-risk assets, and a lack of focus on long-term objectives are additional signs that one may be gambling instead of investing. If you're consistently bouncing between speculative opportunities and short-lived get-rich-quick schemes, reassessing your approach is crucial.
Key Differences Between Investing and Gambling
At first glance, investing and gambling may seem similar—both involve placing money with the expectation of profit. However, the fundamental differences between them are significant. Investing is a deliberate, research-informed strategy aimed at accumulating wealth over time, while gambling heavily relies on chance, immediate returns, and emotional decision-making.
One primary distinction is the reliance on analysis-based decision-making versus luck-driven outcomes. In investing, decisions arise from thorough research, including in-depth analysis of a company's financial health, market trends, and economic conditions. Investors leverage this information to make informed choices that align with their long-term financial aspirations. In contrast, gambling is largely speculative, making decisions with little analytical support and leaving outcomes to chance.
Another critical difference lies in risk management practices. Investors strategize for various scenarios through portfolio diversification and loss mitigation approaches. For example, diversification involves distributing investments across different assets to minimize exposure to any single risk. Conversely, gamblers tend to place their bets on specific trades or assets, embracing excessive risk without contemplating long-term repercussions.
Finally, long-term planning is integral to investing. Successful investors concentrate on wealth growth over extended periods, allowing their investments to benefit from compound growth steadily. On the other hand, gambling typically pursues immediate gratification without looking toward sustainable growth or the larger financial picture.
Consequences of Gambling versus Benefits of Investing
The consequences of gambling in financial markets are severe and frequently result in financial ruin. Traders who gamble regularly engage in high-risk behaviors like impulsive trades and over-leveraging, leading to extreme volatility and significant losses. The initial pursuit of quick profits can swiftly transform into devastating financial outcomes, draining portfolios and endangering long-term financial stability. The psychological impact of these losses often leads to further poor decision-making, perpetuating a cycle of impulsivity and high-risk behavior.
Conversely, long-term investing paves the way for steady, sustainable growth. Investors who adhere to disciplined, research-oriented strategies are much more likely to accumulate wealth over time. Investing emphasizes patience, comprehensive analysis, and diversification, allowing investors to shield themselves from volatility while enjoying the benefits of compound growth. Although it may not offer the adrenaline high of speculative trading, disciplined investing fosters security and stability, setting the stage for consistent returns.
The compounding effect is a notable advantage of long-term investment strategies, where returns build on one another, resulting in exponential growth over time. Although the process may seem slow initially, compounding accelerates as the years progress, transforming modest gains into substantial wealth. This gradual and predictable method significantly lowers the risk of catastrophic loss compared to gambling.
Ultimately, the choice lies between the thrill of gambling, often culminating in significant losses, and the sustained financial stability and growth afforded by disciplined investing. Opting for long-term investment sets the foundation for a prosperous financial future, steering clear of the emotional traps and reckless behaviors associated with gambling.
Cultivating an Investment Mindset
Transitioning from a gambling mentality to a disciplined investment mindset requires deliberate changes in how you interpret and execute trades. Developing an investment mindset involves creating a strategy, adhering to it, and prioritizing long-term gains over immediate rewards.
The first step is crafting a trading strategy that aligns with your financial objectives and risk tolerance. A well-formulated trading plan specifies clear guidelines for entering and exiting positions, outlines risk management strategies, and identifies the types of assets you intend to trade. Establishing a plan minimizes impulsive decisions based on fleeting emotions or market distractions. Whether you trade stocks, forex, or commodities, a research-backed blueprint equips you to approach the market calmly and strategically.
Discipline constitutes the foundation of a successful investment mindset. Even amid tumultuous market movements, disciplined traders remain committed to their strategy. Although it may be tempting to deviate from your plan during moments of uncertainty, long-term success relies on maintaining consistency. Whether experiencing a bull market or confronting sudden downturns, the key is to avoid emotional reactions and instead adhere to your established guidelines.
Effective risk management is another essential aspect of fostering an investment mindset. Rather than risking your entire capital on a single trade or relying on excessive leverage, consciously manage your exposure. Implement Stop Loss orders to limit downside risk, and never invest more than you can afford to lose. This approach helps keep potential losses manageable, preventing the reckless betting that frequently results in financial calamity.
Keeping emotions under control is equally vital. Successful traders recognize the markets' unpredictable nature, and fixating on short-term fluctuations can cloud judgment. Concentrating on long-term objectives and periodically reviewing performance can promote objectivity. Focus on data, analysis, and logical reasoning rather than emotional reactions to market volatility.
Lastly, committing to ongoing education is crucial. Learning about market dynamics, financial trends, and trading methodologies will bolster your confidence and discipline. Adopting an investment mindset is a continuous journey, but its benefits—long-term growth, stability, and reduced stress—are undoubtedly worth the effort.
Conclusion
Grasping the difference between investing and gambling is essential for anyone seeking success in the financial markets. While the allure of quick profits through gambling may be tempting, it frequently leads to financial disaster. In contrast, investing demands patience, strategy, and discipline, yielding consistent, long-term growth.
By identifying gambling tendencies within your trading behavior, you can transition toward a more structured, investment-focused mindset. Taking control of your trading methodology means meticulously planning your trades, managing risk, and concentrating on long-term results. The key to forging lasting wealth in financial markets lies in disciplined investing, not reckless gambling.
Read also:

Avoid Financial Disaster: Master Portfolio Protection.Safeguarding your portfolio is as critical as the pursuit of growth. While the excitement of asset appreciation draws many into the investing world, the reality is that market fluctuations can pose significant threats to even the most meticulously devised plans. Portfolio protection strategies exist to shield your assets against the inevitable risks inherent in financial markets, allowing you to endure turbulent economic seasons without incurring substantial losses. Whether you're an experienced investor or a newcomer, the significance of effective risk management cannot be overstated.
Markets are known for their volatility, often reflecting shifts in economic conditions, political events, and societal sentiments. A downturn can erase years of gains in a matter of moments if protective measures are lacking. Therefore, constructing a robust portfolio demanding attention to diversification, risk management techniques, and strategic asset allocation is paramount. The aim of these strategies is not the complete avoidance of risk but rather the mitigation of its potential impact, ensuring that your investment trajectory remains stable over time.
The Importance of Portfolio Protection for Lasting Success
In today’s fast-paced investment landscape, prioritizing long-term protection strategies is crucial for sustained financial success. While opportunities abound, they often come hand-in-hand with unexpected downturns, economic turmoil, or global crises that could significantly hinder wealth accumulation. During distressing market conditions, stock prices may experience extreme volatility, leading to potentially disastrous outcomes for investors who lack robust protective measures.
The consequences of failing to implement adequate protection can be catastrophic. Severe market corrections can rapidly erase gains, forcing investors to either sell at a loss or make hasty, emotional decisions. This knee-jerk reaction can create a cycle of mismanagement, further amplifying losses and jeopardizing long-term financial objectives. In stark contrast, those who incorporate strategies designed to protect against market downturns can maintain composure during turmoil, effectively safeguarding their investments while positioning themselves for recovery as conditions improve.
Preserving capital during unpredictable phases is not merely about avoiding losses; it is about fostering resilience. By minimizing risk exposure, investors enhance their ability to bounce back from setbacks and continue on their path toward growth. Techniques such as diversification, strategic asset allocation, and hedging help create a safety net during tumultuous times. For example, a diversified portfolio that encompasses bonds, commodities, and international assets offers a buffer against losses when one sector falters.
Key Strategies for Portfolio Protection
For an investment portfolio to withstand the inevitable ups and downs of the market, implementing a suite of protection strategies is essential. Here are several methods that can help minimize risks and optimize long-term growth potential:
1. Diversification Across Asset Classes
At its core, diversification is a fundamental strategy for risk management. By allocating investments across various asset classes—such as stocks, bonds, real estate, and commodities—investors can mitigate overall risk. The rationale behind this approach is straightforward: when one asset class struggles, others may thrive, balancing the portfolio's performance.
For instance, in a bearish equity market, bonds or real estate may exhibit stability or even appreciate, cushioning the blow from declining stocks. A well-crafted diversification strategy not only fortifies against losses but also creates opportunities for steady returns. An effectively diversified portfolio reduces vulnerability by distributing risk across a spectrum of investments, a critical aspect of portfolio protection.
2. Hedging with Derivatives
Hedging is a powerful technique that allows investors to guard against financial market volatility using derivatives like options and futures. For example, purchasing put options on a stock provides a safety net, giving investors the right to sell at a specified price and limiting potential losses.
While hedging does not obliterate risk, it functions as insurance, softening the impact of adverse market movements. This strategic approach requires a deep understanding of financial instruments, but when applied correctly, it can significantly bolster portfolio resilience.
3. Incorporating Defensive Investments
During economic instability and market downturns, defensive investments or safe-haven assets come into play. These assets typically retain their value, providing stability in the face of broader market declines. Sectors such as healthcare, utilities, and consumer staples represent defensive stocks that generate consistent revenue regardless of economic conditions.
Furthermore, assets like gold and government bonds are renowned for their stability during turbulent times. Gold often appreciates as stock markets decline, serving as a hedge against inflation and currency depreciation. Government bonds offer a reliable income stream, making them low-risk investments during periods of uncertainty. Incorporating these defensive strategies enhances an investor's ability to manage risk effectively.
4. Regular Portfolio Review and Rebalancing
Maintaining an optimal risk level requires regular portfolio assessments and adjustments aligned with financial goals. As market dynamics evolve, certain assets may outperform or underperform, disrupting the initial asset allocation and potentially amplifying risk.
To counter this, investors should conduct routine rebalancing—selling portions of outperforming assets and reallocating proceeds into underperforming or lower-risk investments. This process helps restore the intended asset mix and ensures adherence to overall financial objectives, promoting stability within the portfolio.
Advanced Portfolio Protection Techniques
For seasoned investors, advanced protection tactics can provide deeper layers of security against market fluctuations. These strategies extend beyond conventional diversification, utilizing sophisticated financial instruments and techniques tailored for effective risk management.
1 - Portfolio Insurance
This technique merges equities with protective puts to limit potential losses. By holding onto stocks while acquiring put options, investors cap their downside risk while still allowing for participation in market gains.
2 - Volatility-Based Strategies
Adjusting exposure based on market volatility indicators can also serve as a proactive approach to risk management. For instance, heightened volatility might necessitate reducing equity exposure in favor of low-volatility assets, thereby maintaining manageable risk levels.
3 - Utilizing Swaps and Collars
Swaps can facilitate the exchange of investment risks, providing flexibility for managing exposure to market fluctuations. A collar strategy, conversely, combines purchasing a put with selling a call option, creating a protective range that limits both potential losses and profit. These advanced tactics suit investors seeking tailored risk solutions.
Common Pitfalls in Portfolio Protection
Despite the necessity of safety strategies, several missteps can undermine their efficacy. Recognizing these errors is crucial for maintaining a resilient portfolio.
1 - Over-Diversification
While diversification is vital, over-diversifying can dilute returns and complicate portfolio management. An unmanageable number of small investments may also escalate fees and expenses unnecessarily.
2 - Neglecting Market Conditions
Failing to adjust portfolios in response to fluctuating economic or geopolitical climates can expose investors to heightened risks. Consistent reevaluation is essential to keep portfolios aligned with prevailing market trends and personal objectives.
3 - Overtraditional Reliance on One Strategy
Dependence on a singular protective measure—be it Stop Loss orders or a single hedge—can be detrimental. Instead, employing a multifaceted approach that integrates various strategies enhances systemic resilience to market volatility.
4 - Ignoring Changes in Risk Tolerance
Personal circumstances and market conditions can shift your risk profile, especially as significant life milestones approach. Neglecting to recalibrate asset allocation in light of these extrinsic factors can lead to increased vulnerability during downturns.
Being aware of these common pitfalls will enhance your ability to protect your investments and pursue long-term financial goals with confidence.
Conclusion
Establishing a resilient portfolio necessitates a strategic approach to safeguarding your investments. In a world filled with uncertainties, deploying effective portfolio protection strategies remains essential for navigating market volatility. Techniques from diversification to hedging to the utilization of advanced instruments serve to fortify your investments against sudden declines while ensuring the potential for sustainable growth.
The journey toward financial success thrives on a commitment to ongoing investment monitoring and a willingness to adapt as conditions change. By implementing a blend of protective strategies—regular rebalancing, investment in safe havens, and employing sophisticated tools—you can cultivate a durable portfolio equipped to weather economic fluctuations. Remember, protecting your investment portfolio is not simply a reactive task, but an evolving commitment aligned with your financial aspirations and the inherent uncertainties of the marketplace.

From Dreams to Reality: The Untold Struggles of Forex Traders!When entering the world of forex trading, many newcomers envision themselves basking in the sun of a tropical paradise—working only a few hours a day and enjoying financial freedom with minimal effort. This "palm tree fantasy" creates a misleading perception that wealth can be effortlessly acquired through trading. In stark contrast, the road to consistent profitability is fraught with challenges, demanding dedication, strategic planning, and the right mindset. Success in forex isn't about hitting the jackpot overnight; it's about managing risk and developing a sustainable approach. It requires hard work, resilience, and the ability to remain focused amidst the inevitable market chaos.
To transform this fantasy into a reality, new traders must cultivate an understanding of what it truly takes to thrive in forex. Consistency, discipline, and a long-term perspective form the foundation for those who succeed in this fast-paced market. Instead of chasing easy profits, embrace a mindset centered on growth, education, and adaptability.
These are the true hallmarks of successful forex trading.
1 - The Importance of Knowledge and Skill
A commitment to continuous learning and market insight lies at the heart of every successful forex trader. Knowledge is not simply power; it differentiates between triumph and failure in the trading arena. Many traders enter the market with only a superficial understanding, hoping for a few lucky breaks to lead them to financial independence. However, achieving success necessitates a deep comprehension of market dynamics, from economic indicators to technical chart patterns.
Mastering trading requires proficiency in both technical and fundamental analysis, as well as insight into the psychological factors that affect market behavior. Top traders dedicate significant time to honing their skills, studying trends, and adapting to various trading environments. This robust knowledge base not only enables traders to navigate market fluctuations confidently but also fosters long-term growth and resilience. Remember, effective trading is about cultivating the skills and mindset essential for consistent success—not just chasing after quick gains.
2 - Embracing Practical Challenges
While the allure of forex trading lies in its flexibility, the practical realities reveal that it is anything but carefree. Traders must navigate complex market dynamics and appreciate the importance of timing, as forex operates around the clock across multiple global sessions. Understanding the nuances of the different trading sessions—such as those in Asia, Europe, and the US—is crucial for identifying the most opportune moments to trade.
For example, the overlap between the London and New York sessions presents lucrative trading opportunities due to heightened market activity. However, not all traders can be available during these peak hours, which may hinder their effectiveness. Thus, adjusting trading strategies to align with session-specific characteristics becomes essential for maximizing results.
In addition to market dynamics, technology plays a pivotal role in modern trading. Access to reliable trading platforms, real-time data, and automated systems is vital for success. High-quality tools can mean the difference between successfully executing a trade and missing an opportunity due to technical issues. Advanced charting software and trading algorithms facilitate pattern analysis, alerts, and trade automation—but relying solely on technology without comprehending its limitations can lead to costly errors.
Ongoing education about the latest tools and developments in the market is vital. Understanding risk management features, such as Stop Loss and Take Profit orders, along with utilizing backtesting tools to refine strategies, are essential components for navigating the contemporary forex landscape.
3 - Mastering Risk Management and Emotional Control
Effective risk management extends beyond merely capping losses; it’s about safeguarding your capital to ensure longevity in trading. This process starts with setting clear risk parameters for each trade and employing instruments like Stop Loss orders to mitigate unforeseen market fluctuations. Yet, even the most well-laid strategies can falter without emotional fortitude.
The pressures of risk management can test emotional resilience, particularly after losing trades or amidst volatile conditions. Feelings such as fear, greed, and anxiety often push traders to make impulsive decisions, whether that means chasing losses or over-leveraging during a winning streak. This is where emotional control becomes crucial.
Building emotional resilience entails adhering to your trading plan, remaining detached from immediate outcomes, and acknowledging losses as an inherent part of the trading journey. By focusing on long-term objectives rather than short-term fluctuations, you can maintain a level-headed approach, crucial for effective decision-making.
Mastering both risk management and emotional control significantly enhances the likelihood of sustained success. Traders who excel in these areas tend to weather market storms while adhering to their strategies, leading to improved profitability over time.
Actionable Tips for Beginners
Beginning your forex trading journey may feel overwhelming, given the plethora of strategies and information available. However, by anchoring your focus on a few key principles, you can establish a solid foundation for lasting success. The following actionable tips will guide new traders through the complexities of the market while helping you avoid common pitfalls:
1. Develop a Comprehensive Trading Plan: Outline your objectives, risk tolerance, and preferred strategies. A well-defined plan serves as your roadmap and keeps you disciplined, especially when emotions run high. Clearly state your profit targets, acceptable risk per trade, and criteria for entering and exiting trades.
2. Implement Strong Risk Management Practices: Protecting your capital is paramount. As a beginner, limit your risk exposure to 1-2% of your account balance per trade. Always utilize Stop Loss orders to safeguard against significant losses. Avoid over-leveraging, which can amplify both gains and losses, leading to precarious situations.
3. Keep an Eye on Emotional Reactions: Trading’s emotional stresses can be overwhelming, especially during volatile market conditions. Maintain a trading journal to document your trades along with your emotional responses at each decision point. Reviewing this journal regularly helps reveal emotional patterns—such as overconfidence following wins or anxiety after losses—that may cloud your judgment.
4. Stay Informed About Market News: Regularly update yourself on key economic events, policy changes, and geopolitical developments that may influence the forex market. Being aware of these trends enables you to anticipate market movements and adjust your strategies accordingly.
By adhering to these tips, you’ll not only cultivate disciplined trading habits but also shield yourself from common emotional and financial missteps as you lay the groundwork for a successful forex trading career. Remember, in the world of forex, patience and consistency are your greatest allies.
✅ Please share your thoughts about this article in the comments section below and HIT LIKE if you appreciate my post. Don't forget to FOLLOW ME; you will help us a lot with this small contribution.

Less is Better: The Importance of Quality Over Quantity.Throughout my journey as an independent trader, I've discovered an essential truth: whether I'm scalping on a five-minute chart for DJ30 or engaging in swing trading on a daily timeframe for GOLD, reducing time spent in front of the charts often translates to greater long-term profitability. My advice to aspiring traders is simple: concentrate on a single currency pair in the beginning. Develop a strategy for that pair, irrespective of the timeframe or trading style, and stick to it until you feel fully confident, proclaiming, "I've grasped the dynamics of this asset, and my strategy effectively works!" Aiming for just one or two trades a day with a modest risk percentage can secure a profitable future. In fact, almost 70% of retail forex traders incur losses due to overtrading and inadequate risk management. This brings us to a crucial question: should you pursue numerous trades to catch every passing opportunity, or dedicate your focus to fewer, high-quality trades that are meticulously planned?
In forex trading, the quality versus quantity debate carries significant weight regarding your success. While the instinct to make more trades might suggest a path to maximizing profits, the reality is often more nuanced. By distinguishing between a quantity-focused approach and a quality-driven strategy, traders can create a plan that not only boosts profitability but also alleviates emotional stress and mitigates unnecessary risks.
The Dangers of Quantity-Driven Trading
The appeal of quantity trading is frequently rooted in the misconception that "more trades equal more profits." This line of thinking can be detrimental, as overtrading—executing too many trades without a thoughtful strategy—is one of the most hazardous patterns in the forex landscape. Let's delve into the risks associated with favoring quantity over quality and how disciplined trading can stave off emotional and financial turmoil.
Emotional Turmoil and Impulsive Actions
Engaging in overtrading imposes tremendous psychological pressure on traders, potentially leading to emotional burnout. As the frequency of trades rises, so too does the temptation to make decisions driven by emotions. A trader fixated on quantity may become easily swept up in the market's volatility, resulting in heightened levels of stress, anxiety, and fear—factors that are detrimental to sound trading practices.
For instance, the fear of missing out (FOMO) can cause traders to jump into positions without sufficient analysis, simply to keep pace with the market. This lack of strategic focus undermines their success and often leads to costly missteps. Emotional trading can also lead to a damaging cycle of chasing losses, where traders increase their risks in a bid to recover quickly from setbacks, thereby compounding their financial strain.
Escalating Transaction Costs
A major downside of a quantity-centric trading approach is the substantial increase in transaction costs. Each trade incurs broker fees and spreads, and frequent trading can quickly deplete profits. For example, seemingly insignificant spreads can accumulate over time, effectively eating into returns. In contrast, traders who adopt a quality-over-quantity mindset tend to execute fewer, well-planned trades, thereby minimizing overall transaction costs. This strategy is designed to maximize profit from each trade, rather than engage in perpetual buying and selling.
Fatigue and Loss of Concentration
Forex trading can be mentally taxing, especially with a flurry of trades happening in rapid succession. Traders fixated on quantity are often at risk of losing focus after a certain point, resulting in errors and oversight. It's not uncommon for overtraders to face burnout, compromising their ability to detect critical market signals or neglecting fundamental aspects of their trading strategy. Mental fatigue can lead to slippage in performance as traders gradually lose control and forsake careful analysis.
Conversely, those who prioritize quality often approach the market in a more composed state, ensuring they are both physically and mentally prepared. This clarity enables them to execute trades that are both calculated and strategically aligned with their objectives.
Inconsistent Outcomes and Market Volatility
The fixation on numerous trades often results in erratic results. Markets do not consistently behave in predictable patterns, and excessive trading heightens exposure to volatility. Though some trades may yield favorable outcomes, the sheer volume increases the likelihood of losses.
Traders who prioritize quantity may fall into the “chasing the market” trap, making impulsive decisions based on short-term shifts rather than long-term trends. This impatience undermines trading success, as volatile market conditions often require a more measured, quality-focused approach.
In contrast, quality traders remain steadfast, engaging the market only when optimal conditions arise. By patiently awaiting the right opportunity and conducting comprehensive trend analysis, these traders are more likely to achieve consistent, positive outcomes.
Compromised Risk Management
When quantity overshadows quality, traders can neglect vital aspects of risk management. The more trades you open, the tougher it becomes to control exposure. With numerous positions, setting appropriate stop-loss orders for each can become challenging, leading to dangerous overexposure in adverse market conditions.
In contrast, quality-focused traders emphasize meticulous risk management. With fewer trades to monitor, they can diligently set tight stop-losses, manage leverage judiciously, and safeguard their capital. They are more likely to maintain a balanced portfolio, thus mitigating risks rather than exacerbating them.
The Long-Term Advantage of Quality Over Quantity
In forex trading, quality always surpasses quantity. By focusing on profitable trades supported by strategic planning and disciplined execution, traders can boost not only their success rate but also their overall performance. A tactical approach that prioritizes high-quality setups reduces unnecessary risks and emotional strain, which is crucial for sustainable profitability.
Enhanced Profit Potential
Quality trading methods yield more consistent profits over time. By channeling efforts toward well-researched trades, traders can refine their entry and exit points, ensuring higher success probabilities. These trades typically rely on robust technical and fundamental analyses, significantly amplifying the chances of realizing substantial returns.
Quality trading is about seeking the best opportunities rather than merely any opportunity. This focused approach minimizes the chances of making impulsive decisions that could lead to severe losses.
Superior Risk Management Practices
One vital reason that quality trumps quantity is its inherent focus on risk management. Quality traders are inclined to take fewer but well-calculated risks. They usually implement tighter stop-loss measures and adhere to strict guidelines, such as committing only a small fraction of their capital to any given trade.
This careful approach can curtail the risk of dramatic losses while capitalizing on profitable opportunities. Traders who prioritize quality cultivate a resilient trading plan that protects them from significant market fluctuations and unforeseen volatility.
Reduced Emotional Burden
A lesser-known advantage of prioritizing quality over quantity in trading lies in the significant reduction of emotional stress. Frequent trading can lead to feelings of burnout, anxiety, and distress, particularly when outcomes diverge from expectations. In contrast, quality traders maintain a more stable emotional state, as they do not find themselves constantly fluctuating in and out of trades. This balanced outlook is essential for preserving objectivity and avoiding rash choices, such as revenge trades or decisions made in frustration.
By adhering to a comprehensive trading plan and focusing on high-quality setups, traders can engage with the market more confidently and patiently. This ultimately leads to fewer mistakes and ensures that each trade is executed with a disciplined mindset.
The Role of Trading Psychology: Striking the Right Balance
The interplay between quality and quantity in forex trading cannot overlook the critical influence of trading psychology. A trader's mindset significantly impacts their trading behavior, often determining whether they will succumb to overtrading or maintain the discipline required for quality trades.
Understanding the Psychology Behind Overtrading
The desire for constant activity drives many traders toward overtrading. Fear of missing out on potential gains can lead to impulsive decisions, where quantity is prioritized at the expense of strategic quality. A relentless quest for profit can cloud judgment, leading to poorly considered trades and heightened losses.
Moreover, the dopamine kick associated with successful trades makes it tempting to place additional trades, perpetuating a cycle of emotional highs and lows that can drain both mental energy and financial reserves.
Importance of Emotional Discipline
Engaging in quality trading necessitates a strong sense of emotional discipline. This means exercising patience while waiting for favorable setups, adhering to a well-researched strategy, and resisting impulsive actions. Traders who prioritize quality can distance themselves from emotional market fluctuations, allowing for objective, rational decision-making.
Successful traders recognize that not every market movement necessitates action. They trust their analysis and remain composed, even during periods of heightened market volatility. This level-headedness minimizes anxiety, making it easier to sidestep emotional pitfalls, such as revenge trading.
Managing Emotions of Greed and Fear
Greed and fear stand as the two most destructive emotions in trading. Greed can compel traders to overtrade, while fear can paralyze them, resulting in missed chances or reckless decisions. Focusing on quality can alleviate these emotional struggles. By establishing clear criteria for entering and exiting trades, you cultivate a systematic approach that diminishes the effects of greed and fear.
For instance, when greed tempts you to exceed your strategic limits, recalling the potential emotional and financial costs of overtrading can help ground you. Similarly, quality-oriented traders are more resilient amid market downturns, as their faith in their strategies helps them recognize the broader market context.
Building a Resilient Mental Framework
To transition into a quality-focused trading mindset, you need to cultivate a robust mental framework encompassing the following elements:
- Patience : Learning to wait for high-probability setups rather than rushing blindly into the market.
- Confidence : Trusting your trading strategy and analysis, even when the market appears unpredictable.
- Emotional Control : Staying composed during losing streaks or market upheavals, avoiding rash reactions.
- Reflection : Regularly assessing your trades to identify patterns of impulsivity or overtrading tendencies.
By mastering these psychological components, you can effectively balance quality and quantity in your trading endeavors, paving the way for long-term success in the forex market.
✅ Please share your thoughts about this article in the comments section below and HIT LIKE if you appreciate my post. Don't forget to FOLLOW ME; you will help us a lot with this small contribution.

This is all you need to get started: a paper trading account!Starting your trading journey wisely means utilizing a Paper Trading account, also known as a demo account. This account simulates the real trading experience by mirroring market movements and conditions, but operates without the risk of losing real money. It offers traders access to comprehensive market data just like a live account, enabling practice with real-world price fluctuations—if Gold (XAU/USD) experiences a 5% rise or fall, the same scenario reflects in the demo account. This provides an excellent opportunity to understand market dynamics without financial exposure.
A Beginner's Best Friend: The Demo Account
For novice traders, a demo account is an essential entry point into the financial markets. It allows individuals to familiarize themselves with various trading aspects and strategies. Many traders base their transition to live trading on the insights and performance gleaned from their demo accounts. The convenience of setting one up is straightforward—simply use the Paper Trading option on TradingView to practice with a simulated account.
Click on the Trading Panel of your chart, and you'll find the Paper Trading option on TradingView.
Advanced Applications for Experienced Traders
However, the utility of demo accounts isn’t confined to just beginners; seasoned traders also derive significant benefits.
Experimenting with New Strategies
Experienced traders frequently utilize demo accounts to try out and assess new trading strategies. This method serves as a safe way to test different approaches without putting their capital at risk.
Evaluating Automated Tools
Developers of trading bots and algorithms rely on demo accounts for comprehensive testing of their tools. These automated systems undergo rigorous backtesting in a zero-risk environment, ensuring they are ready for live trading scenarios.
Training and Development
Demo accounts serve as effective training platforms for both individual traders and those employed within financial institutions. Whether it’s a retail trader or a professional in a hedge fund, these accounts offer vital learning experiences that hone skills effectively.
Skill Development and Confidence Building
The benefits of demo accounts extend to enhancing both technical and soft skills. Fundamental competencies such as market analysis, strategy formation, and data interpretation can be improved in a low-stakes setting. Meanwhile, soft skills like patience, resilience, and adaptability receive a boost, ultimately shaping a well-rounded trader.
Moreover, the journey can build confidence. Since trading can be intricate and losing money can shake one's self-assurance, a demo account provides a haven for refining trading strategies without risking actual funds. This psychological support can significantly influence success in the live markets, where self-confidence is often linked to profitability.
How Long Should You Practice?
The duration one should spend in a demo account varies, influenced by personal factors. For those transitioning to full-time trading, a minimum of three months is advisable. Though this may seem lengthy, it is a small price to pay for a comprehensive understanding of market dynamics and a variety of trading conditions.
The Advantages of Practicing Day Trading in a Demo Account
1- Accelerated Learning
Utilizing non-market hours for practice enables traders to quickly accumulate experience, far exceeding what can be gained during regular market sessions.
2- Preparedness for Quick Decisions
Day trading requires rapid decision-making skills. Regular practice in a demo account equips traders to respond swiftly to market fluctuations.
3- Intuitive Market Recognition
Frequent practice encourages an instinctual grasp of market conditions, vital for timely and effective trading actions.
4- Confidence in Trading Decisions
Confidence plays a critical role in a day trader's success. Thorough practice in a risk-free environment allows traders to build confidence before they step into live trading.
5- Adaptability to Market Variability
Day traders often experience victories and losses. Practicing within a controlled environment fosters a clear mindset to tackle each trade, essential for adapting to shifting market scenarios.
6- Setting Realistic Income Expectations
Repeated practice enables traders to set achievable income expectations, cultivating a sensible outlook prior to committing to full-time trading.
7- Enhancing Chart Analysis Skills
A demo account encourages traders to develop chart reading abilities without becoming overly reliant on them, promoting a balanced analytical approach.
8- Personal Trading Style Development
The complexities of day trading call for personalized strategies. Regular practice in a demo account allows traders to foster their unique trading styles and embrace accountability for their decisions.
9- Effective Risk Management
Practicing with margin in a demo account allows traders to experiment with leverage while treating each trade seriously.
Also Read:
and now...
"Best Practices for Using Demo Accounts"
To ensure you maximize the benefits of a demo account, adopt the following strategies:
Serious Approach
Although no real money is at stake, treating the demo account with seriousness enhances realism and deepens the learning experience.
Realistic Capital Allocation
Even though demo accounts may offer unlimited capital, traders should simulate an amount similar to their intended live trading capital for a more accurate experience.
Maintain Consistent Leverage
Using the same leverage plan that you would apply during live trading ensures that your demo experience aligns closely with potential future outcomes.
Gradual Transition to Live Trading
Transitioning from a demo account to live trading should be done thoughtfully. Test your strategies extensively in the demo environment, simulating real trading amounts, to reduce the likelihood of mistakes once you start live trading.
In conclusion...
In summary, a demo account is a vital resource for both novice and experienced traders navigating the complexities of financial markets. For beginners, it provides a risk-free avenue to grasp market dynamics and develop essential trading techniques. For seasoned professionals, demo accounts are indispensable for strategy testing, evaluating automated tools, and enhancing both technical and psychological skills.
While the ideal duration in a demo account varies from trader to trader, committing to three months is recommended for anyone serious about entering full-time trading. Day traders particularly stand to gain by practicing within a demo setting, allowing them to accelerate skill acquisition, prepare for snap decisions, and foster a robust sense of confidence. The structured environment of a demo account promotes the crafting of personalized trading strategies, the establishment of effective risk management practices, and the ability to adapt to real-world market conditions.
Lastly I would like to add this previous lecture to this post, I'm sure will be useful for you...
The Psychology Of Trading How To Manage Your Emotions
and..
The Benefits of Keeping a Trading Journal for Your Psychology
✅ Please share your thoughts about this article in the comments section below and HIT LIKE if you appreciate my post. Don't forget to FOLLOW ME; you will help us a lot with this small contribution.

Don’t Follow Nobody, Neither Me.Have you ever found yourself making investment decisions based on what everyone else is doing? It’s a common scenario—investors rush into the latest hot stock or abandon a sector because it’s suddenly out of favor. The urge to follow the crowd can be overwhelming, but is it really the best strategy for your portfolio?
In the world of investing, trend-chasing—where investors follow market trends without careful consideration—can often feel like a safe bet. After all, if everyone else is doing it, it must be right, right? This behavior, known as herd mentality, is deeply rooted in human psychology. However, in the financial markets, blindly following trends can be dangerous. Trend-chasing can lead to poor investment decisions and, ultimately, harm your portfolio. In this article, we’ll explore the risks of trend-chasing and why it’s crucial to develop a solid investment strategy that resists the pull of the crowd.
What Is Trend-Chasing?
Trend-chasing is the practice of making investment decisions based on the prevailing direction of the market rather than through careful analysis or a well-thought-out, long-term strategy. Investors engaging in trend-chasing often find themselves buying assets that have recently surged in value, hoping to capitalize on the upward momentum, or selling assets that are declining, fearing further losses. The key characteristic of trend-chasing is its reactive nature—investors make decisions based on what’s happening now, rather than a clear understanding of what the future may hold.
A Cautionary Tale: The Dot-Com Bubble
A classic example of trend-chasing occurred during the dot-com bubble of the late 1990s. As tech stocks began to soar, countless investors jumped on the bandwagon, pouring money into companies with little to no earnings simply because their stock prices were rising. The euphoria was contagious—no one wanted to miss out on the next big thing. However, when the bubble inevitably burst, those who had chased the trend found themselves with substantial losses as overvalued stocks plummeted back to reality.
The Meme Stock Phenomenon
More recently, the meme stock phenomenon of 2021 showcased another instance of trend-chasing on a massive scale. Stocks like GameStop and AMC experienced wild price surges driven not by fundamental value but by social media-fueled hype. Retail investors, motivated by online forums and the fear of missing out (FOMO), rushed to buy these stocks, driving their prices to unsustainable levels. While a few early adopters profited handsomely, many others who followed the trend ended up holding overpriced shares when the hype died down, resulting in significant losses.
GME Game-Stop 2021
AMC Entertainment 2021
In both cases, the underlying force at play was herd mentality—a psychological phenomenon where individuals mimic the actions of a larger group, often at the expense of their own rational judgment. This herd behavior drives market bubbles, where prices inflate beyond reasonable levels, and eventually, painful corrections occur. By understanding the dangers of trend-chasing and recognizing the role of herd mentality, investors can better guard against making impulsive decisions that may jeopardize their financial well-being.
The Psychology Behind Herd Mentality
Herd mentality is deeply ingrained in human behavior and significantly impacts how investors make decisions. One of the primary psychological drivers behind herd mentality is the fear of missing out. When investors see others profiting from a particular trend or asset, they often feel an intense urge to join in, fearing they’ll miss out on potential gains if they don’t act quickly. This fear can override logical thinking, leading to impulsive decisions based on emotion rather than careful analysis.
Overconfidence is another psychological factor that fuels herd mentality. When a market trend appears to gain momentum, many investors become overly confident in their ability to predict the future. They believe that if the majority is doing something, it must be the right move, and they overestimate their ability to time the market. This overconfidence often blinds investors to the risks associated with their decisions.
The Impact on Investment Decisions
Herd mentality pushes investors to follow the crowd rather than stick to their well-planned strategies. When everyone else seems to be buying a particular stock or entering a specific market, it can be challenging to resist the pull. As a result, investors may abandon their original investment strategy in favor of what appears to be a winning trend. This can lead to inflated asset prices and bubbles as more investors pile in, often without fully understanding the underlying fundamentals.
The problem arises when the trend reverses, leaving those who followed the crowd vulnerable to significant losses. In essence, herd mentality encourages reactive rather than proactive decision-making, often to the detriment of a sound investment strategy. By succumbing to the pressure of the crowd, investors risk making short-sighted choices that could harm their portfolio in the long run.
The Risks of Trend-Chasing
While the allure of following market trends can be strong, the risks associated with trend-chasing often outweigh the potential rewards. Investors who chase trends are frequently driven by emotion rather than rational analysis, leading to impulsive decisions that compromise long-term financial goals. Although trend-chasing may yield short-term gains, it exposes investors to heightened market volatility and the danger of being caught in a market downturn. Understanding these risks is crucial for developing a disciplined investment strategy that prioritizes long-term success over the fleeting appeal of the latest market trend.
Short-Term Gains vs. Long-Term Losses
One of the biggest dangers of trend-chasing is the temptation to prioritize short-term gains over long-term portfolio health. While it might seem profitable to jump on a trending stock or sector, this strategy often overlooks the bigger picture. Trend-chasing can lead to buying high during a market surge, only to sell low when the trend reverses. This pattern of behavior—repeated over time—can erode portfolio value and make it difficult to achieve long-term financial goals.
Market Volatility
Trend-chasing also exposes investors to heightened market risks. Trends are often fueled by speculation and hype rather than sound financial principles. As a result, markets driven by trend-chasing can become extremely volatile. Prices may swing wildly based on news, rumors, or shifts in sentiment, leaving investors who followed the trend vulnerable to sharp downturns. This volatility makes it challenging to predict market movements and increases the likelihood of significant losses.
Case Studies: Cryptocurrency Market
A prime example is the cryptocurrency market. The rapid rise of Bitcoin and other digital assets attracted a wave of trend-chasers eager to capitalize on the perceived opportunity. However, as seen in the dramatic crash of 2018 and subsequent market fluctuations, those who chased the trend often faced steep losses when the speculative bubble deflated.
BTC Bitcoin 2021
SHIBUSD Shiba Inu Token 2021
How to Avoid Trend-Chasing in Your Investment Strategy
In the ever-evolving world of investing, resisting the temptation to follow trends can be challenging. The fear of missing out and the influence of herd mentality can drive even the most seasoned investors to make decisions based on market trends rather than sound financial principles. However, by developing a disciplined approach, diversifying your portfolio, and staying informed without reacting impulsively, you can avoid the pitfalls of trend-chasing and create a more resilient investment strategy.
Developing a Disciplined Approach
The foundation of any successful investment strategy is discipline. This means setting clear financial goals, establishing a plan to achieve them, and sticking to that plan, even when market trends seem enticing. Here are a few tips to help you develop a disciplined approach:
Set Clear Objectives
Before making any investment decisions, defining your financial goals is essential. Are you investing for retirement, saving for a major purchase, or seeking to grow your wealth over time? Your objectives will shape your investment strategy and help you stay focused. When you have a clear understanding of what you're working toward, you're less likely to be swayed by short-term market trends that don't align with your long-term goals.
Create a Well-Defined Investment Plan
Once your objectives are set, develop a detailed investment plan outlining your asset allocation, risk tolerance, and time horizon. This plan should serve as your roadmap, guiding your decisions and helping you stay on course. A well-defined plan can act as a buffer against the emotional impulses that often drive trend-chasing behavior. When the market is booming and everyone seems to be jumping on the latest trend, your plan will remind you of your long-term strategy, preventing you from making hasty decisions.
Stick to Your Plan in Good Times and Bad
Market fluctuations are inevitable, but disciplined investors understand the importance of staying the course. When trends arise, it can be tempting to abandon your plan and chase after quick profits. However, this often leads to buying high and selling low—a recipe for underperformance. By adhering to your plan, you can avoid the emotional rollercoaster of trend-chasing and focus on achieving your long-term objectives.
Regularly Review and Adjust Your Plan
While discipline is crucial, recognizing when adjustments are needed is also important. Markets change, as do your financial goals and personal circumstances. Regularly reviewing your investment plan ensures it remains aligned with your objectives. However, any adjustments should be made thoughtfully and not in response to short-term trends. This approach allows you to stay disciplined while remaining flexible enough to adapt to changing conditions.
Diversification: Mitigating Risks Through a Balanced Portfolio
Diversification is one of the most effective ways to protect your portfolio from the risks associated with trend-chasing. By spreading your investments across a variety of asset classes, industries, and geographic regions, you reduce the impact of any single trend or market event on your overall portfolio. Here's how diversification can help you avoid the pitfalls of trend-chasing:
Reduce Dependence on a Single Asset or Market
Trend-chasing often leads investors to concentrate their investments in a particular asset class or market segment that is currently in vogue. While this can generate short-term gains, it also increases exposure to market volatility. A diversified portfolio, on the other hand, balances risk by spreading investments across different assets, such as stocks, bonds, real estate, and commodities. This diversification can help mitigate losses during market downturns when specific trends may collapse.
Balance Risk and Return
By diversifying, investors can achieve a more balanced risk-return profile. Different assets respond differently to market conditions, and by holding a mix of investments, you can smooth out the effects of market volatility. This approach allows you to pursue potential gains without exposing yourself to the full brunt of a market downturn.
Create a Stable Foundation for Long-Term Growth
A well-diversified portfolio can provide a stable foundation for long-term growth. Rather than chasing trends that may lead to short-lived profits, you can focus on building a portfolio designed for sustained performance over time. This stability will help you weather market fluctuations and remain focused on your long-term financial goals.
Stay Informed, but Don’t React Impulsively
Staying informed about market trends and economic developments is crucial for making sound investment decisions. However, it’s equally important to avoid reacting impulsively to the latest news or trends. Here are some tips for staying informed without falling into the trend-chasing trap:
Conduct Thorough Research
Before making any investment decisions, ensure you conduct thorough research and analysis. Understand the fundamentals of the assets you are considering and assess whether they align with your long-term goals. This research will help you make informed decisions based on facts rather than emotions.
Focus on Fundamentals, Not Headlines
While headlines may capture attention, it’s important to focus on the underlying fundamentals that drive asset values. Trends often gain traction based on hype rather than solid financial principles. By prioritizing fundamental analysis, you can better evaluate whether an investment is sound, regardless of its current popularity.
Maintain a Long-Term Perspective
Finally, keeping a long-term perspective is vital in avoiding trend-chasing. Markets are inherently cyclical, and short-term trends can be misleading. By focusing on your long-term investment strategy and goals, you can avoid getting swept up in the latest market fads.
Conclusion
In a world where market trends can shift rapidly, it’s essential for investors to recognize the risks of trend-chasing. The allure of quick profits can lead to impulsive decisions driven by emotion rather than careful analysis. By developing a disciplined approach, diversifying your portfolio, and staying informed without reacting impulsively, you can avoid the pitfalls of trend-chasing and work toward achieving your long-term financial goals.
Remember, the key to successful investing lies not in following the crowd but in maintaining a clear vision of your financial objectives. So, the next time you feel the urge to follow a market trend, take a step back, assess the situation, and ensure your decisions align with your long-term strategy. Don’t follow nobody, neither me—stay true to your investment principles, and you’ll be better positioned for success in the long run.
