EDUCATION: How to trade forex?Trading foreign currency on the forex market, also known as foreign exchange trading, can be an exciting hobby and a lucrative source of income for many people. Currently, the stock market trades about $22.4 billion per day, while the forex market trades around $5 trillion per day. There are various ways you can engage in online forex trading.
1. Learn basic forex terms.
- The currency you are using, or selling, is the base currency. The currency that you are buying is called the quote currency. In forex trading, you will sell one currency to buy another.
- The exchange rate tells you how much you have to spend in the quote currency to buy one unit of the base currency.
- A long position means you want to buy the base currency and sell the quote currency. In our example above, you want to sell dollars to buy pounds.
- A short position means you want to buy the quote currency and sell the base currency. In other words, you sell British pounds and buy US dollars.
- The bid price is the price the broker is willing to buy the base currency for in exchange for the quote currency. The bid price is the best price at which you want to sell your quote currency in the market.
- The ask price, or ask price, is the price at which the broker sells the base currency in exchange for the quote currency. The asking price is the best you are willing to buy from the market.
Spread is the difference between the bid price and the ask price.
2. Specify the currency you want to buy and sell in.
- Forecasting the economy. For example, if you believe the US economy will continue to weaken, and this is not good for the US dollar, you may therefore want to sell dollars in exchange for currency from a country with a strong economy. .
- View a country's trading position. If a country has a lot of popular goods, it may export goods to make a profit. This trade advantage will boost economic development, thereby helping to boost the value of this country's currency.
- Political review. If a country is holding an election, its currency will appreciate if the winner of the election has a fiscally biased agenda. In addition, if a country's government loosens regulations on economic growth, this will push up the value of the currency.
- Read economic reports. A report on GDP, or on other economic factors such as employment and inflation, of a country will have an effect on the value of that country's currency.
3. Learn how to calculate profit.
- Use the unit "pip" to measure the change in value between two currencies. Usually, one pip equals 0.0001 change in value. For example, if the EUR/USD rate increased from 1.546 to 1.547, then the value of your currency has increased by 10 pips.
- Multiply the number of pips your account changes by the exchange rate to find out how much your account value has increased or decreased.
4. Market analysis. You can try several different methods such as:
- Technical Analysis: Technical analysis is looking at charts or previous data to predict the direction of currency movement based on past events. The broker will usually provide you with a chart, or else you can use a popular platform like Metatrader 4.
- Fundamental Analysis: This analysis involves looking at the economic background and character of the country and based on this information to make trading decisions.
- Psychoanalysis: This type of analysis is largely subjective. You're basically trying to analyze market sentiment to figure out if the market is trending "bearish" or "bullish." While market sentiment cannot always be certain, you can still make some guesses, and this will positively impact your trading.
5.Define margin trading. Depending on the broker's policies, you can invest little money and still make big trades.
- For example, if you want to trade 100,000 units with a margin of 1%, the broker will ask you to put $1,000 in cash in your account for safety.
- Both profit and loss will be added or deducted from the account. For this reason, the best general rule is to only invest 2% of your cash in a particular currency pair.
6. Advise.
- Try to use only about 2% of your total cash. For example, if you decide to invest $1,000, try using only $20 to invest in a currency pair. Prices in Forex are very volatile, and you have to make sure you have enough money to spend when the currency pair price drops.
- Try using a demo account to make forex trades before investing real capital. That way you can be sure of the process and definitely should you join forex trading. After you always make the right trading decisions with a demo account, you can start doing it with a real forex account.
- Limit losses. Let's say you have invested 20 USD in EUR/USD currency pair, and today you have lost 5 USD. But you haven't lost your money yet. It is important that you only use about 2% of your cash back per trade, plus a stop loss with that 2%. You still have enough capital to cover this period so you can keep the position from closing and make a profit.
- Remember a loss is not a loss unless your position is closed. If your position is still open, your loss will only be calculated if you choose to close the position and take the loss.
- If the currency pair moves against your will, and you do not have enough funds to cover it during this time, your order will be automatically cancelled. Therefore, you must make sure not to make this mistake.
7. Warning.
- More than 90% of day traders fail. If you want to learn the common pitfalls that cause you to make bad trading decisions, consult a trusted fund manager.
- Check to make sure that the brokerage firm has a specific address. If the broker does not provide an address then you better find someone else to avoid being scammed.
Educationalidea

EDUCATION: The most common model patterns!Hello traders, I present to you a few candlestick patterns that appear frequently and have a fairly large win rate.
CUP AND HANDLE
The cup and handle pattern on the price chart resembles a cup with a handle, where the cup is U-shaped and the handle slopes down slightly.
The cup forms after moving upwards and looks like a bowl or round bottom. When the cup is completed, a narrow price range develops on the right side and a handle is formed. A subsequent breakout of the trading range forms the handle indicating a continuation of the previous upward move.
PENNANT PATTERN
This is a type of continuation pattern that forms when there is a major move in the market, known as a flagpole, followed by a period of consolidation with converging trendlines, pennants, and finally a move. breaks in the same direction, like the original move, representing the second half of the flagpole.
FLAG
The flag pattern is used to determine the possibility of a continuation of a previous trend from a point where the price has drifted in the same trend. If the trend continues, the price could rise rapidly, making it an advantageous time to trade using a flag pattern. If you think you've seen a flag to trade, the most important thing is a fast and steep price trend.
If the price slowly rises and falls below the flag, you should not trade at that time.
DOUBLE BOTTOM
The trajectory of the price line during the formation of the pattern resembles the letter "W". The last two price lows, located approximately the same, are a strong support zone where two price reversals are made to the upside.
When the market price breaks through the resistance level of the pattern, the formation of the pattern is complete. The BUY signal appears and the trend will change.

EDUCATION: DCA with Trader!What is DCA? How to use the price averaging strategy to increase profits
DCA or price averaging strategy can be an effective way to manage risk when investing in assets like stocks, cryptocurrencies… I will walk you through how it works and its pros and cons. for easy understanding.
When considering investment, if you have a large amount of money in hand ready to invest. DCA is a method that can be suitable for both experienced and new investors to reduce the risk of seeing how their investments decline in value.
What is DCA?
- DCA (price averaging strategy) is a method of breaking down capital to invest in a fixed and more frequent way over a long period of time.
- This is a smart investment strategy. However, you must not confuse it with the fact that you bottom out the price of an asset when it drops deep to buy at a good price.
- DCA is really good if you correctly predict the trend by analyzing the market. And of course, the price averaging strategy must involve technical analysis or specifically instrument indicators such as MA, MACD, Bollinger bands, Elliott waves, etc.
Bitcoin problem using DCA
Now do a math on Bitcoin investment for you to visualize.
Problem 1: Buy Bitcoin once with all assets
This is the case I think is mostly true for newcomers to the market. For example, you have 10000$ and buy it all with bitcoins for 8000$. You get 1.25 BTC.
Then Bitcoin achieves the gain/loss that you want to sell, then we will have a profit/loss table with the selling prices as follows:
- SELL at 6000$ = Take Profit -2000$
- SELL at 12000$ = Take Profit 2000$
- SELL at 14000$ = Take Profit 4000$
This is a basic math problem. The next step is to use the average price of your capital. Try it out and see how it turns out. Here, I will divide according to market developments so that you can consider it in the most comprehensive way.
Problem 2: DCA in a bear market
This is a problem that makes the DCA method really shine. Now, let's say the plan with the capital of 10000$ above will buy in batches. Divide the capital into 4 times, so use $ 2500 for each installment.
Proceed to buy bitcoin at 8000, 6000, 5000, 3000. So after 4 such purchases the number of Bitcoins you hold is 2.0625 BTC. After that BTC returns to the upside, you will calculate profit and loss at the prices if you sell as shown in the table below:
- SELL at 4000$ = Take Profit -1750$
- SELL at 10000$ = Take Profit 10625$
- SELL at 12000$ = Take Profit 14750$
Do you see that if the expectations are right, the profit will be huge. When bitcoin fell, you increased your holdings more than you could buy once. Investment capital increased as BTC price increased with a total profit of ~1.5 times when selling at $12000.
Problem 3: DCA in a sideways market
When the market moves sideways for a year, for example, the price moves in a narrow range. You can buy bitcoin in 4 batches at the prices 8000, 7500, 7000, 6000. With these buying prices you will buy 0.877976 BTC.
You can see it's similar to a one-time purchase with all capital, right?
The market can move sideways, up and down. But end up where they started in the long run. However, you will never be able to accurately predict where the market is headed.
If bitcoin had moved even lower, rather than higher, the price average would have allowed for even bigger profits. This is where you make sure you have long-term profits, not just immediate ones.
Problem 4: DCA in a rising market
In this last problem, also divide the capital of 10000$ into four installments for 5000, 6500, 7000, 8000. So after 4 purchases you have 1.55 BTC. When the price increases, you have the profit and loss in the following table:
- SELL at 4000$ = Take Profit -3800$
- SELL at 6000$ = Take Profit -700$
- SELL at 8000$ = Take Profit 2400$
This is a problem where DCA performs a bit poorly, at least in the short term. Bitcoin rallied higher and then continued higher. Therefore, price averaging does not help you maximize your profits. This one involves buying the whole thing in one go.
But unless you are making short term profits, this is a rare scenario in life. Bitcoin can evaporate, kkk. So, if you are investing for the long term, it is advisable to spread the capital in the trades. Even if that means you have to pay more at a certain price.
Is the price averaging strategy really good?
In general, the price averaging strategy offers three main benefits that can lead to better returns: Avoiding market fomo, avoiding market confusion, Long term investment thinking.
Because investors often fluctuate between fear and greed. They tend to make emotional trading decisions when the market reverses.
However, if you use DCA, you will buy when people are selling in fear (green quit, red watch, kkk).
Get a good price and set yourself up for a long profit. Markets tend to move up over time, and averaging prices can help you realize that a bear market is a great long-term opportunity. Instead of being afraid of things.
Limitations of the average DCA method
The first, perhaps the most discussed, is the modest profit. More frequent purchases increase transaction costs. However, with exchanges charging less transaction fees, this cost becomes more manageable.
Furthermore, if you are investing for the long term, the fees will become very small compared to your overall portfolio since you are buying for long term investment purposes. Binance is my top choice because of its diverse ecosystem and reasonable fee schedule.
Second, you can forego the profit you would have earned if you had invested in a one-time purchase and the property you purchased appreciates in value.
However, the success of trading largely depends on identifying the market correctly when predicting the short-term movement of an asset class. This is done by famous and good analysts.

What is the EMA? How to use EMA most effectively!What is EMA?
EMA or Exponential Moving Average (EMA) – An exponential moving average (EMA) is a type of moving average (MA) that is based on a weighted exponential formula that is more responsive to changes recent prices, compared to a simple moving average (SMA) that only applies equal weight to all periods, helping the EMA to smooth the price line more than the SMA.
What signals does the EMA provide to traders?
Moving averages offer a significant benefit by offering clear insight into price trends. In other words, the Exponential Moving Average (EMA) cannot exceed or remain above the price line unless the price is increasing. Similarly, it cannot be below the price line if the price is not actually decreasing. This is crucial for traders as it provides a distinct and reliable indication of the price trend, avoiding any ambiguity. The trend is essential in helping traders identify entry points.
The EMA will become a dynamic resistance, because it moves in the direction of the price, which means where the price goes, the EMA will follow.
Become dynamic support and resistance levels (these resistance levels can be used to compare the trendline, support and static resistance lines). From here will look for entry points, stop loss and take profit points.
Identify price trends.
Which EMA should be used most appropriately?
EMA 9 or EMA 10: This number represents a two-week period of trading, making EMA9/EMA10 commonly used for short-term transactions.
EMA 34/EMA 89 are used to align with the primary waves as per the Elliott wave theory.
EMA 20, EMA 50, EMA 200 are closely associated with trading sessions. Over the course of a year, we can typically trade for around 200 days, accounting for holidays and breaks. EMA50 represents the medium term, corresponding to the four seasons in a year, with each season having approximately 50 trading sessions. Similarly, EMA 20 represents the month.
Some traders also utilize the 250 EMA in addition to the 200 EMA, believing that 250 represents the number of trading days in a year.
EMA100 is a commonly chosen EMA due to its round number value. Round numbers are often seen as psychological barriers in trading.
Compare trendline with EMA:
As mentioned earlier, EMA is another way to identify trends, just like the trendline.
To better understand this concept, the trendline can be seen as a fixed resistance. Once you draw a trendline, it will act as a reference point for the price.
On the other hand, EMA is a dynamic resistance. It moves along with the price line. Unlike the trendline, EMA closely follows the price line because it is calculated based on the price itself. This makes EMA more accurate in showing the trend. It can clearly indicate whether the price is above or below the EMA.
Some notes with EMA:
- When the price surpasses or falls below the EMA, but then retreats below it again, it indicates a strong downtrend or uptrend.
- If the price strays too far from the EMA, it is advisable to wait for it to correct itself and return to the EMA before considering any trading actions.
- Fast EMAs or short period EMAs are more sensitive to price movements compared to slow EMAs, but they are also more prone to breakdowns. This can be advantageous as it allows for early trend identification compared to the SMA. However, the EMA is likely to experience more frequent short-term fluctuations compared to the corresponding SMA.
- EMAs act as dynamic resistance levels that consistently track the price line.
- The EMA is not primarily used for pinpointing exact tops or bottoms. Instead, it assists traders in aligning their trades with the prevailing trend.
- The EMA always has a delay, making the SMA more useful in sideways markets, while the EMA is more effective in clearly trending markets.
Thank you @TradingView !

The Trojan Horse of TradingThe Trojan Horse was a wooden horse used by the Greek army to enter the city of Troy and win the war. Although the inhabitants of the town had initially perceived the horse as a victory trophy, Greek fighters emerged from inside of it and destroyed the city.
"Yeah, that's a nice story. But how the heck is it related to trading?"
Let us clarify.
Trading is generally considered as one of the "easiest hardest" ways of making money. Upon learning about the limitless number of opportunities provided by the financial markets, newbies get excited and believe in the false promises offered by some "John Smith FX Trader" on Instagram that drives a purple Lamborghini and posts demo account profits. To be less cruel and offending, newcomers think they can become consistently profitable full-time investors/traders almost instantly.
Hence, we compare trading to the Trojan Horse that is full of "big sharks" such as institutional traders, hedge funds, market manipulating brokerage firms and so forth. In this case, retailers act as residents of the city of Troy and perceive the horse as a gift dedicated for the triumph.
Undoubtedly, as already stated, the world of trading presents a vast number of opportunities that one can benefit and make profits from. However, the drawbacks should not be discarded either.
Illustrated, we can find some of the hardships that are hiding behind the glamorous GUCCI bags, Shangri-La hotels, Michelin starred restaurants and Bentley sport-cars.

The Struggle of Consistency: Navigating DCA in Crypto InvestingHello dear @TradingView community! Today let’s focus on what is Dollar Cost Averaging ?
Determining the optimal moment to buy cryptocurrency is often a challenging task due to the high volatility of crypto assets. Prices can fluctuate unpredictably at any given time, leading traders to experience the fear of missing out (FOMO).
This fear is commonly felt when the price of a cryptocurrency, such as Bitcoin (BTC), suddenly surges or plunges. During price drops, individuals tend to panic and sell their holdings in a frantic attempt to avoid further losses. Conversely, when prices rise, panic ensues as people worry they don't possess enough coins to sell.
As evident, making decisions to buy or sell cryptocurrencies is no easy feat. However, if you seek long-term financial gains from cryptocurrencies without succumbing to the anxiety caused by every price spike, it would be wise to consider the Dollar Cost Averaging (DCA) strategy. Let's delve deeper into what DCA entails and how it functions in the realm of cryptocurrencies.
What is Dollar Cost Averaging?
Dollar cost averaging is an investment strategy where fixed amounts are regularly invested at consistent intervals, in contrast to a one-time lump sum investment. This approach involves executing transactions regardless of the asset's current price or market fluctuations. It is highly favored by investors and management funds seeking long-term profits from various assets like ETFs, commodities, cryptocurrencies, stocks, and more.
How does DCA work? To employ the DCA strategy, you first determine the amount of cryptocurrency you wish to invest. In conventional investing, one would typically invest the entire designated sum in a specific asset. However, with DCA, you invest fixed amounts of USD into Bitcoin or any other asset over a designated period. For instance, you may choose to purchase $100 worth of BTC every month for a 10 year period.
When utilizing DCA, the selection of the cryptocurrency becomes crucial. With around 22,904 cryptocurrencies available today, you must pick a coin you believe will appreciate in value and yield profitable returns. You can even choose an ETF which follows the trend (up or down) for any specific asset or basket of assets.
To comprehend how DCA operates, consider the following example:
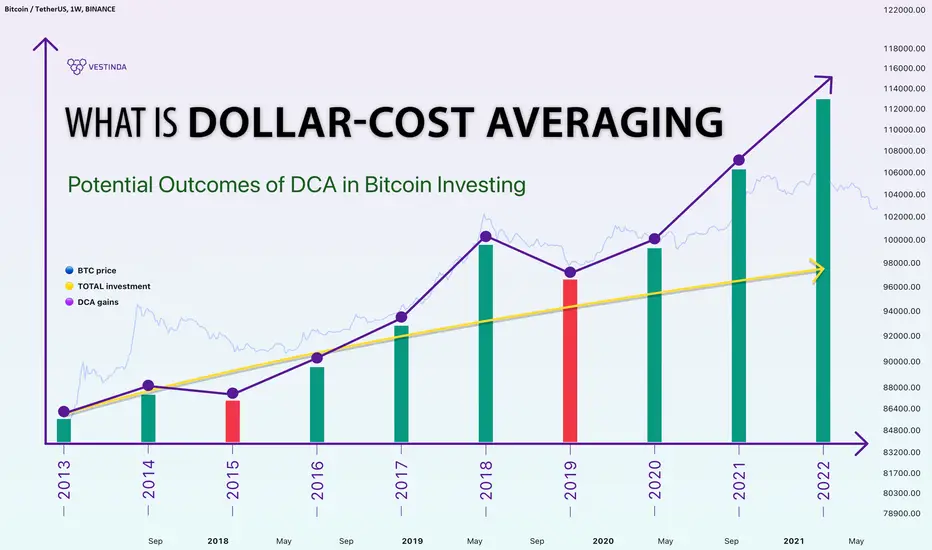
Let's assume it is June of 2014, and Katie decides to allocate $10,000 in BTC. In June of 2014, the price of Bitcoin stood at approximately $560 per coin. Instead of investing the entire sum at once, Katie opts for dollar cost averaging throughout the 9 years.
From June 2014 to May 2022, Katie spent $100 each month on BTC, disregarding market price fluctuations. After 8 years, she spends almost $9,600 and her earnings reflect the following:
The green line in the chart represents Katie’s total investment amount, while the orange line depicts the fluctuation of portfolio size value over the 9-year period. When Katie initiated his investments, both the cost of BTC and his investments were approximately $100. However, as time progressed, the price of Bitcoin underwent changes.
By May of 2022, Katie's $9,600 investment had grown to $287,518 worth of BTC, showcasing a growth rate of 2,895%. With maximum gain of $631,540 at bitcoin ATH.
Online DCA tools are also available to estimate the earnings from purchasing bitcoins over several months. For example, platforms like dcaBTC enable users to customize their DCA strategy according to their preferences, specifying the amount to purchase, investment frequency, and duration.
To successfully implement dollar-cost averaging (DCA) in Bitcoin investing, several key steps need to be followed. These steps involve setting a budget, choosing a reputable cryptocurrency exchange, establishing recurring purchases or utilizing recurring purchases and automated investment platforms (such as Binance, Coinbase, Kraken, Crypto.com or even at Vestinda), and monitoring and adjusting the strategy as necessary.
Pros and Cons of Dollar Cost Averaging
Let's commence with the pros of dollar cost averaging. By making regular and consistent purchases over time, you mitigate the risk associated with poorly timed lump sum investments. Additionally, since you make regular purchases, you alleviate the fear of missing out and impulsive decision-making prompted by price fluctuations.
Cryptocurrency exchanges and platforms charge transaction fees for every trade. While one might assume that DCA would result in higher commission fees, it is essential to remember that this is a long-term strategy. The commission costs are negligible compared to the potential profits that can be realized over several years.
Moreover, DCA does not necessitate substantial investments. This strategy involves smaller and consistent purchases, eliminating the need to determine how best to deploy a large sum in one go. Furthermore, if prices suddenly drop at the time of purchase, you can acquire the cryptocurrency at a lower price.
However, it is important to note that if the cryptocurrency's price is bullish, you may end up buying at a higher price. This is particularly relevant when dealing with BTC or any chosen cryptocurrency. Many crypto enthusiasts and investors prefer to purchase a significant amount at once, fearing a subsequent price surge in the hours, days, weeks, or months to come.
As previously mentioned, with the DCA strategy, you purchase small amounts at regular intervals, regardless of market stability.
Should you utilize the DCA Strategy?
DCA facilitates maximizing profits with relatively low risk. Although this approach is not devoid of drawbacks, it offers numerous advantages that can be leveraged to your benefit.
Hence, is DCA worth your time and money? As always, we recommend thoroughly studying all available information before making any decisions. Save this article to your browser bookmarks for easy reference in the future.
Happy trading!
Dealing with trading losses... before they occurLosses are part of this business. People do not react well to losses. Badly handled losses in trading can trigger bigger losses. Furthermore, these have the dangerous potential of wiping out entire accounts. If you want to make it as a trader you need to have a solid psychological approach to accept and handle losses.
Lots of internet articles are suggesting that the way to prevent debilitating losses in trading is to follow risk management rules. What are those rules about? Basically, they are simple thresholds indicating the maximum $ /percentage you should risk per trade, day, month etc. Having such rules is a must but it’s not enough. You can still lose much if your mind is not actually prepared to implement them. That’s why many traders set rules only to break them in the most inappropriate moments.
People do not follow their own risk management rules because they are not psychologically prepared to accept losses. They are not prepared for the pain caused by a loss or a series of losses.
The single most efficient way to handle losses is to accept them consciously and unconsciously. One of the most dangerous ways to react to losses is “revenge” or “on tilt” trading. This happens when the pain caused by a loss is so high that the trader looses his / her rationality and only wants his / her money back, disregarding most of the things he / she actually knows about the market. The brain cannot accept the emotional discomfort and the fastest solution is to quickly find a trade to make the money back. Most of the time, the quickest trade is in the same instrument (FX pair, stock, etc) that generated the initial loss, by averaging down/up or flipping. Some of the most experienced traders can work their way out but the vast majority will only make things worse.
In order to prevent this kind of psychological slippage you need to prepare your mind to consciously and unconsciously accept losses BEFORE they occur. With the help of a psychotherapist or by yourself you can perform visual exercises where you will imagine yourself being in a losing position and reacting the right way. This would desensitize yourself, if done right.
The technique I always use each time I open a position is to do that desensitization process “on the fly”. I watch the market and I see an opportunity. BEFORE opening the position, I imagine myself in the posture of facing that trade ending in a loss. After that, I imagine that trade going the way I want. I might even go back and forth (in my mind) a few times between losing and winning. This way, I prepare my unconscious mind. If I cannot imagine myself easily handling the loss (or the win) I will simply reduce size.
Pay attention though, I am not recommending here to imagine yourself constantly losing because this would do more harm than good. This would be a separate topic about the power of visualization exercises.

Swing | Intraday | Scalp: pros and cons of three trading stylesAs we all know, the three most popular trading styles are the following: Swing trading, Day trading, and Scalping.
This educational post is concentrated on highlighting some of the pros and cons of all three techniques.
When it comes to Swing Trading (middle to long-term trading), some of the advantages are less screen time, less anxiety, less risk, and less candle noise. This style of trading is beneficial for those individuals that do not have enough time to sit in front of the charts and execute positions on a daily basis. However, some drawbacks should be mentioned as well. In order to be a swing trader, one needs to master the skill of remaining patient, disciplined and cold-blooded. Swing trades can run from one day up to a week, and hence, it is crucial to know how to sit on your hands and do nothing upon witnessing slow price action, indecision, drawdown and so forth.
Moving to intraday trading, no overnight and over-the-weekend risks can be associated with this style as executed positions are usually closed within a couple of hours when trading the H1 and lower-timeframe graphs. On the negative side, in order to make a living off day trading, a strong psychological temperament is needed along with a sufficient trading capital. If swing trading requires a minimum of a risk of 1-2% per trade, the number is lower for day trading. Hence, a bigger input (capital) is required in order to be able to make decent returns.
Last but not least: Scalping. The fans of this style of trading usually dedicate their focus on timeframes as low as the M5 and M1. Aiming towards capturing 5-10 pip movements, scalpers use smaller lot sizes in comparison to swing and day traders. Nevertheless, this trading style comprises of drawbacks such as indecision and a high degree of emotional state. Since the main purpose of scalping is capturing small price movements identified on lower-timeframe graphics, the noise and confusion is relatively high.
While all trading strategies have their own benefits and drawbacks, choosing a trading style that suits your goals and interests the most is highly linked with your personality. If you are a patient and, at the same time, a busy person, swing trading might be the best option for you. On the other hand, if you have enough time and patience to sit in front of the charts and execute trades on a daily and hourly bases, then either day trading or scalping might be the best variants to opt for.
Either way, it all narrows down to patience, long-term vision, discipline, persistence, and risk management. Choose one or two securities that you like trading the most, do not get discouraged while experiencing losses and moments of hardship, remain cold blooded and long-run oriented.
Investroy

The Simple Plunge StrategyHello dear @TradingView community!
Welcome to @Vestinda, your trusted trading companion in the ever-changing world of financial markets. Our team is passionate about giving traders like you the tools and knowledge to make smart decisions and achieve your investing and trading goals.
At Vestinda, we know that successful trading involves using effective strategies, analyzing the market, and managing risk. That's why we sharing a strategy that can help you make the most of downward trends — The Simple Plunge Strategy.
This strategy is designed to help you navigate downward movements in the market with confidence. It focuses on spotting specific patterns that occur during sharp drops in cryptocurrency prices. By understanding and applying this strategy carefully, you have the potential to increase your profits.
The Simple Plunge Strategy involves looking for certain signs: a strong and sudden downward movement in price, shown by a big candlestick with high trading volume. After the drop, the price often recovers to levels seen when the candlestick opened. By closely watching how the price moves across certain boundaries, you can find good points to enter trades and set your profit targets and stop-loss levels.
To use the Simple Plunge Strategy effectively, it's important to find the right entry points and manage your risk. You can find entry points by watching the price as it rises above the starting point of the candlestick with a big volume. To determine your profit target, you can use half of the candlestick range. And to manage risk, you can set a stop-loss order above the previous high point.
This strategy can be used with different timeframes, but looking at 15-30 minute intervals can give you opportunities for quick trades. When applying the strategy to cryptocurrencies, look for coins or tokens that have experienced significant drops with high trading volume. Watch how the price moves above and across the starting point of the drop to find potential entry points.
You can also find examples of Simple Plunge patterns on CEX platforms, which list various cryptocurrencies. Take a look at coins such as ETH, DOGE, and others to see instances where the price sharply drops and then rises again, indicating possible entry points.
Remember, the Simple Plunge Strategy can also be used in reverse to identify opportunities during upward movements. A similar pattern often occurs when prices rise.
We'd love to hear your feedback on the Simple Plunge Strategy.
Have you tried this approach in your trading?
Share your thoughts, questions, and experiences in the comments below.
Let's have a lively discussion and support each other in the world of trading.

Unpopular trading advice: fall in LOVE with one pair ONLYIn a world where you can love anyone and anything your heart desires, fall in love with ONE currency pair ONLY.
The notion of "the more pairs I trade, the more money I will make" is false. If you wanna be a consistently profitable trader, it is more beneficial to focus on a small selection of securities and master them, and there is a concrete reason for that. Concentrating on one or two currency pairs instead of trading every single major, minor, and exotic pair will be more efficient, less confusing, and more profitable. When you study every single movement of any given pair, you get more experienced at trading it and you make more rational decisions and analyses.
Looking at the chart illustration, we might observe the trading log of all transactions we executed in April and May so far. With 8 trade entries and all of them being EUR/GBP, a total return of +9.6% has been generated constituting an approximate win rate percentage of 70%. Obviously, not every trade resulted in being profitable as we encountered 2 losses and a breakeven closure. Nevertheless, as we always indicate, trading is a game of big numbers and probabilities. Instead of trading 10 securities, we have only been focusing on one single currency pair recently.
One crucial thing that needs to be noted is the following: not always will the one specific currency pair of your choice provide you with clear swing opportunities as the example of EUR/GBP portrayed on the graph. Periods of long and dull consolidations, indecisions, and some other moments will take place and make a derivative unlikeable and less efficient to trade for a period of time.
Therefore, always have one or two other trades on the radar to eventually monitor and analyse along with the currency pair of your preference.
Love will save the world.
Investroy.

Trader ⚔️VS⚔️ Analyst !!!(Differences)Hi, everyone👋.
Do you like surfing or guiding surfers?
In this article, I will talk about how analysis differs from trading. A good analyst is not necessarily a good trader📉. Do you know what the point is❗️❓
The point is that analysts talk about all aspects, so they always tell the truth and explain what really happens on the market, but the traders ride the waves. Financial markets include high and low waves, so if a trader makes a mistake in measuring its depth, speed, and height may drown in the sea. If you are a trader, don’t be proud of yourself because the financial market sea is very cruel or a beast.
—------------------------------------------------------------------------------------------------------------------
There are four trading keys in financial markets:
Trading Strategy
Capital Management
Market Psychology
Trader Psychology
These keys are like four legs of a chair🪑 which should be sat on carefully and calmly. Although by removing one of the legs, it’s possible to sit on the chair, safety has to be considered.
I’ll explain all the trading keys in the market in other posts later, but for now, let me dig into the differences between Analysis📈 and Trading💰 .
What is considered in the analysis are the price targets in both rising🟢 and falling🔴 markets, the probability of its occurrence and non-occurrence, and the necessary conditions for both.
Considering the subtlety of an analyst's words and the mentality of the people studying - who are mainly looking for confirmation of their position - generally, the analyst will always be right unless he has declared only one direction decisively, which is not an analysis, but a signal and prediction.
Declaring an upward↗️ or downward↘️ trend in only one direction is not an analysis but a prediction. It’s noted that any prediction can be wrong. But in the comprehensive analysis of both sides, the necessary conditions for their occurrence and their probability are stated, so whatever happens, the analyst is right, and you will hear the famous saying "as predicted."
🔷 A successful trader can take the following steps:
Comprehensive analysis of the market situation in which he wants to trade:
The technical analysis must be prepared before opening a trade position. A wrong analysis does not always lead to a wrong trade, and vice versa, a correct analysis does not lead to a correct trade because you have to see whether the position trigger is activated or not.
Find useful trading strategies to achieve profitable trading:
A trading strategy can be a system that includes a combination of different indicators and oscillators, which can finally indicate the entry and exit points as well as profit and stop loss while trading. This system makes you behave like a robot; after understanding and analyzing the market, you’ll wait for the entry and exit points to appear. Trusting this trading strategy is one of the critical keys to successful trading.
All the points mentioned so far are related to the technical analysis aspects; otherwise, in the Fundamental field, a daily checklist of various factors affecting the market is needed, which is vital for Fundamental analysis.
Find your own timeframe:
Chart analysis and trading can be viewed from the 1-second time frame(short-term) to several years(long-term), but every trader should have his own time frame based on his trading strategy.
The time frame is important because:
The trading strategy should help traders find the entry and exit signals in the same time frame.
The Stop Loss(SL) should be determined based on entry points in the same time frame.
The time required to reach profitability is estimated based on the same time frame. You can't analyze on a daily time frame and expect to get a very good profit immediately after entering the position.
After determining the time frame and with the help of the trading strategy, the following tasks should be done.
Studying market analysis to identify market trends, the state of market movement waves, and daily, weekly, and monthly support and resistance zones.
Determining the Entry Points(EP) based on the strategy
Determining the Stop Loss(SL) based on the strategy
Determining the Take Profits(TP) based on the strategy
All the above must be done before entering the market, and the only thing done after entering the market is the last step—changing the exit point based on the variable stop loss to increase profit.
—------------------------------------------------------------------------------------------------------------------
🔷 Conclusion:
According to the explanations given, it can be understood that analysis and trading have a significant differences. It should be noted that every wrong analysis published on social networks does not indicate that the analyst does not trade well and vice versa. So, to profit from the financial markets, you must be trained in the first step. Become an analyst and then trade. For this, you have to go step by step, don't be greedy, don't rush, so that you can stay in the financial markets and earn profit every day until you get a continuous profit one day.

EURUSD: Part 1 funny story!I. Not proficient unconsciously.
When you enter the market and start trading, you may think that it's a great way to make money because you hear a lot about it and know of people who have made a lot of money from Forex. However, it's important to note that this is just the first stage and, like when you first learn to drive, it may seem easy at first but can be challenging as you continue to learn. Prices in the market can fluctuate wildly, adding to the complexity of Forex trading.
When you're new to trading, it can be overwhelming and confusing. You may find yourself unsure of what to do when you see the prices fluctuate in the market. Without proper knowledge, you may take risks that could potentially harm your trades. You may even fall into a cycle of increasing your trading volume when you feel confident, only to end up losing capital in the long run. This is a common stage for beginners that typically lasts a few months to a year before moving on to the next phase.
Continue ...
I will release the next part tomorrow, stay tuned.

6 simplest and most effective forex trading methods!Popular forex trading methods
Typically, strategies for forex trading are primarily founded on fundamental and technical analysis. Hence, astute traders possess the skill to creatively merge efficient trading techniques to identify the most appealing gains.
1. Day trading
Day trading is a trading strategy where traders, known as day traders, do not hold any trades overnight and close all orders before the end of the trading session. Day traders commonly use technical analysis to assess and capitalize on price changes by observing time frames or trading volumes throughout the day. Typically, day traders keep trades open for a few minutes to a few hours.
- Advantage: By effectively managing risks, traders can secure monthly profits without having to worry about prices moving unfavorably due to news or paying overnight fees. Additionally, closing positions at the end of each session can help avoid potential risks.
- Defect: Monitoring the market throughout the day can be both stressful and time-consuming for traders. Failure to do so could result in significant losses if the market experiences a decline or deviates from predicted movements.
2. Scalping
Scalping, a technique utilized by investors known as Scalpers, involves short-term trading wherein orders are held for just a few seconds or minutes at most. This approach entails buying and selling multiple times a day to capitalize on minor price movements within short time frames in order to gain small spreads. Scalpers execute numerous orders during trading sessions due to the brief trading period. With adept use of financial leverage, a trader can typically earn 5-10 pips per trade on average. However, choosing a broker with low spreads and commissions is crucial for maximizing the benefits of the scalping approach and minimizing trading costs.
- Advantage: There are always plenty of profitable trading opportunities every day. Overall income is quite high.
- Defect: Always have to watch forex charts for hours. The mind is always tense and pressured.
3. Swing trading
Swing trading is a strategy used by traders to take advantage of oscillations in the market. It involves holding positions for a few days to weeks, typically averaging two to four days. This approach relies heavily on technical analysis, including candlestick patterns, support and resistance levels, and indicator lines, to identify suitable entry and exit points. Since it is a medium-term strategy, traders usually analyze forex charts on 1H (1 hour) and 4H (4 hours) time frames.
- Advantage: You don't have to constantly monitor the market like scalpers and day traders, which frees up time for other important tasks. This allows for a more relaxed mental state and less pressure. The rate of return is still quite appealing.
- Defect: Take the risk for holding orders overnight. It is not possible to get a large profit when the market has strong fluctuations in a bad trend.
4. Position trading
Position trading is a trading strategy that involves holding orders for a prolonged period, ranging from several weeks to even years. Consequently, forex charts of position traders are viewed over days or weeks. Unlike scalpers, position traders rely more on fundamental analysis rather than technical analysis to make informed decisions regarding future price trends and determine whether to buy or sell currency.
- Advantage: No need to spend a lot of time "watching" the market. The sentiment is relaxed and not under great pressure because position traders are not affected by short-term price movements. Profit margins can be huge if the market moves according to your expectations.
- Defect: Requires traders to have a solid background in fundamental analysis and technical analysis, especially when it comes to regularly monitoring economic and political news in the world. The capital requirement is quite large as the stop loss is usually deeper. Profit is calculated on an annual basis because the number of trades is very small.
5. Price action
Price action trading is a technique that involves analyzing previous price movements to make technical trades. This strategy can be used alone or in conjunction with other technical tools. Fundamental analysis is seldom used by price action traders, who instead rely on resistance/support levels, Fibonacci retracement, price patterns, and indicators to determine entry and exit points. Price action trading is applicable to short, medium, and long-term timeframes, and investors are advised to analyze prices across multiple timeframes for a more comprehensive and precise overview.
- Advantage: Trading is relatively simple because mainly just using candlestick charts. Therefore, the price action method is very suitable for new traders. Cultivate analytical thinking ability.
- Defect: For intensive use is very difficult. It is highly subjective, depending on the assessment and experience of each trader. There are many risks such as strong price fluctuations or the market being manipulated by the makers.
6. High-Frequency Trading
Price action trading is a technique that involves analyzing past price movements to make technical trades. This strategy can be used alone or in conjunction with other technical tools. Unlike fundamental analysis, price action traders rely on resistance/support levels, Fibonacci retracement, price patterns, and indicators to determine entry and exit points. This approach is suitable for various timeframes, and investors are advised to consider multiple timeframes for more precise analysis.
- Advantage: Contributing to stabilizing the market to avoid strong price fluctuations. From there, helping traders limit big losses. Make full use of the price difference and make a profit.
- Defect: Trade with fast speed and large volume, so it is easy to have a strong impact on the market. No broker involvement due to complex algorithms applied. Easy to cause virtual transactions.
How to choose the right trading method for you
1. Determine the purpose of forex investment.
2. Determine the transaction time.
3. Consider some other factors.
Conclude: The article mentioned six successful forex trading methods along with their benefits and drawbacks. This comprehensive guide will assist you in selecting an investment plan that aligns with your objectives and vision. By skillfully combining these trading methods, you can increase your chances of successful transactions. Good luck in achieving your investment goals!

6 Short term Forex trading tips.To succeed in short-term forex trading strategies such as scalping and intraday, there are six key secrets that must be understood and implemented. These secrets are essential to success and have been proven effective.
1. Trading capital
Many traders aim to grow their small account from 10$ to $100 by frequently trading small orders, and some may even turn it into $100,000. However, it is not a guaranteed outcome for everyone. Short term trades require sufficient capital as they involve frequent opening and closing of positions. Failure to understand concepts such as Lot determination, pip valuation, and capital management may result in significant losses. Having low capital increases the risk of losing the account quickly, especially if the trader has poor control over their gains and losses.
2. Determine leverage
It's important to keep in mind that leverage has both positive and negative effects in Forex trading. Traders often suffer losses not because of their trading abilities, but rather due to two primary reasons:
Do not know how to use leverage, or abuse leverage
Lack of funds
When you use full leverage to trade, you are putting your account at the highest risk.
3. Transaction costs
All businesses have to bear transaction costs, and in the case of the Forex market, these costs are in the form of Spread, Comission, and Tax. The frequency of transactions directly impacts the escalation of costs, which can be pretty significant, especially for accounts that incur high Comission charges. However, if you avoid Comission, you may have to bear high Spread costs instead.
If you are interested in scalping or intraday trading, it is advisable to select a broker that offers low commission and narrow spread. But make sure that you are using an ECN account, as it will only require you to pay the commission fee. Moreover, it is suggested that you enroll in an IB account to receive additional commission rebates. It is crucial to consider these factors while choosing a broker for scalping and intraday trading.
4. Fluctuations of market trends
For traders who engage in Intraday and Scalping, it is crucial to select the appropriate position for trading. The initial step involves assessing the overall market trend, followed by recognizing significant price levels. You should then analyze the underlying factors that influence short-term fluctuations within those price levels. Lastly, you must opt for a Forex trading timeframe that aligns with your trading approach.
5. Scalping and Intraday Trading Strategy
To effectively track and analyze the shorter time periods M1 and M5, it is important to identify the four factors and key rate areas that can lead to errors. After doing so, it is recommended to backtest and determine if any of the trading frameworks are suitable. An effective intraday and scalping strategy is to utilize the breakout trading strategy, specifically targeting psychological zones such as support and resistance zones.
6. Trading Psychology
When it comes to short-term trading, traders face greater psychological pressure and must exercise more patience in order to achieve maximum profit while minimizing risk. Compared to long-term traders, those who engage in short-term trading experience more pressure. Additionally, it is important for traders to maintain a high level of trading discipline by entering trades quickly, placing accurate and timely orders, and avoiding greed. These factors are essential for success in short-term trading.
Greetings to all traders! I have some valuable trading-related information that I would like to share with you ❤️

The Process of Creating StrategyHello traders,
In this post i am going to show that how we can create and develop the trading strategy that works.
Now the first step we need to do is just search and find the any trading method that suitable for us for example that would be like elliott wave, ict concept, VSA, just using indicators and maybe you can also create your own method and backtest it. when you learned the method now its time to create your trading rules every strategy has own different rules like what is your risk to reward ratio? what is your trade management plan? either you manage your trade or just take the trade and come back after its hit TP or SL, how much is your daily limit means how much trades you will be taking in a day or in a week if you want to become a swing trader depends on you, what is your risk per trade? can you will be cutting the risk to half or just use fixed risk after lose trade? what is your daily limit of losing? can you hold trade overnight or over weekend? what is your trading timeframe? what is your trading sessions? etc...
These all kind of rules you will be require to create for yourself they might be different rules depends on your strategy method now we learned the method and created the rule move forward to the next step is open the live demo trading account and trade with your strategy and apply the rules don't break the rules that you created trade at least 30 days and journal your data your taking trades after 30 days check the journal you will see your data for example in your rules you set 1/2 risk reward ratio so you need to have around 40% winning ratio check the journal check the results did you have a 40% winning ratio if the answer is yes then good to go i am sure that you know what to do next but if you failed and your winning ratio is below 40% now analyze your journal data the trades you taken you will see some of bad trades that you don't wanted to trade again just avoid those trades next time and try again the process for the next 30 days. repeat the process one day you will be profitable and consistent but if you not then try again again learn from your mistakes and don't do that mistakes again.
When yo have been profitable this is the time you wanna enter in the market open the real live trading account and start trading with your strategy and follow the rules that you created for yourself run the process and always remember trading is not quick rish scheme you need to have a lot of patience, trading is a long run game like marathon race and its required patience. some of my advice is don't try to break the rules, don't depend on one trade, some times market will give you some results that you don't want from it but be patient and be consistent with your strategy with your rules, you will be facing drawdowns but that is the learning process you will learn a lot from the drawdown so with the time you will be better consistent and be profitable just don't leave the process too soon and believe in yourself and try again again and again, trading is a very beautiful and also the easiest thing to live life but firstly in the starting it required from us to pass the test. trading is a very easiest thing but also a very hardest thing. i hope you find this post useful, i wish you good luck and good trading.
If you like the post, boost my work with like comments and share thanks!

The Two Types of Risk Management PlanHello traders,
1) Fixed Risk
Calculates position size for next trade as a percentage of account depend on how much risk you willing to take every time every trade you taking you need to use fixed risk for every trade like for example 1% risk per trade so in this type of risk management plan we should require 100 losing trades in a row to blowing out our account a lot of people just using this simple method and this is very easy and understandable.
2) Cutting the Risk :
In this method cutting the risk we just normally trade 1% risk per trade but if we lose that trade so we just cut the risk to half for example if i trade with 1% risk and i lose so now the next second trade which i am taking i will be using 0.5% risk in that trade if i lose then i will be just keep using the same risk 0.5% some traders are are keep reducing the risk size like they come all the way to to 0.25% maybe they work for it but in our scenario if we keep losing we will be not reducing more than 0.5% risk per trade and when win comes then after our winning trade we will be back to the normal risk which is 1% risk per trade and keep trading with 1% risk per trade so short summary is if we lose cut the risk to half if we when if we win back to the normal risk if we win again stay with same normal risk but if lose then reduce the risk to half.
The reason behind that is in the fixed risk you have 100 traders to blowing out your account means 100 chances but in cutting the risk now we just calculate if we lose 100 trades in a row like fixed risk we would not blow out our account,, let's say we take our first trade and we lose now we are in -1% then another trade we will be taking with 0.5% per trade risk so here is 0.5% × 100 trades = 50 means if we continue to lose in a row after 100 trades we will be facing -50 draw down, so cutting the risk to half after lose trade is the safest method who wants to play safe and more chances to survive in the market.
I wish you good luck and good trading.
If you like the post, support my work with like comments and share thanks!

Patience in Trading Hello traders,
Patience in trading is ability to wait to take the right action, if you have not enough patience you will have bad trades bad decisions and cause you to take action too soon.
3 things you should avoid if you want to become a better trader and improve your patience in trading.
1) Don't Rush :
Market is there not going anywhere so don't need to rush in bad trades stick to your best trade setups and always looking for an opportunity don't rush into normal trades.
So don't need to rush just relax and take things step by step, enjoy the journey of your trading.
''If you need to hurry, you are already too late''
2) Over Confident :
Over confident is a very worse thing especially in trading when someone overestimates their own skill and knowledge which can lead to them making mistakes.
There are some types of over confident like wishful thinking, over ranking, and illusion of control etc...
These all of types over confident can lead to big losses in trading.
Some of things that you can do to overcome your over confidence in trading is :
> Don't believe too much in your skills
> Always use stop loss
> Don't thinking just only for today
> Create your trading rules and don't break stick to it
> Always stay in the middle line don't go to the extreme which cause you over confident and don't go to the slight which cause you depression.
''We can never reach a stage where we can say, i know everything and i have nothing more left to learn''
3) Believe :
Believe in yourself if you don't have enough believe in your trading system or any kind of decisions you take in trading you can lead to big losses like comes in fear and try to close running trades and don't have enough believe in your taken trades.
Try to believe in yourself, try to believe in your decisions, try to believe in your trading system and be patient with your taken steps and wait for the outcome either it will bad or good doesn't matter just continue the process and learn from your previous mistakes and be better next time.
''Trust yourself, you know more than you think you do''
These are 3 things that you should need to do for patience in trading.
If you have any advice to be patient in trading please let me know in the comments.
I wish you good luck and good trading.
If you like the post, please support my work with like, thank you!

Trading is a game of numbers and probabilitiesFirst of all, let us clarify, that what we mean by a "bad trade" is simply a transaction that was unsuccessful . There are no "good" or "bad" trades as the whole system of trading is random and unpredictable. In other words, if we knew how to differentiate between bad and good trades, then technically, we would always choose to enter good trades, right? Or should we wait for our trades to close before we label them "good" or "bad"?
Anyways, moving to the main part, we would like you all (especially beginners) to embed the following in their minds forever: trading is a game of numbers and probabilities.
No, you will not have a 100% win rate.
No, you won't be making 200 pips per day.
Yes, you will have losses.
Yes, things are gonna get emotional.
The above-stated may seem bizarre to newbies. "Like, what do you mean I cannot make 200 pips per day? This Free Forex Signals group on Telegram shares 50 signals per day and promises me a 100% return per month and you are telling me I cannot make 200 pips a day? Hahaha, do not make me laugh".
Been there, listened to that.
At the beginning of our trading careers, we are greedy, emotional, and extremely optimistic about our skills and abilities. We get angry, question ourselves, change our strategy every second day and so forth. All that up until we get more mature and wise in the markets. With time, we gain experience and double up on our skills; and that is exactly when we become acknowledging the market for what it actually is and understand how it functions.
Experienced traders think, move, and act in probabilities. They predetermine their risk, calculate all possible outcomes, execute at ease knowing that they are following their strategy. To put it into simple English, they do not get mad over one loss, because they know that their backtested and fully planned strategy is there to lead them towards long-term profitability and consistency.

From Zero to Hero: The Art of Finding Winning Crypto Projects!!!Hello there, fellow traders👨💻! As a trader, I know that choosing the right crypto project to invest in can feel like navigating a sea of uncertainty.
But fear not mateys😎!
Today, we will set sail on a journey to discover the best crypto projects.😉
I will examine critical factors to help identify the most promising crypto projects💡.
But I won't be venturing blindly into the unknown.
Oh no, I have a trusty checklist for each crypto project to guide us on our quest.
I give a score from 1 to 10 for each factor.
With this checklist in hand✅, we will be able to evaluate each crypto project based on essential factors(But I must say that the ✨ starred factors ✨ are more important in our checklist).
So let's dive into the factors.
Founders ✨: The founders' vision, expertise, reputation, leadership, and decision-making abilities are essential to a crypto project's success and sustainability.
Project's Goal ✨: The project goal is a critical component of a crypto project that defines its purpose, attracts investors, guides development, and measures success.
Source Code ✨: The importance of source code in a crypto project lies in its ability to determine its functionality, security, and transparency. Access to source code enables security experts and auditors to review the project's security measures, identify weaknesses, and recommend improvements. Open-source projects promote transparency and accountability, building trust among stakeholders. Also, new commits submitted to the project can be analyzed through the project's repository.
Token Inflation Rate ✨: The importance of a crypto project's token inflation rate lies in its impact on the token's value, liquidity, and long-term sustainability. A high inflation rate can decrease the token's value and liquidity, while a low inflation rate can promote token scarcity and sustainability.
White Paper Analysis ✨: The importance of a whitepaper in a crypto project lies in its ability to communicate the project's vision, value proposition, and technical specifications to investors. It is a marketing tool, technical specification document, project blueprint, and credibility establishment tool.
Community ✨: This is a significant factor when analyzing a crypto project. Community in a crypto project provides the ability to support the project's growth, adoption, and sustainability. A strong community can promote adoption and awareness, provide feedback and insights, offer support and resources, and promote the project's values and mission.
Tokenomics : Can determine the token's value, utility, and sustainability. Tokenomics can help balance token supply, demand, and circulation, design token utilities that incentivize user participation, and regulate token supply to promote.
Developers : They play a crucial role in a crypto project, as they are responsible for designing, building, and maintaining the project's software and infrastructure. The importance of developers in a crypto project lies in their ability to ensure the project's functionality, security, and scalability. Developers are responsible for designing, building, and maintaining the project's software and infrastructure, promoting innovation and creativity, and promoting the project's vision and values.
Venture Capital (VC) Investors : The importance of VC investors in a crypto project lies in their ability to provide the project with funding, expertise, and connections to help it grow and succeed. VC investors can help the project overcome challenges, expand its reach, and promote its legitimacy and credibility.
Competitors : Comparing a crypto project to its competitors is essential to understand its strengths and weaknesses, assess its potential for growth and profitability, identify any potential risks, and evaluate the project's unique features. These factors are critical for making a well-informed investment decision in crypto.
👆According to the factors mentioned, getting lost in this sea is challenging.👆
With this map or lantern, you will find your way to the safe shore and the treasure.💎
Warren Buffett once said, "Risk comes from not knowing what you're doing." In today's ever-changing financial markets, staying informed and making well-informed investment decisions is more critical than ever.
So hoist the anchor and embark on this exciting adventure together.✌🏻 With this checklist and knowledge, you'll be able to navigate the treacherous waters of the crypto market and find the projects that will lead you to the ultimate booty - success! 🙏🏻😍
Share your ideas with me💡, and if you have any questions❓, you can ask in the comments.💬
Learn and always stay updated📚.
Don't forget to invest what you can afford to lose.💸
Discretion is the greater part of valor.🤗

What is Candlestick Pattern?Candlestick patterns are a charting technique used by traders to analyze the price movement of financial instruments. They originated in Japan in the 18th century and were used to track the price of rice. The technique was later adapted for trading other assets like stocks, currencies, commodities, and cryptocurrency.
Candlestick patterns are an important tool used by traders and investors to analyze the price movement of financial assets. A candlestick is a visual representation of the price movement of an asset during a specific time period. Each candlestick represents the opening, closing, high, and low prices of the asset during the period. The shape and color of the candlestick provide important information about the price movement of the asset.
Candlestick patterns are formed by the combination of one or more candlesticks, and they can indicate a potential trend reversal, continuation, or indecision in the market. Some candlestick patterns are based on just one candlestick, while others are based on combinations of two or more candlesticks.
A bearish candle (red candle) represents a period of trading where the closing price is lower than the opening price. This indicates that sellers were able to push the price down, indicating a negative sentiment in the market. The bearish candle has a long body and a small lower wick, indicating that sellers were in control for most of the trading period.
A bullish candle (green candle) represents a period of trading where the closing price is higher than the opening price. This indicates that buyers were able to push the price up, indicating a positive sentiment in the market. The bullish candle has a long body and a small upper wick, indicating that buyers were in control for most of the trading period.
Both bullish and bearish candles can come in various sizes and shapes, indicating different levels of buying or selling pressure. For example, a long bullish candle with no or a very small upper shadow could indicate strong buying pressure, while a short bullish candle with a long upper wick could indicate weaker buying pressure.
Different types of candlesticks Pattern:
1. Bullish Candlestick Pattern
- Hammer
- Inverse Hammer
- Bullish Harami
- Bullish Engulfing
- Morning Star
- Three white soldiers
2. Bearish Candlestick Pattern
- Shooting star
- Hanging man
- Bearish Harami
- Bearish Engulfing
- Evening star
- Three black crows
Doji: Gravestone Doji
Dragonfly Doji
Long-legged Doji ( Spinning top )
In the upcoming post, we will elaborate on the various types of candlesticks and how to use them.
Thanks
Hexa

Bull and Bear Traps!!!👨🏫Hello, dear traders🙋🏻; I am Pejman, and welcome to TradingView Tunes📺. As a lover of classic cartoons, I would like to explain Bull and Bear Trap using the Road Runner and Coyote cartoons😍.
If you've never seen this cartoon👀, let me tell you, it's a masterpiece of trapping and pranking. But what does it have to do with financial markets🤷🏻❓
Believe it or not, there are some striking similarities between the traps Coyote🐺 sets for Road Runner🐦 and the traps that exist in financial markets💲. The market traps are known as bull🐮 and bear🐻 traps, and they can lead to significant losses if investors aren't careful.🙍🏻
For example, the Coyote paints🖌️ the road to drag the Road Runner to a suitable place and traps him with stones🪨 and TNT💣. Or he is trying to surprise the bird with TNT & cactus🌵, in another way.🤭
Large financial institutions and market makers, or whales🐋, try to deceive amateur traders in the financial markets. Like coyotes, they try to trap inexperienced people by creating fake buy🟢 and sell🔴 signals.
To trade with these traps, you should know technical analysis to neutralize the coyote traps of the market like Road Runner.😉
In the financial markets, we have two types of fraudsters. Bulls are the ones who buy and cause prices to rise☝🏻, and on the contrary, bears are the ones who sell and make prices fall👇🏻. Simple enough, right😊❓
However, I explained more about bulls and bears in the market types post👀. You can refer to this post to better understand the rest of the article.👇🏻😉
Every hunter needs prey. For example, we said that the Coyote used to paint the roads. Exactly bulls, by pumping up the price and bears by a sharp drop in the price, fool the inexperienced people. Also, all these events are short-term.
Like Road Runner, you have to pay close attention to the market⚠️.
In this post, I will teach you how to turn threats into opportunities and profit from them.✅
The first step is to identify these traps. Our first trip today is the bull trap.
----------------------------------------------------------------------------------------------------------------------------------------------------------------------------------------------------------------------------------------------------------
Bull Trap:
Let's start with the Bull Trap🏁.
This is when the market looks like it's on the up-and-up⬆️, so you start throwing money around like a looney tune💸. But just like Coyote's contraptions, the market can suddenly backfire and leave you feeling like you just got hit with an anvil💥.
It's enough to make you want to go "meep meep" all the way home☹️🏠. Be like Road Runner and stay alert, or you'll end up with a crate of dynamite💣 strapped to your back. That's a bull trap in a nutshell.
A bull trap is when the market appears to increase, so investors jump in, hoping to make a profit. But then, the market suddenly drops, and those investors are left holding the bag👜. They thought they were getting ahead of the game but were just falling into a trap.🪤
You may be fooled by the chart and expect the price to pump up, but in reality, the price will start to fall or act like a reversal pattern.↩️
At this time, those who traded without stop loss🚫 will lose the most. It would help if you watched out for these traps in any type, whether up, down, or sideways (range market).
The price must be below a resistance zone for a bull trap to form a reversal pattern. A bull trap can change an uptrend to a downtrend after creating classic reversal patterns such as double tops, heads & shoulders, diamonds, etc.😉
If you want to know the patterns and learn classic patterns with a quick review⏩, you can get help from the following post.
Now that you know this trap, we can talk about ways to recognize and deal with this trap.
How to recognize the Bull Trap🔎
Sir John Templeton says: The four most dangerous words in investing are: "This time it's different."🤔
We may have said these words and confused real traps with fake traps. But how can you prevent this mistake?🤷🏻
Do you remember that we talked about fake and valid breakouts in the Support and Resistance post?💭
You can also read the link below for a background on this topic.
Let's go back to our topic. To ensure that the breakout is valid, we should look for two confirmation signs✅️:
1. Increase in Trading Volume
2. Bullish candlestick patterns
Now let's go through each one in detail because the devil👹 is in the details 😂.
Increase in Trading Volume
For the breakout to be valid, the volume📶 of the broken candle must be significantly higher than the previous candles. But more is needed because coyotes are clever and intelligent. Even after the breakout, the trading volume for the other candles should remain high to ensure the failure is real.
In a bull trap, the volume of the fake breakout candles either does not increase or only slightly.
If you see that the trend has lost momentum after breaking out or has no strong momentum to continue or start the trend, this is precisely the trail of coyotes in the market.
Along with market volume, considering candlesticks and their patterns can be equally helpful as they clearly show market movement.
You can take a look at the following post to learn about these candlestick patterns and review them.
For example, by seeing bullish candlestick patterns, you can understand that a breakout is not fake.
Bullish Candlestick Patterns:
If the breakout candle is a giant momentum candle, it's called a Marubozu , which is not difficult to find on the chart. This candle has a green and long body, and its wick is tiny compared to its body, or it does not have a wick at all.
This candle is associated with a high trading volume, and it shows that TNT is not working in this upward trend, and real buyers are in the market.
Also, the pattern of the 👩🚀👩🚀👨🚀 Three White Soldiers 👩🚀👨🚀👩🚀 is a reversal pattern that can be seen as a continuation pattern in the charts.
Along with all these signs, you should always keep the market trend in mind.
----------------------------------------------------------------------------------------------------------------------------------------------------------------------------------------------------------------------------------------------------------
Bear Trap:
Next up is the Bear Trap.
This is when the market looks like it's going to crash💥 and burn🔥, so you start selling your assets like there's no tomorrow.
But just like Coyote's rockets, the market can suddenly bounce back and leave you feeling like you just got flattened by an Acme anvil.
Don't panic! Be like Road Runner and stay calm, or you'll fall off a cliff.
Bear traps are similar to bull traps. Young and inexperienced bears🐻 are caught in these traps.
When the young bears think the market is going down, these traps are activated, and the hunters place heavy buy orders.
At this moment, this heavy order will cause the price to turn upward, and anyone who has a short position without a stop loss will lose their money💸.
A trap is a trap, and it doesn't matter if it is a bear or a bull🐮. Here we use the duplicate confirmations we used in bull traps, like a steady increase in trading volume and continuation candlestick patterns.
When a support zone is broken, hunters prepare to set traps. If the bearish momentum candle is not accompanied by increased trading volume, this can be a sign of a trap.
The ⚫️⚫️⚫️ Three Black Crow ⚫️⚫️⚫️ candlestick pattern is usually a reversal pattern but sometimes acts as a continuation pattern. If a high trading volume accompanies this pattern, it can be a valid sign of a breakout.
Now I will tell you how to use these traps (Bull&Bear) and get profit from them like a professional trader.
----------------------------------------------------------------------------------------------------------------------------------------------------------------------------------------------------------------------------------------------------------
How to trade with a Bull Trap
The bull traps start with an uptrend. As you can see the picture has a resistance zone, and the price may test a zone several times before passing it.
When a fake breakout occurs, it may initially be accompanied by an increase in trading volume, but it is entirely temporary, and you will notice a decrease⤵️ in the intensity of the trend from the next candles.
When the intensity of the trend decreases, market coyotes activate their traps. And they set sell orders, and the bloody🩸 candles appear on the chart.
With a valid breakout of the last support, the price reaches our entry point station⛽️. You can place your stop loss a little higher than the top of the bull trap and place your stop loss🚫 above the breakout candlestick of the support zone, considering the higher Risk-Reward ratio.
To find the take profit💰 point, consider the difference between the peak trap and the support zone as X, and Viola, now expects X amount to profit from your entry point.
----------------------------------------------------------------------------------------------------------------------------------------------------------------------------------------------------------------------------------------------------------
How to trade with a Bear Trap
Now it's time for the second trap.
After occurring a valid support zone breakout and an increase in price, you must wait for the price to break through the last resistance zone after a sudden sharp move.
When you can use the signs⚠️, you are sure that the coyotes have abandoned the process, that there is no trap🪤, and that real failure has happened; you can open your long positions.
Now, this passed resistance zone has turned into support, and you can wait for the price to test this area several times for more confidence and then open your entry point.
Like trading in bull traps, in bear traps, you can place your stop loss a little below the valley of the bear trap.
Considering the higher Risk-Reward ratio, you can also put it below the breakout candle of the resistance zone.
The take-profit point is the same as the bull trap, but vice versa. Consider X from the lowest price in the bear trap and the resistance zone.
Now, as much as X, we can expect that the upward trend will continue and precious dollars will rain on our heads.
Now that you have learned about the bull trap🪤 in an uptrend and the bear trap in a downtrend↘️, you should remember that the market is not always up🔺️ and down🔻, and the road runner should also expect traps on the range roads. You should be aware of bull/bear traps in the range market.
----------------------------------------------------------------------------------------------------------------------------------------------------------------------------------------------------------------------------------------------------------
Range Market
When the price gets stuck between the support and resistance zones, the range market is created, and the coyotes also look for inexperienced road runners in this market.
This is a sad story for new traders who rush into positions when they see the resistance or support zone break.
Price fluctuations in range markets are minor; trading in a range market is much more complex than in bull and bear markets.
So I suggest you spend more time on your trading strategies and test them several times.
----------------------------------------------------------------------------------------------------------------------------------------------------------------------------------------------------------------------------------------------------------
Conclusion:
Even in life, some coyotes seek to trick you by creating fake situations. But you have to be careful and smart like Road Runner.
Sir John Templeton believes that: "Bull markets are born on pessimism, grown on skepticism, mature on optimism, and die on euphoria."
And also, David Dreman says: "Bear markets are like avalanches: they start slowly and accelerate gradually before gaining momentum and becoming a force of nature🏞."
In the financial markets, bulls and bears are constantly fighting each other, but the real winners are always those who use various tools and indicators to avoid risk and find safe spots for trading and profit.
Once you practice and familiarize your eyes with all kinds of trends and traps, you will become a road runner in the market.
So, if you want to be like the clever road runner and avoid falling into the bull and bear traps in the financial markets, stay alert, stay informed, and be prepared to adapt your investment💰 strategy when necessary.
In future posts, we will take new steps in technical analysis and travel to the world of classic patterns. So follow the future posts and share your opinions and ideas in the comments. Your comments🎓 are precious to me.
Also, if you have friends👬👭 who are into classic cartoons🎆 and trading, send them this post.

Risk-to-Reward > Win RateWe have mentioned it in a list of our previous educational posts and we will state it again: your risk-reward plan is much more important than your win rate. You can have a 90% win rate and still be losing in the long-run. On the contrary, you only need a 35% win rate to be a consistently profitable trader on the longer term.
Beginners mainly focus on winning as many trades as possible and it is totally understandable, because we have all been there. "The more trades I enter, the more money I will make" principle has destroyed many trading careers. The explanation to the "Why?" question is pretty simple: when we are new to trading, every win gives us euphoria and makes us think we are the rulers of the market. Guess what happens next, the market hits back, puts us in a position where we are stuck in a losing streak, and humbles us enough to quit trading and think it does not work.
As we get more experienced, we lean towards the "Less is more" principle and believe that quality will always be over quantity.
As an instance, we have orchestrated 2 scenarios on the graph.
The example on the upper side of the screen shows how our trader has a 80% win rate but has yet failed to remain in profits due to the fact that he does not have a solid risk management plan.
On the opposite side of the road, we have Trader B who is able to remain in consistent profits by winning only 20% of the executed transactions. All those minor losses that he made got covered by one big win, and as long as he keeps following the current risk management policy and strategy of his, he is sure that he will be consistently profitable in the long run.

Blue Pill or Red Pill? Choose your side ... and do it wisely.“You take the blue pill, the story ends. You wake up in your bed and believe whatever you want to believe. You take the red pill, you stay in Wonderland, and I show you how deep the rabbit hole goes." - the exact line that Morpheus used when offering Neo a choice between two options.
You may wonder how this legendary Matrix reference is related to the trading industry. Believe it or not, even though one of our favourite mottos is “beauty lies within simplicity”, trading can get much deeper and more complex (deep down the rabbit hole) than the traditional textbook method.
Firstly, we have the Blue Pill. “Mike Johnson is indicating that we should wait for a crossover of 50 and 200 Exponential Moving Average levels before executing positions”. Yes, we have all been here. The thing is, 99% of the trading courses and most of those YouTube and TikTok gurus make you believe that trading is as easy as buying when a Double Bottom is formed, selling once a Head&Shoulder pattern has been identified and so on. Obviously, if it was that easy, then everyone would have succeeded in this industry, right? “Let me spoil my charts with hundreds of indicators. Surely, if 80% of them are indicating that the market is bearish, then we should definitely go short”. Yes, been there too. Oh, and let’s not forget this one: “I will just buy at support and sell at resistance, and keep it consistent until I am profitable in the long run”. Wait, but if I have learned all that from Mike Johnson, and he claims to be an 8-digit professional trader with an experience of 20 years, why am I not succeeding? If I follow everything he says, then by the same logic, shouldn’t I be profitable just like him?
And that is exactly why we have the Red Pill. The pill that frees us from the enslaving control of the machine and guru-generated dream world. The dream world is the world where trading is super simple and is as described in the textbooks. However, going down the rabbit hole, one can realise that things are more detailed and structured than they might seem, and that more factors should be considered in analysing, executing, and monitoring setups. While a blue-pilled trader is considering an execution upon a formation of a Double Bottom, a red-pilled participant of the market is waiting for a quick spike below that pattern formation and liquidity grab before pressing the "BUY" button and riding the price to the upside. Analogically, alongside with plain support and resistance levels, a red-pilled trader uses the Fibonacci retracement tool mixed with his/her conscious intuition and years of experience to form-up a bias and enter the markets. And so the list goes on.
One thing to indicate: we are not saying that the methods listed under the Blue Pill category are useless and inefficient. As long as it works for you, you can continue following your own plan and strategy without having to give a damn about opinions and ideas of others. We are just trying to emphasise, that a trader with more experience and knowledge in the markets, and with a more detailed and structured approach of the charts will be a step ahead of those that blindly generate ideas by taking a quick look at the charts posted by others (word of mouth), following every single chart pattern suggested by John Doe on his book about the sorcery of trading.
One last mention, it all boils down to two things: consistency and persistence. No wonder that as long as you keep working on becoming a better version of yourself on and off the markets, your skills will develop further and help you with what we call "opening the 3rd eye". With time, you will make more rational decisions, you will have a clearer sight of the market, you will be more powerful psychologically. Until then, keep grinding till 3AM, keep making mistakes, stay hungry and curious. And remember one thing, only the strongest survive.
With all that being said, we would love to see a nice poll in the comment section below. Which pill are you taking: the Blue Pill or the Red Pill? Feel free to comment below and let us know your thoughts and opinions.
Have a great weekend ahead.
Investroy.
