For Education💯💯This is how i using ict method to find my entry.
From my undertanding ,
at first price should retest to this FVG ( on the left side )( FVG is fair value gap )
to creat a small support then start rally down .
.
But price break through the small support .( You can see it cleary on 1m & 5m TF )
.
And my analysis for larger TF is telling me that the price should going up
,you can see it on my previous post.
.
Then we can start using ICT method to find our Entry.
.
For those who want to study ,it's on Youtube ict mentorship 2022 Ep. 12
.
Good Luck Trader 💯💯
.
.
.
🧅Disclaimer :There are risks associated with investing in securities. Investing in stocks, bonds, exchange traded funds, mutual funds, and money market funds involve risk of loss. Loss of principal is possible. Some high risk investments may use leverage, which will accentuate gains & losses. Foreign investing involves special risks, including a greater volatility and political, economic and currency risks and differences in accounting methods. This is Not Financial Advice
🧅JUST AN OPINION OF THE ONION.🧅
Educationalpost

Power of Having Multiple Confluences in TradingThe more confluences you have, the more confident you are in the fact that your technical setup will play out according to the plan. Confluences come in different shapes and styles, whether it is combining some Moving Averages and Bollinger Bands with price action, or having your grandma flip a coin a decide the faith of Bitcoin.
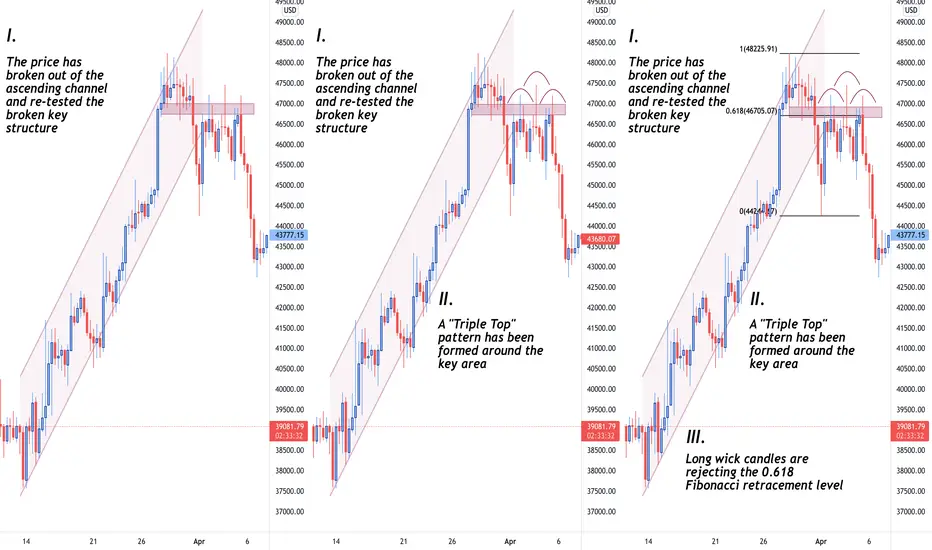
On the graphical illustration that you can see on the screen, 3 confluences have been utilised to back up our idea and they are the following:
1) "Break + retest" formation
2) "Triple Top" pattern
3) Fibonacci retracement tool
It can be noticed from the left hand side of the screen, that the price has nicely broken out of the ascending channel and re-tested the local key structure. Moving to the next step, it can be emphasised that a nice "Triple Top" pattern has been formed. Lastly, we add another confluence to back up a possible scenario that we have eyes on by using the 61.8% Fibonacci retracement level, which is referred to as the "Golden Zone". Taking a look at the chart, we can clearly observe that long candle wicks are nicely rejecting this very zone.
All in all, combining multiple confluences give us enough confluence to back up our sentiment. However, nothing is 100% guaranteed in the markets, meaning that it is not promised that your trade will play out perfectly no matter how many confluences you have. Thus, be risk-tolerant, patient, and cold-blooded!
Have a great upcoming weekend, everyone!
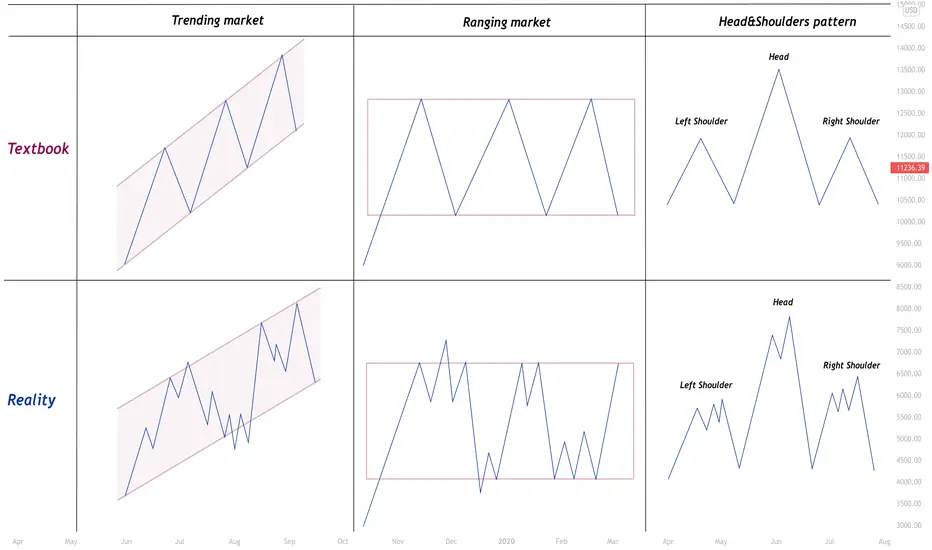
Trading in Books vs Trading in RealityWhat we study in the books is always different from what we have in real life. For example, French language that people learn and exercise in textbooks is slightly different from the French that we speak in France, as we tend towards using informal language and slang phrases. Same rule applies to trading, as the market is not 100% accurate with what we have in the books that educate us on trading. What we have in the books is absolutely crucial to learn the basics and even more. However, while applying the learned theorem in practice, in our case in the real-life markets, we notice that things are different. Thus, it is important to combine these two elements (on and off the market education) to master the craft.
Furthermore, beauty always lies within simplicity. What's written and illustrated in the books, is the most understandable language of trading. Hence, the expression "textbook stuff" exists. The more experience you gain in this field, the more you will realise that it is crucial to keep things super simplistic if we want to have a crystal clear vision of the market.
IGNORE THE NOISE AND NEGATIVE EXTERNAL ENERGYTrading is a one big system that consists of various different components: technicality, psychology, money management and so forth. The most difficult one out of all the elements is definitely psychology. Human psychology is a perplexing system that studies our mental process and behaviour. Our behaviour and mood rely on multiple internal and external factors. In our everyday life, our behaviour towards something can easily change when being affected by negative energy. The very same principles apply to trading. Our decision-making process can easily get fogged and mood get ruined after experiencing some losses, opportunity misses and so on. Even worse, our desire and will to keep trading and striving for success can get intercepted by some negative opinions and attitiudes of surrounding people.
It is totally acceptable to live a life that others do not understand. If you want something really bad, nothing can get in your way and stop you from achieving it. Block all the negative energy. Keep prospering, working towards your ambitions, and proving all the people that did not believe in you wrong!
Investroy

Educational USDJPYAfter a daily morning star formation as highlighted , I waited for a pull and waited for some rejection before going down on lower timeframes to find entry .

What Traders Want vs What Traders Get"It is a marathon, not a sprint". One of the statements that perfectly describes trading. But what does this proclamation really mean? I quote William Shakespeare: "Go wisely and slowly. Those who rush, stumble and fall". Great things take lots of time. 90% of all people get false expectations about trading before they enter the industry. They think it is a "get-rich-quick" scheme. In reality, it takes months/years of practice, hard work and experience to reach the doors of consistency and profitability. Furthermore, consistency in trading does not necessarily imply that every trade will be a winning one. It just indicates that if you keep following your trading plan, be risk tolerant and disciplined, you will be profitable and successful in the long-run.
We encourage you all to be patient and just ride with the trend as there is no need to rush anywhere. After all, Rome was not built in a day.
Hope you all enjoyed this quick educational and informative post! The purpose of this publication was to give you all some guidance and keep you motivated so you can continue your journey to the top of the mountain. If you have any more suggestions and recommendations on what our next educational idea should be about, feel free to let us know in the comments section below.
Investroy

HOW TO use asymmetric compounding 🧐📈The pair in question and four winning trades allows me to cover a subject I've wanted to touch on.
That subject is asymmetric compounding.
Asymmetric compounding is a money management strategy that can accelerate the equity curve of an account.
But you need the right strategy and data available to back up using asymmetric compounding.
Higher the win rate the more asymmetric will work wonders on that equity curve.
In simple terms asymmetric compounding is best suited to strategies with higher win rates as you need consecutive wins to make it work.
The main reason for using this NZDUSD chart is the four winners in a row make it easier to explain the concept of asymmetric compounding.
You traders should know the full ins and outs of your own strategies and if this can be applied.
It's not just win rate also RR along with max losing and max winning runs need to be factored in.
For this example on the four winning trades I am explaining the concept basing it on risking 2% per trade on the initial trade.
As this strategy is a 1:2 risk reward strategy risking 2% sees us gain a profit of 4% on one winning trade.
This is where you can then use asymmetric compounding on your next trade.
Instead of risking 2% again you now risk the 4% gained from the previous trade on this trade.
If the trade goes on to win the 4% risked on that trade has just earned 8% in profit.
At this point you go back to risking 2% on the next trade until you have a win and then risk the 4% gain from that winning trade.
The chart shows four winning trades at 1:2 RR so lets test the concept in numbers.
If we was to risk 2% per trade on a £1000 starting capital account the results are as followed.
Trade one 2% risked 4% gained= £1040 capital.
Trade two 2% risked 4% gained= £1081.60 capital
Trade three 2% risked 4% gained= £1124.86 capital
Trade four 2% risked 4% gained= £1169.85 capital
Now if we apply asymmetric compounding to the same trade sequence staring back at original 2% risk after two winning trades
Trade one 2% risked 4% gained= £1040 capital.
Trade two 4% risked 8% gained= £1123.20 capital
Trade three 2% risked 4% gained= £1168.13 capital
Trade four 4% risked 8% gained= £1261.58 capital
Using asymmetric compounding on these four trades see a capital increase of £91.73 more than just risking a flat 2%.
Below is an example of using a 1:1 RR strategy risking 1% per trade. If trade is a winner then risk 2% on the next trade which is the profit and the risk from the previous trade. #
If that trade wins go back to the intial 1% risk then risk 2% again if that trade wins.
This is a great concept to grow small accounts or even pass funded challenges as with the trades shown on the idea chart you would pass most prop firm challenges in two trades using asymmetric compounding.
However I can't stress enough you as the trader need to know you own risk appetite for this.
You also need to factor in how good your win rates and how often your strategy has seen winning runs that would benefit this concept.
One way to found out is to back test and forward test your strategy to see how asymmetric compounding could work for you.
Thanks for taking time out your day to read over my idea.
Ill see you on the next one 👍
Darren

Stop Loss hunting: the whole truth and the logic behind itGood time of the day, dear TradingView family! Welcome on another educational post by Investroy. Today we are gonna be talking about Stop Loss hunting. We will scrutinise what it is, how it happens and what's the logic behind it, and how to possibly avoid being "liquidated".
Have you ever had the price trigger your Stop Loss before impulsing all the way to your Target Profit and hitting it? If the answer is yes, then you have probably been a victim of Stop Loss hunts. But what is Stop Loss hunting? In simple terms, it is a strategy that forces some participants out of the game by driving the price to the level where they have set their Stop Loss orders. As we all know, retail traders always look for some sort of confirmations before entering a position. It can be a candlestick pattern, a moving average cross, a double top / double bottom formation and so on. They enter a position and set their Stop Loss a few pips above/below the local supply/ demand level . What happens 90% of the time is the price spikes up/down, hits the Stop Loss, liquidates so many positions and participants from the trade, and then continues moving alongside the trend. Why does it happen? Institutional traders know exactly what they need to do and which levels they need to buy/sell. Consequently, they set their buy/sell limit orders at places where they know retailers would set their Stop Losses, because they need to generate liquidity before jumping in the train. It does not necessarily signify that they track where retailers put their Stop positions, it is just they are more than sure which levels are crowded with Stop Loss orders.
We have prepared some examples in order to better elaborate on the issue and scrutinise how the case looks visually. Of course, these are only simple exemplars. It does not unquestionably mean that the price will always behave this way as the market conditions change quite often.
Looking at Example #1, we can see that the price spiked above the level of the right shoulder of the formed H&S pattern before continuing its downside movements. Now, which action do most retailers take once they spot these textbook patterns? They execute right away with their Stop Loss above/below the structure, which results in the positions getting wiped out.
Example #2 shows how the price spikes below/above obvious levels of support/resistance before continuing movements in the deliberate destinations.
Example #3 illustrates how obvious ascending/descending/sideways channels are, and how easy it is to get liquidated instantly, before the price carries on moving in the destined end.
How to avoid being eliminated? Well, you won't always be able to run away from Stop Loss hunting, but if you develop a proper working strategy against it, you will be able to identify possible zones filled with Stop Loss orders and avoid setting one around that area. If you are not gonna think long and hard about where you are gonna put your Stop orders, you will easily get eliminated in a sea of Stop Losses. Thus, think outside of the box and have patience before jumping in a particular trade.
Hope this educational idea is useful! If you have any comments or enquiries, do not hesitate to ask in the comment section below. Also, if you want us to make an educational post on a topic that interests you, feel free to drop your recommendations and suggestions in the comment box as well!
Have a great rest of the week!
Investroy

Trading Mountain: How to reach the top step-by-stepHey, family! Good time of the day and welcome on another educational post.
As we all know, the road that leads to successful and consistently profitable trading is a pretty difficult and long one. It takes years of hard work, patience, dedication, and experience to reach the top of the trading mountain. Many beginners make similar mistakes before starting their journey. They tend to have false expectations and a distorted vision of the big picture.
As it can be inferred from the graphical illustration, the mountain pattern connects dots and shows a realistic path of a successful trader to the top of the hill.
We all start somewhere, right? We start taking our first steps and making ourselves familiar with the thing we are interested in. In the example of trading, it can be the first YouTube video that we watch, a chapter of a book related to investments that we read, first chart analysis that we make and many more.
What comes next? We decide on the type of a trader that we are. Do you have enough time to sit in front of the charts for several hours and press BUY/SELL buttons, or you are busy 90% of the time and prefer having a portfolio full of long-term positions?
After we have decided what our strategy will look like, we build a trading plan around it and make it a part of our lifestyle. We identify our trade entry criteria, risk management plan and so forth.
Backtesting our trading plan is a vital part for the journey. It can take days, weeks or even months. However, it will be worth it at the end of the day, as it is crucial to link our strategy with the trading plan and find out how profitable it will be.
Executing, optimising, journaling. Where did I make a mistake? What could have been done better? What should I change in my trading plan? It is important to stick to one single trading plan and optimise it along the way.
Before trading with real money, it is recommended to open positions on a demo account with virtual money. Getting a hand of things, practising the market and gaining experience is important.
After having traded on a demo account for several consecutive weeks, months or even years, we can move to a real trading account. Demo account is completely different from a real account, both psychologically and mentally. Putting real money on the line is much harder than playing around with fake simulation money. Thus, it is advised to start with a small amount and get used to it before moving to larger sums of money and increasing the trading capital.
After everything is went through and all hills are climbed, the top of the mountain will be reached. Of course, being a professional trader does not necessarily signify that there will be no failing trades and the win rate will always be above 90%. Losing days, weeks and even months will always happen. However, as long as you diversify your portfolio, stay cold-blooded, disciplined, and follow risk management principles, you will be profitable in the long-run.

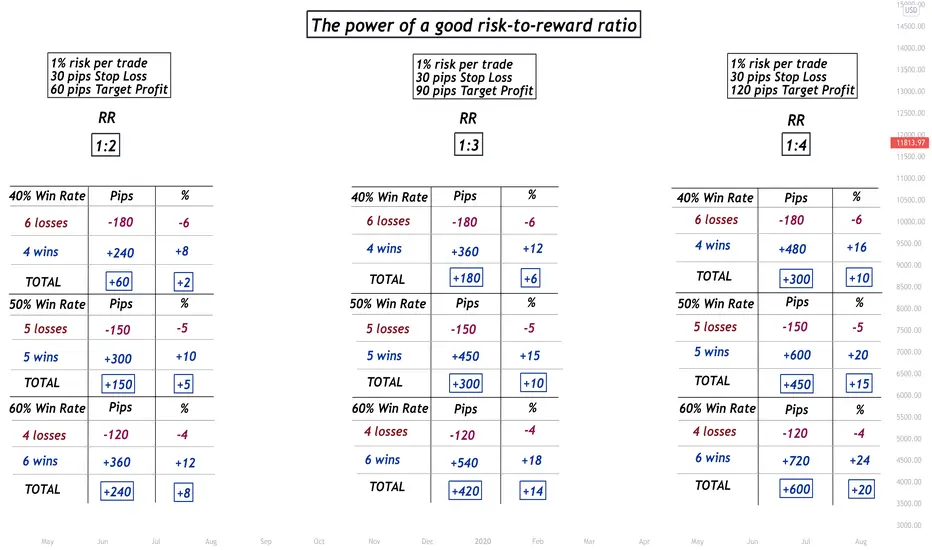
The Power of a good Risk-to-Reward ratio. Reality of tradingRisk Management, alongside with discipline, experience and skillset, is one of the keys to unlock the doors of successful and profitable trading. As it can be inferred from the table, even with as low as 40% win rate, it is more than possible to stay consistent and make nice returns, as long as risk management principles are followed.
*We used 30 pips Stop Loss and 60/90/120 pips Target Profits as a projection. It does not necessarily signify that 1% risk equals 30 pips Stop Loss, as different pairs have different pip values, price differences etc. Moreover, we determine our Stop Loss based on the amount of capital we are willing to risk on a particular trade, price action, intuition and other factors.*
Trading Alphabet: Friday FundayHey, wizards! Happy time of the day.
It's Friday, so we have decided to have a little bit of fun and put out a Trading Alphabet, or in other words, which trading-related tools, securities, phrases do we associate with each and every letter in the Latin alphabet.
Do you agree with the list? What would you add or modify?
Happy upcoming weekend and big love to you all!
Investroy

Journey of a Trader: All of us have gone through this!Good time of the day, dear TradingView family. Happy new month! May March bring you lots of happiness, love, and profits.
Today we are gonna be doing a quick reality check and scrutinizing a long way every trader goes through before becoming successful and consistent.
All beginning traders get super motivated and excited before beginning this long journey. Instagram “gurus” create false expectations and trick people into thinking they will be making quick profits and becoming millionaires with a $100 capital. Beginner’s luck is real and super relevant in this case. Without having a proper trading plan and a backtested strategy, newbies jump into the markets and start trading full-speed. “Wow, I made my first profits! I can keep going like this and make lots of “Benjamins”. Overtrading, greed and self-confidence lead to a losing streak, panic, anger, and loss of faith. Solutions need to be found, and therefore traders start changing strategies and trying to find a way to the doors of success. They lack motivation and hunger to keep going. They start questioning themselves and thinking whether they should quit or keep pushing. At this stage of the journey, around 90% of beginners give up and leave the markets. The remaining 10% still have hope, so they keep grinding and enhancing their trading capabilities. After some time, they start seeing some progress in their abilities. They start having more winning trades now, and they become breakeven traders, meaning they neither make any profits nor encounter any losses. They stick to their strategy and optimize it along the way. They plan, execute and journal all trades. After a few months, they finally reach the doors of success and profitability. Of course, they do not get greedy or self-confident. Though, they still have losing days/weeks/months, their main focus is concentrated on long-term growth and prosperity. They know that if they keep following their trading strategy, obeying risk management principles and being disciplined, they will always be profitable in the long run.
To sum up and to motivate the beginners reading this: if you are going through hard time in the markets, if you do not know what to do or how to make thing work, keep pushing more and more. There is always a golden sky at the end of every storm. Therefore, never feel discouraged, do not give up, and keep grinding. YOU WILL ALL MAKE IT!

Why do most traders fail? Common reasons that lead to failureWe have listed some of the main reasons that incline most traders towards lack of success. After being in this industry for quite a few years, we have noticed that 90% of beginner traders make the same mistakes all over again. We would like to address those issues below, and provide some recommendations:
1) Overtrading is a problem that many beginners and experienced players in the market face. Quality will always be over quantity. Taking a few high-probability trades is much more convenient and professional than buying and selling many positions at the same time.
2) Risk management should be strictly followed in all cases. Many traders tend to risk 5-10% on a single position and end up blowing their accounts. It is much safer and better to risk 1-2% per trade and keep things consistent.
3) Adding 10s of indicators into their charts and making their graphs messy is what many participants of the markets do. Making trading decisions based purely on indicators lead to failure 90% of the time. It is essential to rely on price action and use indicators as confluences.
4) "I will start trading with $100 and flip it into thousands of dollars in a few months, because I have seen a guy on Instagram do the same". That's such an unrealistic and distorted statement. Always set your expectations low if you want to be profitable in this field. Moreover, do not trust fake Instagram "gurus".
5) Never ignore the major fundamental drivers, as in some particular cases they can easily make the market jump around.
6) "Many authors on TradingView are going short on BITCOIN! Let's go and do the same". Never rely on randomness and other people's opinions and analyses. Make your own chart analysis and use other authors' views as a means of confirmation.
7) Always and always journal your trades. It will help you a lot in identifying your errors and fixing them.
8) Patience is always the key. Those who rush, stumble and fall.
9) Do not let a win get to your head and a loss get to your heart. Always remain cold-blooded and emotionless.
10) It is impossible to be profitable and consistent in this sector without having a valid trading strategy. Create a trading plan that works for you the best and stick to it for the long-run.
11) Many novices tend to increase their risk in order to make more profits. Instead of increasing the risk, increase your trading capital!
12) Getting aggressive and trying to open a trade every minute is not a way to go. It is important to remain calm, trade with caution, and be patient!
13) If you want it, you will get it. Most of beginners do not treat trading as a serious business and they spend less time practising it. In order to be successful and make money, you need to put in work!
14) Greed is not an option! Always set realistic target profits and enjoy your gains. Holding a trade forever is not a way to go
15) Giving up is for the weak. If you ever feel like giving up and quitting it all, think about that one reason that made you start

How to build a Trading Strategy?Hey, fam, welcome on another educational post! The topic is the following: step-by-step guide to building a working trading strategy
The process of building a trading strategy that will lead one to the doors of consistent and profitable trading is a pretty difficult one and it takes quite some time and effort.
1) Firstly, it is crucial to identify what kind of trader you are. If you have plenty of time in your hands to to sit in front of the monitor and go through the charts 24/7, then scalping or intraday trading would be suitable for you. If you enjoy clicking “Buy” and “Sell” buttons and opening 10-15 or even more transactions per day, then two of the above listed styles would be suitable for you. On the other hand, if your timetable is packed with different activities all the time and you do not have enough time to sit in front of the charts, swing or position trading would work the best for you. If you are aiming for making big gains instead of small “quick profits”, then both swing trading and position trading can fill your needs.
2) Moving on to the next step, it is crucial to have a watchlist, or in other word, a "favourites" list. It is better to have a batch of 5-10 favourite tradeable securities, than trading random things all the time. Let’s bring a real-life example: Would you prefer having 5 pets and take care of them individually, or 40 pets? What we are trying to emphasise, it is better to make yourself familiar with a pair and be able to read it like a book. Moreover, it is much easier to monitor 10 familiar setups rather than 50 random pairs. Thus, take some time skimming through various setups, and add them into your watchlist upon “falling in love with them”.
3) Always have a clear entry and exit strategy, and always ask yourself the following questions before entering a trade: “Why am I buying/selling this security?”, “Where are my Target Profit and Stop Loss set?”, “What portion of my trading capital am I risking on this trade?”. Every trader has his or her own entry and exit plan. Try to thoroughly examine all possibilities and see what works best for you. For example: enter when a nice wick candle has been formed around the area of demand/supply that aligns with 61.8% Fibonacci retracement level, set a fixed Target Profit of 1:3 Risk-to-reward, set the Stop Loss below the formed Double Bottom .
4) Execute, journal, optimize! If a trade goes wrong, ask yourself a question: “What went wrong and could I have prevented it?”. Make some modifications in your plan if necessary.
5) Never underestimate fundamentals and heavy economic or real-life news. Some examples are NFP, Markit Manifacturing PMI, quarter/annual GDP growth news. Moreover, wars/conflicts between two countries are crucial to be aware of as well. These heavy news have it all to mess the market around. Therefore, always consider these events, make your fundamental analysis and trade accordingly. Move your Stop Loss to the Breakeven point, or even exit a trade earlier in loss if needed, in order to stay safe before the news hit.
6) Last but not least, and most importantly, always stay patient, disciplined, free of emotions, cold-blooded, and remain loyal to your trading plan! “But my plan is not working. I endured 3 losses in a row. Should I immediately change my plan?”. The answer is a big fat “NO”. Instead of changing your strategy that took you so long to put together, think of identifying the week points and optimizing the plan.

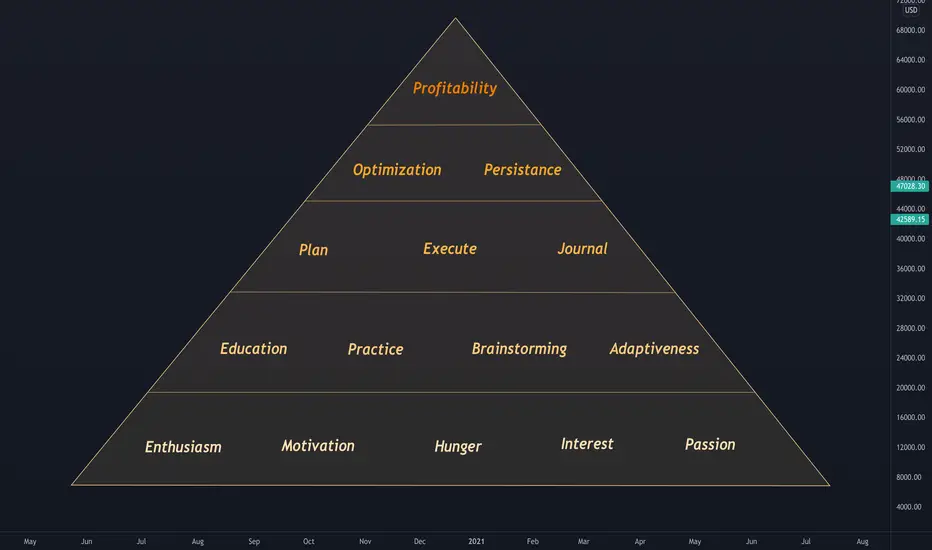
Pyramid of Trading: a step-by-step guide to successHey, fam! Happy Saint Valentine's Day and welcome on another educational post. The topic is the following: a step-by-step guide to success in trading.
We all start somewhere, right? Something grabs our attention and builds instant interest that makes us persuade a specific thing. If you decide to interview a number of traders and ask them reasons why they had decided to become a trader, they will all give you various answers. One will tell you that his motivational driver was a random guy on Instagram that drives a Lamborghini Urus and claims that he is a day-trader. Another one will state that he has always been aiming towards building a great career and becoming financially independent and so forth.
Regardless of the background, all of them had started their trading journeys having the same drive, enthusiasm, passion, hunger, and motivation. One cannot simply succeed in this sector without being ambitious and eager enough.
While the above stated characteristics serve as basis of motivation, the next tier is one of the most important ones, as it sets the ground for all upcoming success and profitability. It is crucial to keep constantly learning, brainstorming, making yourself familiar with new stuff, applying the learned in practice, and adapting to the changes that take place both in your life and in the market.
After the fundament has been set, it is time to move to the main part: Planning, Executing, Journaling. First of all, if we have reached this particular tier, it means that we already have e strategy that we stick to and refrain from changing every week/month. We use this strategy to plan our trades and execute them once all criteria have been met. We journal all of the taken trades, both winners and losers.
Journaling helps us optimize our strategy and make some chages in it if neccessary. As market conditions change quite rapidly, our strategy and business plan should be modified as well in order to account for those changes. In addition, regardless of anything, we remain patient, cold-blooded, and trust the process.
After climbing all those tiers and reaching the very top of it, we can finally say that we are profitable and consistent, and we can enjoy the fruits of our own labour.
Of course, it is never as easy as it may sound, but long-term vision, patience, and ambition can take him or her to the doors of profitability. Thus, we encourage all fellow traders to keep grinding and strive for prosperity!
With love,
Investroy Family
Demystifying a Fakeout ; Fake Breakout ; Wyckoff Theory / EURCADIn this Analysis I break-down what everyone knows and hates most. The Fakeout.
The fakeout is simple. I hope this conveyed in the Chart.
1. We are in a Range
2. We closed outside the Range, we get candle closure confirmation. The 3 C's.
3. Shortly after we print candles back inside the range, closing strongly
4. At this stage you can wait for a retest of the bottom of the range (like me)
or you can just place an entry right then .. because the Fakeout structure has initiated at this point
Thoughts on where we are going form here anyone?
I'm Looking to 148 for swing trading.
We must stay above 146 now since we closed above this zone
on Friday's NFP day.

Traders vs Gamblers: Know the main differences!Hey, fam! Happy Friday and welcome on another educational post. The topic is the following: differences between a trader and a gambler.
We are gonna go through 6 crucial points and elaborate how traders are different from gamblers.
1) As a trader, one’s aim is to focus on the next 100 trades instead of the next 10. Long-term success, profitability, and consistency are two of the main things traders should target. However, a gambler’s wish and desire is to make quick money.
2) A successful trader/investor has a backtested trading plan that he sticks to and optimizes along the way, adapting to changing market conditions. On the other hand, gamblers like to trade based off what other people think and tweet, or by simply opening a random Buy/Sell position and hoping it plays out successfully.
3) Profitable traders always diversify their portfolio and risk no more than 1-2% per trade. On the contrary, gamblers go “full margin mode” on a single trade without setting a Stop Loss and end up blowing their accounts and blaming the markets.
4) Chasing markets and rushing the process is not what real traders do. Instead, they follow their plan and wait for the price to play out and match their entry criteria before executing. Nonetheless, gamblers like to overtrade, open positions based on nothing, make biased decisions.
5) When enduring a loss or two (or three), traders neither get emotional nor try to revenge the markets. They know that if they obey risk management principles and open high risk-to-reward positions, they will cover all their previous losses and get back to making profits. Gamblers, on the other hand, get angry and start attempting to revenge the market by making foolish decisions and entering many illogical trades.
6) Last but not least, if you want to be successful and profitable in this field, you have to treat trading as a business and take things seriously. Those that think markets are a playground or a casino machine will never succeed in this space.

What To Focus On As A BeginnerFocusing on winning trades is your setback as a beginner
Every individual begins their trading journey with the idea that trading is all about winning trades and making money. Soon after their dreams are shattered when they realise it was not as easy as they had thought it would be. Now as we all know, the road to success to many is long and difficult, and that’s exactly what makes them successful. So why should the road to success in trading be any different? Look at top performing athletes, they trained for years before reaching any kind of success that definitely did not occur overnight. This bring me to my main point where many traders could be failing due to focusing on winning trades rather than the process it takes to become a good trader.
Every trader beginning their journey needs to understand that trading the financial markets is no different than a top performing athlete. In order to achieve success, one needs to develop their skills over years. Instead of focusing on winning every single trade, one should be focusing on the process and the experience they are gaining over this time. Studying your mistakes, your losses, your psychological weaknesses, your analysis, and your understanding of the charts, are far more important at this stage than focusing on winning trades. Look at your trading journey like a student attending university, a student will learn over years different topics, where some will seem worthless at the time, but will however develop their skills in the necessary fields to succeed in the future.
Every beginner should deeply focus on the process. Winning trades are a by-product of a developed successful strategy which also requires a developed individual. The trader needs to be developed in their psychology above all in order to trust their strategy and apply it correctly without deviating from the plan. Take the time to focus on all aspects of your trading, and let the winning trades come as a result of that in the future. Trading is a marathon, not a sprint, always remember that.

Success is a one big IcebergJust like real life, trading life is full of ups and downs. You know those days when you wake up with an absolutely awful mood and you can't figure out possible reasons? Well, there could be several factors influencing it: negative energy of the outside world, bad weather, personal problems and so forth. It is very similar to checking the markets and noticing that everything is so choppy that there is nothing to trade. Several determinants here as well, such as heavy economic news, holidays, or just a bay day with no opportunities (after all, not every day is a trading day). One thing that gets us through these challenges faced is patience, because, after all, time heals all pain wounds and fixes most of our problems. I quote Shakespeare: “The evil that men do lives after them; The good is oft interred with their bones". To reverse-engineer and interpret it into the trading language: "People only see the end goal, the glory, the monumental win. They don’t see the dedication, hard work, persistence, discipline, disappointment, sacrifices, and many failures it takes to reach success". In more simple terms, people only see the tip of the Iceberg (success, amazing profits, consistency), and not the bottom of it (sleepless nights, hard work, dedication, failure, pain).
Not a single skill is learnt over the course of a night. Just like it takes several years of practice, hard work and expertise to become a successful lawyer, a famous actor, and an exceptional doctor, it takes years of hard work, passion, and dedication to become a consistently profitable trader/investor.

Just my perspective on NASDAQThis is just my perspective on how NASDAQ will move in the coming days. This is purely based on the area of the confluence trap, Demand, and supply.

DREAMS QUEST Wedge Breakout 1043% potential (Desktop Version)Hello traders,
DISSECTING A FALLING WEDGE TRADE
THE STRUCTURE
Todays technical analysis is on DREAMS QUEST. This coin seems to be consolidating in a falling wedge pattern which I have seen many times play out very well for the Kucoin bangers that get listed. What you want to look for on a falling wedge pattern is 3 touches on both the bottom support trend and 3 touches on the top resistance trend. This will be the formation of the bullish consolidation falling wedge pattern as saw in the chart.
The key indicators of a bullish falling wedge pattern are a wide mouth at the beginning of the pattern and bullish price heading up to the top of the pattern. Then an ABC corrective wave during a bearish down trend that consolidates tightly at the end of the pattern. A lot of times you will be able to use a fib tool from the bottom of the recent to the top of the beginning of the wedge and see that the bottom of the wedge generally bounces off of the 50% Fibonacci level indicating the price action may have exhausted the bearish market participants.
THE STOP LOSS
There is nothing more important in trading than risk management and protecting your capital. No matter how good of a pattern you see or how promising a trade set up is, the market could always have some bearish news that completely destroys your position. Thus, if you’re going to trade, USE A STOP LOSS!! Ok, for this particular pattern, placing your stop loss is pretty simple, I have a general rule of thumb to place my stop loss 3% below the last swing low of the falling wedge prior to the breakout. Which this will be placed after your entry which we will go over next but, I have listed it in this tutorial first as it is more important than your entry! Your initial stop loss is at .06295¢
THE ENTRY
Your entry will be upon the breakout of the top of the wedge located in area #1 or upon retest of the breakout areas in box #2 shown on the chart. Upon breakout of the top of the falling wedge pattern, in the box labeled #1 this being your initial breakout area, you’re going to want to see a CLEAR bullish candle on the daily come above the trend line and be in the #1 buy box before entry to confirm that breakout.
KEY NOTE and always a rule of thumb here is patience, your entry will come. Make sure you have a clear closed candle outside of the pattern before you think about opening a trade as there are very often false breakouts and it’s better to have a slightly less favorable entry than to have an entry that will end up getting you stopped out before the trade even starts.
Last but not least, another KEY NOTE to look for when placing your entry is to make sure you watch for a spike or increase in volume upon breakout. This is a solid indication that the selling pressure has been exhausted and the market participants are turning bullish, adding more quality to your trade. ALWAYS LOOK FOR THIS INDICATOR FOR OPTIMAL TRADE RESULTS. The entry for this trade should be between .08718¢ and .09880¢
THE ALLOCATION
I generally enter with 25%-50% of my allocation I have set aside for this trade at this point. When you’re actively trading it is important to keep your allocation low as when you have a large amount of your capital in a specific trade the hardest parts about trading start affecting you and coming into play. That is the psychology of the trade. The more money you have in any given trade will draw bigger fear and bigger ego if you have a loss or a win. Both are equally bad in trading and will cause you to lose money. So when I say I allocate 25%-50% of the funds I have for this specific trade you have to keep in mind that you should not be using more than 3% of your total account in any particular trade this, my 25%-50% is actually .75%-1.5% of my total account. This makes it easier to just let the trade ride and to follow my plan regardless if I am correct or wrong about my trade, it’s is a calculated loss with a small amount of capital allowing me to have a higher chance of having a smaller drawdown on my overall capital if the market gets bearish on me while I’m in a few longs. So, getting to the other half of my allocation. Generally a consolidation like this will have a very bullish breakout that will pop a hot few candles out of the pattern and generally head to the .618-.5 fib measured from the top to the bottom of the full falling wedge pattern. At this point I take a small amount of profit. About 50% of my current position. This will leave me with .375%- .75% of my capital still in the trade and a small amount of profit that I made from the initial breakout on the side. Now here comes the most important attribute you need to be a good trader, PATIENCE !!! After my small win, I am looking to enter back into this trade at the official retest of the breakout of the pattern. This generally comes shortly after the first target is hit. Again, patience is imperative to your success as a trader. Wait it out until you have a clear candle back at the entry point before you add your second half of your position.
PATIENCE IS KEY BUT, ALARMS HELP!
Have I mentioned that patience is an important attribute you must have to be a successful trader? Not enough? Ok, we’ll it is! I do know that all of our time is very precious and dear so, I have a small remedy to help with allocations your time so you’re not just starting at your charts… USE ALARMS!! TradingView had everything that you need to be successful, it is your responsibility to learn it so you can earn it! I generally first set an alarm at the entry point of my trade set up that I have identified as well as where I’d expect the stop loss to be. #1, so I can be reminded that the trade has either entered my first entry zone, or to let me know that the trade I have identified may not be what I thought it was and to re assess the situation or find a new trade. Again, patience! So, after my entry alarm goes off and I start my initial position, I then set my stop loss and assure my alarm is set a few pips above my stop loss so I can be alerted before it hits as well as well as an alarm at my first target and one more at my entry point. This way I can be alerted that my first take profit was hit and if the price action comes back down to retest I have an alarm there as well to place my second position along with my profit from the first target TP allocated to the whole trade. At this time I double check that my stop loss is a market stop for my total position and that I have an alarm set up for it that sends a text to my phone just in case!
After this I gage my take profit targets and place alarms on all of them as well.
SETTING YOUR TAKE PROFIT TARGETS
This is what we are here for, the profit right? So it’s important that you have take profit targets (TP TARGETS) on your chart as you need to plan the points you’d like to exit your trade. The first target I find is the total and final take profit of the pattern, which can be determined by measuring the distance between point A and point B which can be found at the beginning of the mouth of the falling wedge as shown in the diagram above on the top of the chart. Once you have the distance measured between points A and B you can then ad this measurement on top of the first area of the breakout candle on the bottom of the falling wedge pattern as soon as the price action shows you where it is breaking out. KEY NOTE is to always make sure you’re being conservative and by this I mean, when placing the distance from A to B on C to D, it is important that you don’t try and get it perfectly to the full measure meant on C To D. What I do is shave off a few % from the total measurement so I can allow for margin of error with my target. Minimum of 3%. Now that I have my final target set up at .99704¢ I then take a Fibonacci tool and run it from the top of the pattern to the bottom of the pattern and place TP targets at both the .5 Fib and the .618 Fib lines. I find that this is the easiest way to get quick targets on a falling wedge pattern that the price action generally will react to while heading to the final target. The .5 Fib is at .34509¢ TP target #2 and the .618 Fib TP target #1 is at .23311¢.
Congrats, you’re almost done with your trading plan! Now to the best part!
GETTING PAID!!
Everyone’s favorite part about trading! Ok, now that you have entered the quality trade, have your risk management set up and are ready to get into some profits here we can set a plan for taking some of those beautiful profits. Now being that we have 3 target areas here I generally have 3 separate take profit %’s that I set up along the way by lieu of limit sell orders for the first two TP targets. My take profit target allocation strategy is generally the 33.3% take profit strategy at every target. So for the first two targets, I will set limit sell orders for 33.3% and a 33.4% of my allocation adding up to 66.7% after the first two targets are hit. This way I am already in profit just in case something goes wrong along the way. KEY NOTE it is always smart to take profit, as if you don’t you’re just an investor without a plan and you’re never profitable until you take profit, so congrats, at this point you’re a profitable trader! Yaaayy!! Ok, so for the final take profit I set a market order as a lot of times when the final take profit comes about the price action can quickly get up to this area and we don’t want to be stuck looking for someone to take the coins off of our hands, we want to get them sold and go celebrate our win by looking for our next trade so we can compound these gains amirite??
So awesome, we have a W on the board so we’re done right? No, there’s another tip you should know in trading to assure profits and apply better risk management strategies. What is this you ask?
KEEPING AS MUCH PROFIT AS YOU CAN
How do we do this? Simple, after your first two take profits hit, which you will be reminded on your cell phone via text message because you, ya sly devil, you set up alarms on your TP targets and now are going to head over to your exchange and move your stop loss up aren’t ya? Of course you are! Where are you moving it to? Why not make that right at your entry point so not only are we assuring we don’t lose any money on this trade at all, but, we are in fact in profit from 3 separate TP targets that we cashed in on!! NOOOOYCE!! So now that we are deciding on what color Lambo we want, we can assure we still have some bank roll by tossing that stop loss up from .06295¢ to the entry of the trade between .08718¢ and .09880¢
Ok, you have it all set up, I wish you the best and make sure you’re doing your own research as I am not a financial advisor nor is this financial advice. Before we end, here is some key note reviews and the signal targets for the original trade below.
KEY NOTE AND TAKEAWAYS
#1: Patience is key to any successful trader success.
#2: Allocation should always be a fraction of your total account
#3: Be sure to identify the structure based on the rules above.
#4: Wait for a CLEAR breakout by looking for a daily candle close above the resistance trend line on the top of the falling wedge
#5:The retest happens after the breakout
#6: Not the 6th most important but, ALWAYS USE A STOP LOSS!!
#7: ALARMS make life easy!
#8: You have to take profit to be profitable! SO TAKE SOME OFTEN!
Entry: .08718¢ and .09880¢
Stop loss: .06295¢
TP1: .23311¢
TP2: .34509¢
Final TP3: .99704¢
P.S. it’s always important to know the fundamentals on a coin, so with that said, below are some stats, coin info and a link to the coins website so you can further research it during your DD.
FUNDAMENTALS
Dreams Quest Coin Price & Market Data
Dreams Quest price today is $0.090157396598 with a 24-hour trading volume of $8,589,048. DREAMS price is up 31.4% in the last 24 hours. It has a circulating supply of 0 DREAMS coins and a total supply of 186 Million. If you are looking to buy or sell Dreams Quest, KuCoin is currently the most active exchange.
Dreams Quest is building the first-ever metaverse-based economy, a self-sustaining Dreams Verse where people will be able to participate in the decentralized play-to-earn RPG game using dynamic NFTs. Unknown factors will affect character attributes in-game, and post-game outcomes will dynamically change the NFT card attributes and write them on the blockchain (the ethereal scribes) to show game history for each card.
Website: dreams.quest

Power of multiple confluences in tradingThe rule is pretty simple: if you have many technical confluences backing your setup, the probability of your trade succeeding is really high. On the illustrated BTC chart, a number of confluences is listed. To be precise, there are 4 confluences examined, and they will be all scrutinized below:
1) The current direction of the market is bearish, meaning we are in a downtrend. As a rule of thumb, in a bearish market we look for SELL positions rather than going long (fading the short-term trade against the long-term trend).
2) A nice descending triangle pattern has been formed, indicating that a bearish breakout is highly possible, and that the price may keep dropping deeper down.
3) 60 EMA perfectly lines up with the upper boundary of the descending triangle, which is a crucial zone of resistance that the price can’t seem to penetrate.
4) A nice bearish engulfing candlestick pattern was formed before the massive drop happened, which serves as another indicator of bearish pressure.
After having all confluences ready in hand, it is time to execute. The Stop Loss is place a few pips above the zone of resistance, and the Target Profit is set at 3% gains, as the risk-to-reward based method is utilised.
NOTE: Even though having multiple confluences backs up your technical setup, gives you confidence, and provides your graphical setup with a higher chance of succeeding, risk-to-reward principles should be strictly followed in all cases! We cannot control the market, but we can control our capital, risk, and emotions.
Have a great upcoming weekend, everyone!

Basics of Trading PsychologyPsychology is perhaps the single most important aspect of trading. Without the proper psychology, you are almost guaranteed to fail.
First things first, you have to understand that trading is just as much of a profession as any other, and just like top performing athletes, trading reflects your performance, you are responsible for your results.
In life your beliefs shape your reality, and you have to believe without a doubt that you could become a trader. Only once you completely trust yourself, you will be able to go ahead and become a trader. Every aspect of trading is psychological including everything we have spoken about pretty much. And since you trade your beliefs, that makes the biggest impact on the results you will receive. People make decisions based on fear or greed, it is that simple. And since the market is designed to take advantage of individuals psychological weakness, if you do not have control over yours then you will be a part of the 90% who lost that day.
Since all trading is psychological, it is most important to always be working on yourself as a person, because that will greatly impact your mindset and attitude while trading. You cannot finish fighting with a friend, partner, or spouse, and sit on your computer expecting to make great analytical decisions while there is anger and indecisions going on in your head. Trading has to be treated just as much of a business as any other.
A lot of people think that trading mistakes and trading losses are the same thing. However, a trading loss is simply a trade that hit your stop loss and did not go your way. Until the day you learn to accept that losses are just as much a part of trading as winners, you will not become successful. A trading mistake on the other hand is you simply not following your own rules. You have to understand the importance of being disciplined and how it is possibly the single most important aspect of lasting in the markets. Never break your own rules just to be right, because as said earlier, you need to learn that losses are completely normal and expected.
By following your rules, you will focus less on being right and have less emotional attachment to trades. If emotions are attached to every single trade then what can happen is that you could have a great week and make a certain amount of money that week. Now by attaching an emotion to that trade, you are programming your mind to believe that the following week even if half that amount was made, it is not good enough as you do not have the same intensity of positive emotions. In trading you have to be emotionless towards both wins and losses and strictly follow your rules.
According to Dr Van K. Tharp, there are 12 tasks of trading which include:
1. Self-analysis to determine if you are in a state of mind to trade
2. Mental rehearsal to avoid mistakes
3. Daily focus to lead you towards your goal
4. Developing your own style of a low risk idea
5. Stalking the charts starting from high to low time frames
6. Action requiring commitment and not thought
7. Monitoring the trade to keep the risk low
8. Aborting if the trade is not going well
9. Taking profits when the reason for the trade has ended
10. A daily review to monitor and prevent future mistakes
11. Being grateful for what went well
12. A periodic review to make sure everything is still working well
One of the biggest parts of a good trading psychology is believing in yourself. This can sound very straight forward until you deposit real money and place a trade. You will see parts of yourself being tested that you didn't know existed. You might find yourself checking the trade every few minutes or even seconds, you might look at your drawdown and doubt everything that you have done, you might lose a trade and think that you will never analyse another right. Let me give you some common examples, you analyse a trade and all the confluence is there, you then monitor your trade and after several hours you find yourself in drawdown leading you to close the trade, hours later you see that the price went to exactly where you had your take profit. Another might be after losing a trade you see a great opportunity, but your previous loss makes you doubt everything about the trade, only to see it reaching where you had in mind also. Of all the things learnt, if your psychology is not your main focus of work, you will not be able to succeed as a trader, not because you do not have the right knowledge and analysis to trade, but because you are your own enemy.
Over trading is another reason why many people do not last long in the markets. Over trading is extremely negative as placing too many trades and adding on to your losses, you are not managing your risk correctly and only exposing your account and capital to more risk. The psychology going from demo to a real account is great also and individuals need to be careful as emotions will come into play.
If there is one thing that cannot be stressed enough, it is that the aim of trading is to gain pips and not money. Chasing money, especially fast money, is gambling and you will never have control as long as you remain with that attitude.
