Unraveling Efficient Market HypothesisMany believe that a well-defined, simple, and robust trading strategy can help a trader acquire gains that outperform the market or purchase undervalued stocks in hopes of outsized returns upon rebound, but is this the case? Students of the Efficient Market Hypothesis (EMH) would argue that fundamental and technical analysis are pointless approaches to the market that are merely a mirage of a self-fulfilling prophecy.
EMH is a cornerstone of modern financial theory, which posits that markets are perfectly efficient and always reflect all available information. The influence of EMH is pervasive, guiding investment strategy and shaping financial regulation. There is growing skepticism among academics and traders about the accuracy and efficacy of EMH in modern markets. EMH is a dense topic, but we will do our best to dive into what EMH is, its strengths, and its limitations in modern times.
Understanding EMH
To understand what EMH is, we need to understand the forms of EMH, of which there are three levels of efficiency: weak, semi-strong, and strong. The weak form of EMH suggests that current prices reflect all past trading information, including past prices. Thus rendering fundamental analysis and technical analysis moot and impossible to beat the market. Semi-strong EMH argues that the current price accounts for all public data and does not include private data. Again, fundamental and technical analysis will not be fruitful in helping traders outpace market returns. The strong form of EMH posits that prices reflect all available information, including insider information.
In Support Of and Against EMH
Supporters of EMH argue that markets are efficient because of the excess number of rational investors, and the competition among them (bulls vs. bears) ensures that prices are always accurate. The more market participants there are, the more efficient a market becomes as it becomes increasingly competitive and more price information becomes available. The competitive nature and increased liquidity of the market shows that it is difficult, at best, to consistently outperform the markets.
Opponents of EMH argue that human biases and irrational behavior can lead to market inefficiencies. Investors often make irrational decisions based on emotions and cognitive biases. This is tough to argue, given the countless articles and books on market psychology. Market anomalies, such as the value and momentum effects, also suggest that markets are not perfectly efficient. Historical market events, such as the 2008 financial crisis or other perceived “bubbles,” further question the assumptions of EMH.
Practical Implications and Real-World Observations
Despite EMH, some investors have consistently outperformed the market; famously among them is Warren Buffet. Some hedge funds have also been successful in beating market benchmarks. One could argue that though a market is efficient, there are individuals who are statistical anomalies that have outperformed the market under EMH theory.
Market inefficiencies and opportunities exist in specific asset classes or regions, such as emerging markets or distressed debt-stricken economies, but an easily observable form of market inefficiency is arbitrage trading. Wherein traders buy and sell to exploit minute price discrepancies of assets between exchanges.
Alternative Approaches
It is hard to objectively believe that one can not formulate a system that helps a trader make returns that outpace the market. Fundamental analysis and technical analysis are two approaches to investing that challenge the assumptions of EMH. Fundamental analysis involves examining company-specific information and valuations to find undervalued stocks which is entirely conflicting with EMH theory. While technical analysis involves using price patterns and indicators for market timing in hopes of profits in your chosen trade direction.
The Future of Market Efficiency
The rise of technology, such as high-frequency trading, trading algorithms, and artificial intelligence, is changing the landscape of financial markets. Some argue that technology is making markets more efficient; others would suggest that it is introducing new sources of market inefficiencies. Will the definitive parameters of what EMH need to be adjusted as the markets evolve? Only time and people with significantly larger brains than I will tell.
Conclusion
EMH remains a principal concept in modern finance, but not without limitations and challenges. It is paramount for traders to understand what EMH is, even if they rely on different analysis theories to make their own trading decisions. Investors should adopt a flexible and adaptive approach to investing, recognizing that markets are not always perfectly efficient and that opportunities for outperformance exist. Ultimately, we believe the key to successful investing is a combination of sound strategy, disciplined execution, and a willingness to learn and adapt.
If you like this post, don't forget to drop a boost and follow our page for more educational content!
Educationalposts

Bull Market Booming: Top Tips to Maximize Your Investment Gains!It appears that a bull market has taken hold in the US market, as evidenced by the remarkable rise of the S&P 500 index, surging over 20% from its October lows. Adding to this favorable outlook, the Federal Reserve has finally implemented a much-anticipated pause in the cycle of interest rate hikes.
With the shift in market sentiment from bearish to bullish, investors are eagerly looking for avenues to leverage this upward trend and make the most of the prevailing conditions.
Today, we will delve into the various factors that indicate the arrival of a bull market, along with strategies and invaluable tips to help you seize the opportunities presented by this favorable market scenario.
What Lies Behind All This Optimism?
The current wave of optimism in the market and the emergence of a new bull market can be attributed to several significant factors that are often overlooked or avoided in discussions. One key reason behind this optimism is the remarkable earnings results reported by companies.
Investors are celebrating the fact that companies are no longer delivering mediocre performance. Instead, they are exceeding expectations and showcasing strong growth. This shift in mindset from accepting average results to embracing a "glass-half-full" outlook is driven by the realization that companies are meeting and even surpassing the high growth expectations set for them.
This surge in optimism is fueled by the confidence that companies have proven their ability to generate substantial earnings and capitalize on market opportunities. Investors are therefore responding by driving up the market and contributing to the overall bullish sentiment.
It is important to acknowledge and consider this fundamental aspect when discussing the reasons behind the current optimism and the substantial year-to-date increases observed in the market. The impressive performance of companies and their ability to meet or exceed growth expectations have played a vital role in shaping the current bullish market sentiment.
S&P 500 daily chart
The positive forward guidance provided by CEOs further reinforces the current optimism in the market, as it signals their increased confidence in navigating challenges, particularly those posed by inflation. A notable example of this trend can be seen in Nvidia's Q1 earnings report, which highlighted the company's upwardly revised guidance. This adjustment reflects the strong demand for AI technologies that power applications at major industry players such as Google, Microsoft, and OpenAI, the creator of ChatGPT.
Nvidia's projected revenue of $11 billion for Q2 significantly surpassed the estimates put forth by Wall Street analysts. This impressive figure serves as tangible evidence that the AI craze is more than just hype. The surge in demand for graphics processing units (GPUs) from both established tech giants and startups as they develop their AI platforms has been a key driver behind Nvidia's remarkable performance. As a result, the company's shares experienced a staggering 26% surge, propelling Nvidia's market value to an extraordinary $1 trillion.
This achievement places Nvidia among the elite group of publicly traded US companies that have reached this milestone, joining the ranks of industry giants such as Apple, Microsoft, Google parent Alphabet, and Amazon. The significance of Nvidia's market value milestone further solidifies the notion that the demand for AI technologies is substantial and here to stay, providing a strong foundation for the ongoing bull market in the US market.
Tesla stock daily chart
Tesla has also emerged as a significant player worth noting in the current market landscape. The company has experienced a remarkable turnaround, with its stock value surging by an impressive 70% over a six-month period, including a notable 53% increase in the past month alone. This is a noteworthy development, considering that Tesla had suffered a substantial loss of around two-thirds of its value in 2022.
The strategic and timely price cuts implemented by Tesla, although initially perplexing to some, are now proving to provide the company with a potential market share advantage. These price adjustments have contributed to the renewed interest and confidence in Tesla, ultimately fueling its recent resurgence.
As the Q1 reporting cycle has concluded, the results reveal a strong performance for tech stocks in the latter half of the year. This surge can be attributed to the prevailing optimism surrounding the Federal Reserve's approach to nearing the end of its rate hike cycle. The anticipation of higher interest rates, coupled with concerns of slower economic growth and softer labor market conditions, has contributed to a decline in inflation. Surprisingly, the adverse effects that were initially expected to impact households and businesses have been less severe than initially predicted.
Furthermore, with the concerns surrounding the US debt ceiling alleviated and the mitigation of inflation risks, the overall market sentiment has undergone a transformation from bearish to bullish. This shift in sentiment is likely to continue, with stocks, particularly mega-cap tech companies like Tesla, expected to maintain strong returns throughout the remainder of the year.
Overall, Tesla's impressive turnaround and the positive performance of tech stocks exemplify the overall market's optimistic outlook, driven by a combination of factors such as Federal Reserve actions, inflation dynamics, and improved market conditions.
Top Bull Market Stocks to Consider Buying Now: Tesla (TSLA)
This is not financial advice.
Indeed, Tesla's influence extends beyond its position as a dominant player in the electric vehicle (EV) market. The company's offerings go beyond vehicles and encompass solar and energy storage solutions. Tesla's plans to establish a factory in Shanghai for manufacturing Megapack batteries further solidify its position as a leader in the renewable energy sector. These batteries play a crucial role in storing renewable energy, alleviating strain on the grid during peak hours, and promoting a more sustainable energy ecosystem.
While Tesla's growth will be primarily driven by its vehicle production, the company's positive outlook is reinforced by upcoming price cuts and the launch of new products such as the highly anticipated Cybertruck and Semi. These product expansions contribute to the company's overall growth potential and indicate its commitment to innovation and diversification within the EV market.
Despite some mixed recent financial results, investing in Tesla during the current bullish market phase is seen by many as a reasonable bet on the company's potential to become the world's largest automaker. Tesla's strong market presence, technological advancements, and commitment to sustainability have garnered significant investor confidence and positioned the company for continued success in the evolving automotive and renewable energy sectors.
Alphabet (GOOGL)
Alphabet stock daily chart
Google, with a staggering market capitalization of $1.6 trillion, stands as one of the most prominent names in the business world. It secures its place among the top five most valuable companies globally and boasts a widely recognized and esteemed brand.
Google remains at the forefront of groundbreaking advancements in various technological spheres, including mobile technology, cloud services, data analytics, artificial intelligence (AI), and virtual reality. These innovative developments continue to drive the company's success and shape its competitive edge. Notably, a significant portion of Google's revenue stems from its dominance in internet advertising, a lucrative sector that contributes substantially to its financial performance.
The active integration of AI within Google's operations serves as a strong catalyst for the growth of its shares. As AI technology becomes increasingly prevalent, it expands the addressable market for Google, creating new avenues for growth and revenue generation. The global corporate AI market, in which Google actively participates, is projected to experience a remarkable annual growth rate of 34.1% until 2030. This highlights the immense potential and opportunities that lie ahead for Google as it leverages AI capabilities to propel its business forward.
With its continuous pursuit of technological innovation and a diversified revenue stream, Google remains a formidable force in the industry, poised for sustained growth and influence in the years to come.
Intel (INTC)
Intel stock Monthly chart
The increasing adoption of artificial intelligence (AI) technology has created a surge in demand for chips, leading to notable market movements for prominent AI chip manufacturers. Both Advanced Micro Devices (AMD) and NVIDIA have experienced significant share price increases since the start of 2023, capitalizing on the growing enthusiasm surrounding AI advancements.
In light of this trend, chipmaker Intel is also seeking to position itself as a key player in the AI chip market. Intel has been engaged in negotiations for a strategic initial public offering (IPO) investment with Arm, a renowned British chipmaker. This move follows NVIDIA's previous unsuccessful attempt to acquire Arm.
By exploring this potential partnership, Intel aims to solidify its position in the AI chip sector and leverage Arm's expertise and technology to enhance its own capabilities. The negotiations highlight the fierce competition among chipmakers to secure a prominent position in the rapidly expanding AI market.
As the race for AI chip dominance intensifies, these developments demonstrate the strategic moves undertaken by major players in the industry to stay ahead in the evolving landscape of AI technology. The outcome of these negotiations will undoubtedly have implications for the future trajectory of the AI chip market and the competitive dynamics among key players such as AMD, NVIDIA, and Intel.
Strategies For Investing In A Bull Market
If we are indeed in the early stages of a new bull market, it's crucial to have strategies in place to make the most of rising stock prices. Here are four strategies to consider:
1 ) Diversification and Asset Allocation: Review your asset allocation to ensure you have sufficient exposure to stocks to benefit from the bull market. Consider rebalancing your portfolio by reducing your allocation to bonds and cash while increasing your allocation to equities. However, exercise caution and remain aware that market conditions can change rapidly. Don't assume that stocks will only go up from here. Maintain a well-balanced portfolio that includes a mix of stocks, bonds, and cash. If you're uncertain about the ideal mix, the Rule of 110 suggests subtracting your age from 110 to determine the percentage of your portfolio to allocate to stocks.
2 ) Focus on Growth Stocks and Sectors: In a bull market, growth stocks and sectors tend to perform well. Look for innovative companies that leverage technology to create efficiencies or address global challenges. Industries experiencing rapid growth in 2023 include CBD product manufacturing, 3D printing, solar power, and artificial intelligence. Remember that growth stocks offer higher return potential but also come with increased risk compared to more established companies.
3 ) Consider Value Investing: Value stocks are equities that appear undervalued relative to their intrinsic value. They may be trading at lower prices due to investor overreactions or a market environment that favors faster-growing assets. In a strong bull market, value stocks may lag as investors favor growth assets. However, for patient, long-term investors, this presents a buying opportunity. Value stocks often shine during bear markets and may offer dividend payments. Utilize the bull market to increase your holdings of value stocks, which can act as a buffer during the next bear market while providing dividend income.
4 ) Dollar-Cost Averaging: Implement a strategy known as dollar-cost averaging (DCA), where you invest a fixed amount on a regular schedule, regardless of market fluctuations. For example, invest $400 on the same day each month instead of trying to strategically time the market. DCA helps manage the volatility often seen in the early stages of a bull market. By investing consistently, you buy more shares when prices are low and fewer shares when prices are high. This approach lowers your average cost basis over time and minimizes the impact of short-term market fluctuations.
Remember that these strategies should be tailored to your individual financial goals, risk tolerance, and time horizon. It's advisable to consult with a financial advisor who can provide personalized guidance before making any significant investment decisions.
Risks To Be Aware Of In A Bull Market
While bull markets can present favorable opportunities, it's crucial to be aware of potential risks and pitfalls. Here are three significant risks to consider:
1 ) Overconfidence and Speculation: During a bull market, there is a tendency for investors to become overconfident and take on higher levels of risk. This can lead to speculative investing, where investors chase after high-risk, high-reward opportunities. However, when the bull market eventually ends, these speculative investments may experience substantial losses. It's important to maintain a balanced approach to investing and avoid excessive risk-taking, as downturns can permanently impact the outlook for smaller, less established companies.
2 ) Market Bubble: Bull markets can sometimes give rise to market bubbles, where stock prices become significantly detached from their underlying value. This occurs when investors, driven by excessive optimism, push prices to unsustainable levels. While market bubbles can provide opportunities for gains in the short term, they also carry the risk of a sudden correction or crash. Once the bubble bursts, panic can set in, causing a rapid decline in stock prices and the onset of a new bear market. It's essential to remain cautious and be aware of signs of excessive market exuberance.
3 ) Impact of Interest Rates and Inflation: The interplay between interest rates, inflation, and economic conditions can influence the trajectory of a bull market. Changes in interest rates by central banks, such as the Federal Reserve, can impact borrowing costs and corporate profitability. Additionally, shifts in inflation levels can affect consumer spending power and overall economic growth. Uncertainties regarding future interest rate hikes or spikes in inflation can introduce volatility and potentially dampen or reverse a bull market. It's important to monitor economic indicators and the actions of central banks to gauge their potential impact on market conditions.
It's worth noting that predicting the specific outcomes of these factors in the coming months or years is challenging. The key is to remain vigilant, maintain a diversified portfolio, and consider the long-term perspective when making investment decisions. Consulting with a financial advisor can provide valuable guidance in navigating the risks associated with a bull market.
Tips For Benefitiing From A Bull Market
To successfully navigate a bull market and maximize your investment potential, it's important to consider the following strategies:
1 ) Stay Disciplined: Maintaining discipline is crucial in avoiding excessive risk-taking and speculative behavior. Define your investing parameters and process, and stick to them. Establish clear criteria for the types of investments you're willing to make and the level of risk you're comfortable with. Evaluate any exceptions carefully and have a clear exit plan for more speculative assets. By staying disciplined, you can mitigate the risks associated with overaggressive investing and ensure a more measured approach to capitalizing on the bull market.
2 ) Think Long-Term: Adopting a long-term perspective is key to protecting your investments from short-term market fluctuations and potential downturns. While it can be tempting to make impulsive decisions based on short-term market movements, it's important to focus on your long-term financial goals. Allocate a portion of your portfolio to cash reserves to cover emergencies or major purchases, so you don't need to tap into your investment accounts during market volatility. This long-term outlook allows you to weather market cycles and take advantage of opportunities that may arise, while also providing stability and peace of mind.
3 ) Rebalance Regularly: Bull markets can lead to overexposure to stocks as their value appreciates. Regularly rebalancing your portfolio helps maintain your desired asset allocation. For example, if your target allocation is 70% equities and 30% bonds and cash, and stocks have outperformed, your allocation may shift to 75% stocks and 25% bonds and cash. By periodically selling stocks and purchasing bonds, you can restore your desired asset allocation and lock in some profits from the bull market. Rebalancing also helps manage risk by ensuring that your portfolio remains aligned with your risk tolerance and investment objectives.
4 ) Seek Professional Advice: Each individual's financial situation is unique, and it's important to consider your circumstances when implementing investment strategies. Regularly review your investment plan and consult with a financial professional to ensure it remains aligned with your goals and risk tolerance. A financial advisor can provide personalized guidance based on your specific situation, help you navigate market trends, and offer insights on potential investment opportunities. They can also assist in assessing the performance of your portfolio and making adjustments as needed.
By following these strategies, you can position yourself to make informed investment decisions, manage risk, and capitalize on the opportunities presented by a bull market. However, it's important to remember that investing involves inherent risks, and past performance is not indicative of future results. Stay informed, monitor market conditions, and be prepared to adjust your strategies as needed.
Conclusion:
As the bull market gains momentum, it is essential for investors to be well-prepared and make informed decisions. Employing various strategies such as diversification and asset allocation, emphasizing growth stocks and sectors, considering value investing, and implementing dollar-cost averaging can significantly enhance one's ability to navigate the market effectively. Nevertheless, it is crucial to remain cautious of potential risks, including overconfidence, market bubbles, and the influence of interest rates and inflation. To maximize gains during the bull market while minimizing potential risks, it is vital to maintain discipline, adopt a long-term perspective, regularly rebalance portfolios, and seek professional advice. It is important to note that individual circumstances vary, thus investment strategies should be tailored to align with personal financial goals and risk tolerance.

NZDJPY - DAILY TIME FRAMEThe Structure looks good to us, waiting for this instrument to correct and then give us these opportunities as shown on this instrument (Price Chart).
Note: Its my view only and its for educational purpose only. Only who has got knowledge about this strategy, will understand what to be done on this setup. its purely based on my technical analysis only (strategies). we don't focus on the short term moves, we look for only for Bullish or Bearish Impulsive moves on the setups after a good price action is formed as per the strategy. we never get into corrective moves. because it will test our patience and also it will be a bullish or a bearish trap. and try trade the big moves.
we do not get into bullish or bearish traps. We anticipate and get into only big bullish or bearish moves (Impulsive Moves). Just ride the Bullish or Bearish Impulsive Move. Learn & Know the Complete Market Cycle.
Buy Low and Sell High Concept. Buy at Cheaper Price and Sell at Expensive Price.
Keep it simple, keep it Unique.
please keep your comments useful & respectful.
Thanks for your support....
Tradelikemee Academy

EDUCATION: DCA with Trader!What is DCA? How to use the price averaging strategy to increase profits
DCA or price averaging strategy can be an effective way to manage risk when investing in assets like stocks, cryptocurrencies… I will walk you through how it works and its pros and cons. for easy understanding.
When considering investment, if you have a large amount of money in hand ready to invest. DCA is a method that can be suitable for both experienced and new investors to reduce the risk of seeing how their investments decline in value.
What is DCA?
- DCA (price averaging strategy) is a method of breaking down capital to invest in a fixed and more frequent way over a long period of time.
- This is a smart investment strategy. However, you must not confuse it with the fact that you bottom out the price of an asset when it drops deep to buy at a good price.
- DCA is really good if you correctly predict the trend by analyzing the market. And of course, the price averaging strategy must involve technical analysis or specifically instrument indicators such as MA, MACD, Bollinger bands, Elliott waves, etc.
Bitcoin problem using DCA
Now do a math on Bitcoin investment for you to visualize.
Problem 1: Buy Bitcoin once with all assets
This is the case I think is mostly true for newcomers to the market. For example, you have 10000$ and buy it all with bitcoins for 8000$. You get 1.25 BTC.
Then Bitcoin achieves the gain/loss that you want to sell, then we will have a profit/loss table with the selling prices as follows:
- SELL at 6000$ = Take Profit -2000$
- SELL at 12000$ = Take Profit 2000$
- SELL at 14000$ = Take Profit 4000$
This is a basic math problem. The next step is to use the average price of your capital. Try it out and see how it turns out. Here, I will divide according to market developments so that you can consider it in the most comprehensive way.
Problem 2: DCA in a bear market
This is a problem that makes the DCA method really shine. Now, let's say the plan with the capital of 10000$ above will buy in batches. Divide the capital into 4 times, so use $ 2500 for each installment.
Proceed to buy bitcoin at 8000, 6000, 5000, 3000. So after 4 such purchases the number of Bitcoins you hold is 2.0625 BTC. After that BTC returns to the upside, you will calculate profit and loss at the prices if you sell as shown in the table below:
- SELL at 4000$ = Take Profit -1750$
- SELL at 10000$ = Take Profit 10625$
- SELL at 12000$ = Take Profit 14750$
Do you see that if the expectations are right, the profit will be huge. When bitcoin fell, you increased your holdings more than you could buy once. Investment capital increased as BTC price increased with a total profit of ~1.5 times when selling at $12000.
Problem 3: DCA in a sideways market
When the market moves sideways for a year, for example, the price moves in a narrow range. You can buy bitcoin in 4 batches at the prices 8000, 7500, 7000, 6000. With these buying prices you will buy 0.877976 BTC.
You can see it's similar to a one-time purchase with all capital, right?
The market can move sideways, up and down. But end up where they started in the long run. However, you will never be able to accurately predict where the market is headed.
If bitcoin had moved even lower, rather than higher, the price average would have allowed for even bigger profits. This is where you make sure you have long-term profits, not just immediate ones.
Problem 4: DCA in a rising market
In this last problem, also divide the capital of 10000$ into four installments for 5000, 6500, 7000, 8000. So after 4 purchases you have 1.55 BTC. When the price increases, you have the profit and loss in the following table:
- SELL at 4000$ = Take Profit -3800$
- SELL at 6000$ = Take Profit -700$
- SELL at 8000$ = Take Profit 2400$
This is a problem where DCA performs a bit poorly, at least in the short term. Bitcoin rallied higher and then continued higher. Therefore, price averaging does not help you maximize your profits. This one involves buying the whole thing in one go.
But unless you are making short term profits, this is a rare scenario in life. Bitcoin can evaporate, kkk. So, if you are investing for the long term, it is advisable to spread the capital in the trades. Even if that means you have to pay more at a certain price.
Is the price averaging strategy really good?
In general, the price averaging strategy offers three main benefits that can lead to better returns: Avoiding market fomo, avoiding market confusion, Long term investment thinking.
Because investors often fluctuate between fear and greed. They tend to make emotional trading decisions when the market reverses.
However, if you use DCA, you will buy when people are selling in fear (green quit, red watch, kkk).
Get a good price and set yourself up for a long profit. Markets tend to move up over time, and averaging prices can help you realize that a bear market is a great long-term opportunity. Instead of being afraid of things.
Limitations of the average DCA method
The first, perhaps the most discussed, is the modest profit. More frequent purchases increase transaction costs. However, with exchanges charging less transaction fees, this cost becomes more manageable.
Furthermore, if you are investing for the long term, the fees will become very small compared to your overall portfolio since you are buying for long term investment purposes. Binance is my top choice because of its diverse ecosystem and reasonable fee schedule.
Second, you can forego the profit you would have earned if you had invested in a one-time purchase and the property you purchased appreciates in value.
However, the success of trading largely depends on identifying the market correctly when predicting the short-term movement of an asset class. This is done by famous and good analysts.

RISK MANAGEMENT As we wait for GBP CPI news later today and the BOE rate hike decision on thursday , its good to remind ourselves that one trade doesn't make us its a marathon not a race . The volatility associated with these fundamentals is always a double edged sword . STAY WOKE

The Gold Standard and the Global Monetary SystemI. Introduction
The history of international monetary systems has been a story of constant evolution. Of the many systems that have been used over the centuries, the Gold Standard stands out for its longevity and its critical role in shaping the world's economic landscape. This essay will first discuss the Gold Standard, then delve into President Richard Nixon's monumental decision to sever the tie between the U.S. dollar and gold, known as the 'Nixon Shock.' This discussion will segue into the subsequent transformation of the global monetary system, culminating in an analysis of our present-day monetary era.
II. The Gold Standard Era
The Gold Standard, which flourished between the late 19th century and the early 20th century, was a monetary system where the value of a country's currency was directly linked to gold. Each country promised to convert its currency into a fixed amount of gold upon demand. This system provided a stability that fostered international trade and investment, as it offered predictability of exchange rates and a constraint on inflation. However, it also meant that national monetary policies were subordinated to the need to maintain gold parity, thereby constraining a government's ability to respond to domestic economic conditions.
III. Nixon's Depreciation and the End of the Gold Standard
In 1971, amidst growing economic pressures, President Richard Nixon declared that the United States would no longer exchange gold for U.S. dollars held in foreign reserves, effectively ending the Gold Standard. This move was initially designed as a temporary measure to protect U.S. gold reserves, which were dwindling due to persistent trade deficits. However, the 'Nixon Shock' proved to be a permanent shift in international monetary policy. Nixon's move unshackled the U.S. dollar (and other global currencies) from the constraints of gold, allowing for more flexible monetary policies. This change allowed governments to respond more efficiently to economic downturns by manipulating the money supply. Yet, it also introduced a new era of exchange rate volatility and inflation risk, challenges that economies continue to grapple with today.
IV. The Transformation of the Global Monetary System
The end of the Gold Standard marked the transition to the era of fiat money—currency that is backed by the full faith and trust in the government that issues it, rather than a physical commodity like gold. Fiat money systems have provided governments with greater flexibility to manage economic conditions through monetary policy, as they can adjust the money supply to influence interest rates, manage inflation, stimulate growth, or address economic crises. However, the reliance on faith and trust in the government has also led to episodes of hyperinflation and economic crises in countries where that faith was misplaced or abused.
V. The Present-day Monetary Era
In the current monetary era, central banks, like the Federal Reserve in the U.S., use open market operations and other monetary policy tools to control the money supply and influence economic conditions. Decoupling from gold has also facilitated the rise of digital currencies and novel monetary ideas like cryptocurrency, reshaping our understanding of money and value. However, this freedom has its downsides; the absence of a physical constraint like gold can lead to fears about runaway inflation, especially in times of significant increases in the money supply, such as the response to the COVID-19 pandemic.
VI. Conclusion
The Gold Standard, Nixon's Shock, and the transformation of the global monetary system offer key insights into the strengths and weaknesses of different monetary systems. While the Gold Standard provided a stability that fostered international trade, it limited the ability of governments to respond to domestic economic conditions. The Nixon Shock and the transition to a fiat money system have provided greater flexibility, but also introduced new challenges in terms of inflation risk and exchange rate volatility. As we navigate our present-day monetary era, it is essential to remember the lessons of the past while staying open to new innovations and ideas in our ongoing quest to develop a monetary system that best serves the needs of society.

Understanding Market Corrections:Definition & Key ConsiderationsInvesting in the stock market has the potential to generate substantial wealth over the long term, although it comes with inherent risks. One notable obstacle that investors frequently encounter involves safeguarding their capital during periods of declining stock prices. When the market undergoes a downturn, the inclination to panic and sell off investments to evade additional losses can be strong. However, this reactive approach often results in even greater financial setbacks and hinders the ability to capitalize on future market rebounds. In this comprehensive article, we will delve into the concept of a market correction and delve into various strategies that can assist investors in preserving their capital amidst market downturns, enabling them to emerge stronger when the market inevitably recovers.
Market Correction: A Comprehensive Explanation
In the realm of financial markets, a market correction is a notable event characterized by a substantial decline in the value of a financial instrument. This decline typically ranges between 10% to 20% and can encompass individual stocks of a specific company or even extend to encompass entire market indices comprising a vast array of companies. The duration of a correction can vary significantly, ranging from as short as a single day to as long as a year, with the average duration spanning approximately four months.
Market corrections can be triggered by a myriad of factors, each with its own unique catalyst. These factors can range from a company's disappointing financial performance and weak earnings report to more extensive global geopolitical conflicts. In some instances, corrections may occur seemingly without any discernible external cause.
It is worth noting that market corrections are not exclusive to stocks alone. They can manifest in various other financial instruments such as commodities like oil, platinum, and grain, as well as currencies, funds, specific industry sectors, or even the entire market as a whole. This exemplifies the widespread impact that a correction can have across diverse segments of the financial landscape.
To illustrate the significance of a market correction, let's consider an example from recent history. In the year 2018, the prices of over 500 companies experienced a decline of 10% or more. This widespread correction exemplifies how fluctuations in market conditions can influence a substantial number of companies simultaneously, affecting their valuation and investor sentiment.
In conclusion, a market correction denotes a notable decline in the value of financial instruments, with the range typically falling between 10% to 20%. The causes behind these corrections can be diverse and encompass factors ranging from company-specific issues to broader global conflicts. Moreover, corrections can impact various financial instruments and market segments, underscoring their potential for wide-reaching consequences within the financial landscape.
Example : AMZN stocks Daily chart showing a correction in 2018 - 2020
Market corrections are not uncommon events within the realm of financial markets. On average, a decline of 10-20% in the stock market transpires approximately once a year. These corrections, characterized by a significant decrease in stock prices, serve as reminders of the inherent volatility and fluctuations present in the market.
While corrections of 10-20% occur relatively frequently, more profound market declines exceeding 20% are less frequent, transpiring approximately once every six years. These substantial corrections are often referred to as market collapses, signifying a more severe and prolonged downturn.
One illustrative example of a market collapse occurred in response to the global pandemic outbreak in March 2020. The COVID-19 pandemic triggered a swift and severe decline in stock markets worldwide, leading to a precipitous drop of approximately 38% within a matter of days. This extreme correction exemplifies the impact of unforeseen events and external factors on market stability and investor sentiment.
It is important to recognize that market corrections and collapses are not solely confined to a particular asset class or geographic region. They can have a broad-ranging effect, transcending national boundaries and impacting various financial instruments, indices, and markets worldwide.
In summary, market corrections, defined by significant declines in stock prices, are regular occurrences, transpiring approximately once a year with a magnitude of 10-20%. Market collapses, on the other hand, encompass more profound declines exceeding 20% and typically transpire once every six years. These events serve as reminders of the dynamic nature of financial markets and their vulnerability to various factors, such as the recent pandemic-induced collapse in 2020, which had a profound impact on global markets.
Example : SPX500 / US500 stocks Daily chart showing a correction in 2020
Investors who adopt a long-term investment strategy tend to navigate corrections with relative ease, primarily due to their extended investment horizon. By committing their funds for a substantial period, typically ranging from 5 to 10 years, these investors are less likely to be perturbed by temporary price declines. On the other hand, individuals who rely on leverage or engage in short-term trading bear the brunt of corrections, experiencing greater challenges and losses.
The impact of a correction can be readily observed by examining the chart depicting the historical performance of any given company. By selecting the annual or five-year chart display, one can identify specific time periods when the asset's value experienced temporary declines. Additionally, it is crucial to consider the decrease in stock price subsequent to the ex-dividend date, commonly referred to as the dividend gap. It is essential to note that the dividend gap phenomenon is distinct from a correction and should be treated as such.
What Causes A Correction?
A correction in the stock market can be triggered by a multitude of factors and events that impact stock prices. These events can range from speeches given by company executives, investor reports, pandemics, regulatory changes, economic sanctions, natural disasters like hurricanes and floods, man-made disasters, to high-level meetings of world leaders. Even the most stable companies can experience declines in their stock prices due to these events.
It is important to recognize that human behavior also plays a significant role in causing market corrections. The stock market is inherently driven by human participation and investor sentiment, which can sometimes lead to corrective actions. For instance, if a popular figure like Elon Musk garners significant attention and support, investors may pour money into his company beyond its actual earnings. Eventually, the overvaluation of such a "hyped" company may result in a decline in its stock price.
Furthermore, investors often attempt to follow trends in the market. When a particular stock shows an upward trajectory, more people tend to invest in it, thus increasing its demand and subsequently driving up its price. However, as the price reaches a certain peak, some investors choose to sell their holdings to realize profits. This selling pressure can initiate a correction, causing those who entered the market later to incur losses. Therefore, blindly chasing market trends without careful analysis may prove detrimental.
Additionally, corrections can exhibit seasonal patterns. For example, during the summer months, prior to holidays or extended weekends, investor participation in trading may decrease. This reduced trading activity leads to lower liquidity in stocks, creating an opportunity for speculators to exploit the situation. Such periods often witness sharp price fluctuations, potentially resulting in stock prices declining by 10-20%.
It is crucial to understand that corrections are a natural part of the market cycle, and it is neither productive nor feasible to fear them indefinitely. The market cannot sustain perpetual growth, and corrections serve as necessary adjustments. By acknowledging their inevitability, investors can adopt strategies that are mindful of market dynamics and position themselves accordingly.
How Long Do Corrections Last?
Between the years 1980 and 2018, the US markets experienced a total of 37 corrections, characterized by an average drawdown of 15.7%. These corrections typically lasted for approximately four months before the market began to recover. Consider the following scenario: an investor commits $15,000 in January, experiences a loss of $2,355 during the correction, and by May, witnesses their portfolio rebounding to $15,999, based on statistical data. However, it is important to note that outcomes may deviate from this pattern.
It is worth noting that the magnitude of a stock's decline directly impacts the duration of its recovery. As an illustration, during the financial crisis of 2008, US stocks tumbled by approximately 50%. The subsequent recovery of the stock market extended over a period of 17 months, primarily attributed to the active support provided by the US government and the Federal Reserve. This underscores the notion that severe market downturns necessitate more prolonged periods for recuperation, even with significant intervention from regulatory bodies.
Dow Jones Industrial Average index drop in 2008
The timing of a market correction is often challenging for financiers and experts to predict with certainty. In retrospect, it becomes clear when a correction started, but identifying the precise moment beforehand is a complex task. Taking the aforementioned example of the market collapse in October 2007, it was not officially acknowledged until June 2008. This highlights the inherent difficulty in pinpointing the onset of a correction in real-time.
Following a correction, the market's recovery period can vary significantly. In some instances, the market may swiftly regain stability and resume an upward trajectory. However, in other cases, it may take several years for the market to fully recover from a correction. The duration of the recovery depends on a multitude of factors, including the severity of the correction, underlying economic conditions, government interventions, and investor sentiment.
Hence, it is crucial to recognize that financiers and market participants can only definitively determine the start and extent of a correction in hindsight. The future behavior of the market after a correction remains uncertain, and it is possible for the market to swiftly recover or take a considerable amount of time to regain stability.
How To Predict A Correction
Predicting the precise timing, duration, and magnitude of a market correction is inherently unreliable and challenging. There is no foolproof method to accurately forecast when a correction will occur, when it will conclude, or the extent to which asset prices will change.
Some economists and analysts attempt to predict market trends by employing various theories. For instance, Ralph Elliott formulated the Elliott Wave Theory, which posits that markets move in repetitive waves. By determining the current phase of the market—whether it is in an upward or downward wave—one could potentially profit. However, if such theories consistently yielded accurate predictions, financial losses during corrections would be virtually nonexistent.
It is crucial to acknowledge that market corrections are an inherent and inevitable part of market cycles. While attempting to predict corrections may be enticing, it is important to remember that they will inevitably occur, regardless of how long it has been since the previous one. Relying solely on the absence of a correction for an extended period as a basis for investment decisions warrants careful consideration and analysis rather than being treated as a definitive indicator.
Advantages And Disadvantages Of Market Correction
Advantages and disadvantages of market corrections can be summarized as follows:
Advantages of a market correction:
1) Buying opportunities: Market corrections often present favorable buying opportunities for investors. Lower stock prices allow investors to acquire shares at discounted prices, potentially leading to long-term gains when the market recovers.
2) Rebalancing opportunities: Corrections can prompt investors to rebalance their portfolios. Selling overvalued assets and reinvesting in undervalued ones can help optimize investment returns and maintain a diversified portfolio.
3) Expectation adjustment: Market corrections can serve as a reality check, helping investors reassess their expectations and risk tolerance. This can lead to more informed investment goals and strategies.
Disadvantages of a market correction:
1) Financial losses: Market corrections can result in substantial losses, particularly for investors who panic and sell their investments at lower prices. Reacting emotionally to market downturns may amplify the negative impact on portfolios.
2) Economic implications: Market corrections can have broader economic repercussions. They may lead to job losses, reduced consumer spending, and slower economic growth, potentially affecting industries and sectors beyond the financial markets.
3) Psychological impact: Market corrections can trigger fear, uncertainty, and anxiety among investors. These emotions may drive impulsive decision-making, such as selling investments hastily or hesitating to re-enter the market when conditions improve.
It is important for investors to carefully evaluate the potential advantages and disadvantages of market corrections and consider their own risk tolerance, investment goals, and long-term strategies when navigating such market events.
What Should You Do During A Correction?
Correction can make an investor richer or poorer or have no effect at all. The impact of a market correction on an investor's wealth depends on their actions and decisions during that period. It is impossible to predict with certainty the duration or direction of asset value changes during a correction.
However, there are general tips that can help investors navigate through a correction and potentially safeguard their finances:
1) Maintain a calm and rational mindset: During a correction, it is crucial to approach investment decisions with a cool head. Instead of making impulsive moves, take the time to understand the underlying causes of the correction and consider expert opinions and news.
2) Avoid excessive borrowing: It is advisable not to use borrowed money for investments, especially during a correction. This reduces the risk of incurring debts and potential losses. For beginners, it is often recommended to limit investments to the funds available in their brokerage accounts, particularly during a correction.
3) Assess company fundamentals: Evaluate the fundamental strength of a company by analyzing key metrics and ratios. Comparing a company's value with others in the same industry can provide insights. If a company is not overvalued, it may indicate that there is no fundamental reason for a correction, and its value may likely recover in due course.
4) View the correction as a buying opportunity: Prominent investors like Warren Buffett and Nathan Rothschild have emphasized that corrections present excellent opportunities for investment. If a stock's price has fallen, consider purchasing it based on the company's performance rather than solely focusing on the size of the discount. Maintaining some savings in cash allows for timely investments in undervalued assets.
5) Acknowledge the normalcy of corrections: It is important to recognize that corrections are a regular part of market cycles and serve as tests of an investor's composure. Following an investment strategy that includes provisions for investing during periods of 10-20% lower stock prices can help protect savings and optimize long-term returns.
By adhering to these general tips and maintaining a disciplined investment strategy, investors can better navigate market corrections and potentially preserve and enhance their financial well-being.
Conclusion
In summary, market corrections are an intrinsic aspect of the stock market's ebb and flow, and it is essential for investors to anticipate and navigate them effectively. During such periods, the inclination to succumb to panic and hastily sell investments can be strong. However, maintaining composure and adhering to prudent strategies that safeguard capital are crucial for weathering corrections and emerging stronger when the market inevitably rebounds. While corrections present challenges, they also offer advantageous opportunities, such as the ability to acquire stocks at discounted prices. Conversely, the potential for substantial losses exists, emphasizing the importance of a measured approach. A long-term investment strategy, rooted in sound analysis rather than reactionary emotions, serves as a vital compass for surviving corrections. By focusing on the broader picture and resisting the temptation of short-term market fluctuations, investors can position themselves for long-term success amidst the natural ebb and flow of the market.

Educational Trend Risk MitigationSeems self explanatory but I see so many experienced traders still risk-trading the wrong sides of a trend line.

Bitcoin - Using the Logarithmic ChartHi Traders, Investors and Speculators of Charts 📈📉
A logarithmic chart, also known as a log chart, is a type of chart that represents data using logarithmic scaling on one or both axes. It is commonly used in financial and stock market analysis to visualize price movements and identify trends. The main difference between a logarithmic chart and a linear chart is how the price scale is displayed. You can change your display when you rightclick on the righthand scale-pane where the prices are displayed, there you will find an option saying "logarithmic".
Using a logarithmic chart is particularly useful when analyzing the weekly timeframe view. The weekly timeframe provides a broader perspective and allows traders and investors to assess long-term trends and make more informed decisions. When combined with a logarithmic scale, the weekly timeframe on a logarithmic chart can provide a clearer picture of exponential growth or decline patterns over an extended period. This weekly timeframe smooths out short-term noise and focuses on the overall price movement. The logarithmic scale helps accurately represent the percentage changes in price over the weeks, rather than emphasizing absolute price changes. This is important because it allows traders to identify trends and patterns that might not be as evident on a linear chart. As seen on the chart, the log indicator (I'm using Bitcoin LFG Model By ARUDD) even shows a forecast and all of the values are indicated in color on the righthand scale.
The logarithmic chart helps traders spot long-term trends and key support zone and resistance zone more easily. By analyzing this chart over a macro perspective( in other words looking at yearly views), traders can identify significant price levels, trendlines, or moving averages that have historically acted as strong areas of support or resistance. These levels become more reliable when observed over a longer timeframe, and the logarithmic scale ensures that percentage changes are given equal weight, making trendlines and support/resistance levels more accurate and meaningful. Furthermore, using a weekly logarithmic chart can assist traders in understanding the magnitude and duration of trends. It helps visualize sustained periods of price growth or decline, enabling traders to assess the strength and potential continuation of a trend. This information is valuable for making longer-term trading decisions and managing risk appropriately.
In a linear chart, each unit of movement is represented by an equal distance on the price scale. For example, if BTC price moves from 10000 dollars to 20000 dollars, the distance on the chart is the same as the distance from 50k to 60k. However, in a logarithmic chart, the distance between each price level is proportional to the percentage change rather than the absolute price change. This means that equal percentage changes are represented by equal distances on the chart.
This is how you can utilize the Log Chart for your trading:
Trend Identification: Logarithmic charts can help identify long-term trends more accurately, especially when there are significant price increases or decreases over time. By using a logarithmic scale, the chart can better represent the percentage change in price, making it easier to spot trends that might be obscured on a linear chart.
Trade Setups: Logarithmic charts can be useful for identifying trade setups, such as breakouts or reversals. On a logarithmic chart, these levels may appear as trendlines or horizontal zones that have held significance in the past. Traders often look for increased volume or other technical indicators to confirm a breakout or reversal signal.
Key Trading Zones: Logarithmic charts can help identify key zones of support and resistance. These zones represent price levels where the asset has historically found buying or selling pressure. On a logarithmic chart, these zones can be identified as areas where the price has touched or bounced off trendlines. Traders may use these zones to make decisions about buying or selling a stock.
Long-Term Perspective: Logarithmic charts are particularly useful for long-term analysis because they can provide a better perspective on the overall price movement. They can reveal exponential growth or decline patterns that might be missed on a linear chart. This can be valuable for investors looking to make long-term investment decisions based on the stock's historical price behavior.
________________________________
BITSTAMP:BTCUSD COINBASE:BTCUSD INDEX:BTCUSD BINANCE:BTCUSD CRYPTO:BTCUSD CRYPTOCAP:BTC BINANCE:BTCUSDT KUCOIN:BTCUSDT OKX:BTCUSDT BYBIT:BTCUSDT COINBASE:BTCUSDT
_______________________
📢Follow us here on TradingView for daily updates and trade ideas on crypto , stocks and commodities 💎Hit like & Follow 👍
We appreciate your support !
CryptoCheck

Can You Trade The Cycle?Hi folks,
We're going to talk about trade cycles today. I hope you love learning! The strongest power is knowledge! We'll be stronger together!
In economics, a trade cycle is a pattern of economic activity that repeats itself over time. It is often characterized by periods of expansion, followed by periods of contraction. The trade cycle can be caused by a variety of factors, including changes in government policy, technological innovation, and consumer demand.
The trade cycle is also known as the business cycle or economic cycle. It is a recurring but not periodic fluctuation found in a nation's aggregate economic activity- a cycle that consists of expansions occurring at about the same time in many economic activities, followed by similarly general contractions (recessions).
There are a number of different types of trade cycles, each with its own characteristics. Some of the most common types of trade cycles include:
Kitchin cycle : The Kitchin cycle is a 4- to 5-year cycle of economic activity. It is named after Joseph Kitchin, an English economist who first described it in the 1920s. The Kitchin cycle is typically characterized by a period of rising prices, followed by a period of falling prices, followed by a period of rising prices again.
Juglar cycle : The Juglar cycle is a 10- to 15-year cycle of economic activity. It is named after Clement Juglar, a French economist who first described it in the 19th century. The Juglar cycle is typically characterized by a period of expansion, a period of contraction, a period of recovery, and another period of expansion.
Kondratiev cycle : The Kondratieff cycle is a 50- to 60-year cycle of economic activity. It is named after Nikolai Kondratieff, a Russian economist who first described it in the 1920s. The Kondratieff cycle is typically characterized by four phases: prosperity, recession, depression, and recovery.
Now, we know what cycles are in the shape of context. There is a million dollars question.
Can we trade the cycles?
As a trader or an investor, we definitely can trade the cycles. However, we need to learn what the cycle is, and how can it start or end.
There are a number of ways that a trader can trade the cycle. Some popular methods include:
1- Using fundamental analysis . Fundamental analysis can be used to assess the underlying value of a security. This information can be used to identify potential undervalued or overvalued securities.
2- Using cycle analysis. Cycle analysis is a more specialized form of technical analysis that focuses on identifying cycles in market prices. This information can be used to identify potential entry and exit points for trades, as well as to forecast future price movements.
3- Using technical analysis. Technical analysis can be used to identify key support and resistance levels, as well as trendlines and patterns. This information can be used to identify potential entry and exit points for trades.
It is important to note that there is no one-size-fits-all approach to trading the cycle. The best approach will vary depending on the individual trader's risk tolerance, trading style, and investment goals .
Final Tips:
📍 Use a stop-loss order . A stop-loss order is a type of order that automatically closes a trade if the price of a security reaches a certain level. This can help to protect your profits and limit your losses.
📍 Use a trailing stop-loss order . A trailing stop-loss order is a type of order that automatically moves with the price of a security. This can help to lock in profits and protect your gains.
📍 Be patient . Trading the cycle can be a patient game. It is important to be patient and wait for the right opportunities to trade.
📍 Don't overtrade . It is important to avoid overtrading. Overtrading can lead to losses and can also increase your risk.
Bonus Chart : US10Y
A task for you! Look at the bonus chart and leave your thoughts considering the correlation between US10Y and SP500 or ONS.

USDCHF SHORT - WAITING FOR PULLBACK!Waiting for a retest of 0.89804 to short USDCHF back to Daily lows at 0.88286
If you agree drop a like and if you have any questions leave a comment :)

GBPUSD LONG - STRONG UPTREND!Waiting for a retest of 1.26797 to long GBPUSD back to Daily key level at 1.30000
If you agree drop a like and if you have any questions leave a comment :)

EURGBP SHORT - BEARS STILL IN CONTROL!Waiting for a retest of 0.85680 to short EURGBP back to key 4H level at 0.85000
If you agree drop a like and if you have any questions leave a comment :)

Price BreakoutsHello traders 📊
On this picture here you can see 3 types of breakouts. On the left side you can see breakout examples in an downtrend and on the right side, you can see examples in an uptrend.
Breakouts occur when price breaks a certain zone (support or resistance) and in many cases breakouts represent very important moment. This is usually good time to look for opportunity to trade.
First type of breakout is "strong breakout". They occur once the price breaks certain zone with a strong candle and continue to move without pullback.
Second type of breakout is "retest". Retests are very common and extremely useful. Some of the best trading opportunities are when retest occurs. This means that price went back to test previously broken zone and this is usually good place to buy or sell.
Third type of breakout is "fake-out". This is the worst scenario as price quickly goes back after a breakout. Traders usually enter after a breakout, but once fake-out occurs, traders lose as price goes back quickly to hit stop loss.
We can not know exactly when fake-out will occur, but the best way to protect your account from this is to wait for the candle to close and to avoid to trade when big news are about to release.
Have a great day!

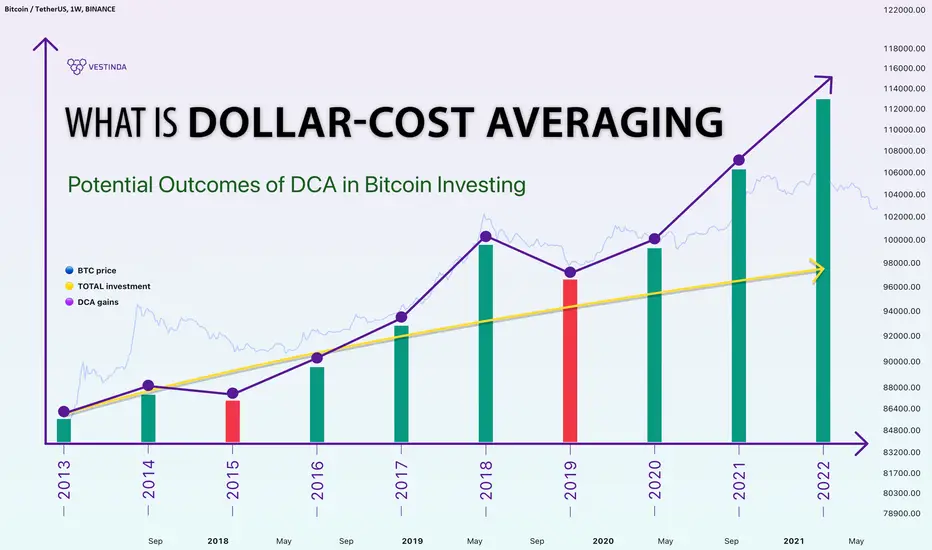
The Struggle of Consistency: Navigating DCA in Crypto InvestingHello dear @TradingView community! Today let’s focus on what is Dollar Cost Averaging ?
Determining the optimal moment to buy cryptocurrency is often a challenging task due to the high volatility of crypto assets. Prices can fluctuate unpredictably at any given time, leading traders to experience the fear of missing out (FOMO).
This fear is commonly felt when the price of a cryptocurrency, such as Bitcoin (BTC), suddenly surges or plunges. During price drops, individuals tend to panic and sell their holdings in a frantic attempt to avoid further losses. Conversely, when prices rise, panic ensues as people worry they don't possess enough coins to sell.
As evident, making decisions to buy or sell cryptocurrencies is no easy feat. However, if you seek long-term financial gains from cryptocurrencies without succumbing to the anxiety caused by every price spike, it would be wise to consider the Dollar Cost Averaging (DCA) strategy. Let's delve deeper into what DCA entails and how it functions in the realm of cryptocurrencies.
What is Dollar Cost Averaging?
Dollar cost averaging is an investment strategy where fixed amounts are regularly invested at consistent intervals, in contrast to a one-time lump sum investment. This approach involves executing transactions regardless of the asset's current price or market fluctuations. It is highly favored by investors and management funds seeking long-term profits from various assets like ETFs, commodities, cryptocurrencies, stocks, and more.
How does DCA work? To employ the DCA strategy, you first determine the amount of cryptocurrency you wish to invest. In conventional investing, one would typically invest the entire designated sum in a specific asset. However, with DCA, you invest fixed amounts of USD into Bitcoin or any other asset over a designated period. For instance, you may choose to purchase $100 worth of BTC every month for a 10 year period.
When utilizing DCA, the selection of the cryptocurrency becomes crucial. With around 22,904 cryptocurrencies available today, you must pick a coin you believe will appreciate in value and yield profitable returns. You can even choose an ETF which follows the trend (up or down) for any specific asset or basket of assets.
To comprehend how DCA operates, consider the following example:
Let's assume it is June of 2014, and Katie decides to allocate $10,000 in BTC. In June of 2014, the price of Bitcoin stood at approximately $560 per coin. Instead of investing the entire sum at once, Katie opts for dollar cost averaging throughout the 9 years.
From June 2014 to May 2022, Katie spent $100 each month on BTC, disregarding market price fluctuations. After 8 years, she spends almost $9,600 and her earnings reflect the following:
The green line in the chart represents Katie’s total investment amount, while the orange line depicts the fluctuation of portfolio size value over the 9-year period. When Katie initiated his investments, both the cost of BTC and his investments were approximately $100. However, as time progressed, the price of Bitcoin underwent changes.
By May of 2022, Katie's $9,600 investment had grown to $287,518 worth of BTC, showcasing a growth rate of 2,895%. With maximum gain of $631,540 at bitcoin ATH.
Online DCA tools are also available to estimate the earnings from purchasing bitcoins over several months. For example, platforms like dcaBTC enable users to customize their DCA strategy according to their preferences, specifying the amount to purchase, investment frequency, and duration.
To successfully implement dollar-cost averaging (DCA) in Bitcoin investing, several key steps need to be followed. These steps involve setting a budget, choosing a reputable cryptocurrency exchange, establishing recurring purchases or utilizing recurring purchases and automated investment platforms (such as Binance, Coinbase, Kraken, Crypto.com or even at Vestinda), and monitoring and adjusting the strategy as necessary.
Pros and Cons of Dollar Cost Averaging
Let's commence with the pros of dollar cost averaging. By making regular and consistent purchases over time, you mitigate the risk associated with poorly timed lump sum investments. Additionally, since you make regular purchases, you alleviate the fear of missing out and impulsive decision-making prompted by price fluctuations.
Cryptocurrency exchanges and platforms charge transaction fees for every trade. While one might assume that DCA would result in higher commission fees, it is essential to remember that this is a long-term strategy. The commission costs are negligible compared to the potential profits that can be realized over several years.
Moreover, DCA does not necessitate substantial investments. This strategy involves smaller and consistent purchases, eliminating the need to determine how best to deploy a large sum in one go. Furthermore, if prices suddenly drop at the time of purchase, you can acquire the cryptocurrency at a lower price.
However, it is important to note that if the cryptocurrency's price is bullish, you may end up buying at a higher price. This is particularly relevant when dealing with BTC or any chosen cryptocurrency. Many crypto enthusiasts and investors prefer to purchase a significant amount at once, fearing a subsequent price surge in the hours, days, weeks, or months to come.
As previously mentioned, with the DCA strategy, you purchase small amounts at regular intervals, regardless of market stability.
Should you utilize the DCA Strategy?
DCA facilitates maximizing profits with relatively low risk. Although this approach is not devoid of drawbacks, it offers numerous advantages that can be leveraged to your benefit.
Hence, is DCA worth your time and money? As always, we recommend thoroughly studying all available information before making any decisions. Save this article to your browser bookmarks for easy reference in the future.
Happy trading!
10 MOST important bar patterns to profit trade Bar patterns are elegant tools for every trader who trades on Price Action signals. I present to you 10 bar patterns that you must know!
These patterns are easily found on charts and allow for easy placement of stop loss and take profit.
Reversal Bar Patterns
1. Reversal Bar
2. Key Reversal Bar
3. Exhaustion Bar
4. Pin Bar
5. Two-Bar Reversal
6. Three-Bar Reversal
7. Three Bar Pullback
Volatility Bar Patterns
8. Inside Bar
9. Outside Bar
10. NR7
1. Reversal Bar
The low of a bullish reversal bar is below the low of the previous bar, and the close is above the close of the previous bar.
The high of a bearish reversal bar is above the high of the previous bar, and the close is below the close of the previous bar.
Buy above a bullish reversal bar in an uptrend.
Sell below a bearish reversal bar in a downtrend.
2. Key Reversal Bar
A bullish key reversal bar opens below the low of the previous bar and closes above its high.
A bearish key reversal bar opens above the high of the previous bar and closes below its low.
By definition, key reversal bars open with a price gap. Since gaps on intra-day timeframes are rare, most key reversal bars are found on daily timeframes and higher.
Buy above a bullish key reversal bar (if you are not sure, wait until the price closes above it, and only then buy).
Sell below a bearish key reversal bar (if you are not sure, wait until the price closes below it, and only then sell).
3. Exhaustion Bar
A bullish exhaustion bar opens with a downward gap. The price then moves up, and the bar closes near its high.
A bearish exhaustion bar opens with an upward gap. The price then moves down, and the bar closes near its low.
In both cases, the gap remains unfilled. Additionally, the exhaustion bar should form on high volume.
Buy above a bullish exhaustion bar.
Sell below a bearish exhaustion bar.
4. Pin Bar
It has a long and distinct tail.
In bullish pin bars, the lower tail occupies most of the bar. In bearish pin bars, the upper tail dominates.
Buy above a bullish pin bar that bounces off a support level.
Sell below a bearish pin bar that bounces off a resistance level.
5. Two-Bar Reversal
The two-bar reversal pattern consists of two strong bars closing in opposite directions.
The bullish version consists of a strong bearish bar followed by a strong bullish bar. The bearish version consists of a strong bullish bar followed by a strong bearish bar.
In bullish reversals, buy above the highest point of the two-bar pattern.
In bearish reversals, sell below the lowest point of the two-bar pattern.
6. Three-Bar Reversal
The bullish pattern consists of the following three bars:
1. A bearish bar
2. A bar with a lower high and a lower low
3. A bullish bar with a higher low and a close above the high of the second bar
The bearish pattern consists of the following three bars:
1. A bullish bar
2. A bar with a higher high and a lower low
3. A bearish bar with a lower high and a close below the low of the second bar
Buy above the high of the last bar in a bullish pattern.
Sell below the low of the last bar in a bearish pattern.
7. Three Bar Pullback
Three consecutive bearish bars form a bullish three-bar pullback pattern, and three consecutive bullish bars form a bearish three-bar pullback pattern.
In a bullish trend, wait for three consecutive bearish bars to form. Then buy above the next bullish bar.
In a bearish trend, wait for three consecutive bullish bars to form. Then sell below the next bearish bar.
8. Inside Bar
The inside bar must be completely within the range of the previous bar. In other words, the second bar must have a lower high and a higher low.
Place bracket orders around this pattern to trade its breakout in either direction. (A buy order above its high and a sell order below its low. Once one order is filled, cancel the other.)
Place only one order (either a buy or a sell) in accordance with the market trend.
Wait for the breakout of the inside bar and trade its lack of follow-through.
9. Outside Bar
The outside bar is the complete opposite of the inside bar.
Its range must exceed the range of the previous bar, i.e. it has a higher high and a lower low.
Wait for the breakout of the outside bar and open a position against the market movement. (Especially if the outside bars look like dojis or go against the trend.)
Trade its breakout, especially when the outside bar closes near its top or bottom.
10. NR7
This pattern requires the presence of seven bars. If the last bar has the smallest range in the sequence of bars, then this is an NR7 pattern.
As a reminder, the range of a bar is the difference between its high and low.
Buy on the breakout of the high of the last bar, if the trend is upward.
Sell on the breakout of the low of the last bar, if the trend is downward.

Why You Should Never Hold on to Your Positions Beyond a Certain Good day, traders.
I'd like to use this opportunity to advise both new and experienced traders alike that holding (hodling) your position is not recommended beyond a certain point. According to percentage calculations, the return required to recover to break-even increases at a considerably faster pace when losses grow in size (due to compound interest). It goes downward after a loss of 10% because a gain of 11% is required to make up for it.When the loss is 20%, it takes a 25% gain to make up the difference and return to break-even. To recoup from a 50% loss, a 100% gain is needed, and to reach the initial investment value after an 80% loss, a 400% gain is needed.
Investors who experience a bear market must understand that it will take some time to recover, but compounding returns will aid in the process. Think about a bear market where the value drops by 30% and the stock portfolio is only worth 70% of what it was. The portfolio increases by 10% to reach 77%. The subsequent 10% increases to 84.7%. The portfolio reached its pre-drop value of 102.5 percent after two further years of 10 percent gains. Consequently, a 30 percent decline requires a 42 percent recovery, but a four-year compounding rate of 10 percent returns the account to profitability.I will be doing a second part to this post on the idea of "DOLLAR COST AVERAGING" (DCA).
The math behind stock market losses clearly demonstrates the need for investors to take precautions against significant losses, as depicted in the graphic above. Stop-loss orders to sell stocks or cryptocurrencies that are mental or limit-based exist for a reason. If the market is headed towards a bear market, it will start to pay off once a particular loss threshold is reached. Investors occasionally struggle to sell stocks they enjoy at a loss, but if they can repurchase the stock or cryptocurrency at a lesser cost, they will like it.
Never stop learning
I would also love to know your charts and views in the comment section.
Thank you

GBPCAD SHORT - WAIT FOR RETEST!Waiting for a retest of 1.86284 to short GBPCAD back to 4H swing lows at 1.66284
If you agree drop a like and if you have any questions leave a comment :)

CHFJPY LONG - BULLS STILL ALIVE!Waiting for a retest of 153.969 to long CHFJPY back to 4H swing highs at 155.346
If you agree drop a like and if you have any questions leave a comment :)

CADCHF LONG - AREA OF CONFLUENCE!Waiting for a retest of 0.679058 to long CADCHF back to 4H swing highs at 0.68139
If you agree drop a like and if you have any questions leave a comment :)

NZDJPY LONG - BIG SWING AT PLAY!Waiting for a retest of 85.050 to long NZDJPY back to Daily swing highs at 87.236
If you agree drop a like and if you have any questions leave a comment :)

BIASES THAT EXPLAIN WHY TRADERS LOSE MONEYHello traders, today we will talk about WHY TRADERS LOSE MONEY
BIAS
WHAT IT MEANS…
HOW IT INFLUENCES TRADERS
Availability People estimate the likelihood of an event based on how easily it can be recalled. Traders put too much emphasis on their most recent trades and let recent results interfere with their trading decisions.
After a loss, traders often get scared or try to get back to break even. Both mental states lead to bad trading quickly.
After a win, many traders get over-confident and trade loosely.
You must be aware of how you react to recent results and trade with a high level of awareness.
Dilution effect Irrelevant data weakens other more relevant data. Using too many tools and trading concepts to analyze price could weaken the importance of the core decision drivers.
I wrote about redundant signals and how to combine the right tools here: click here
Gambler’s fallacy People believe that probabilities have to even each other out in the short term. Traders misinterpret randomness and believe that after three losing trades, a winning trade is more likely. The probabilities don’t change based on past results.
Even after 10 losses in a row, the next trade does not have a higher chance of being a winner.
Anchoring Overestimating the importance of the first available piece of information. Upon entering a trade, people set their whole chart and analysis in reference to their entry price and don’t see the whole picture objectively anymore.
You must always have a plan BEFORE you enter a trade.
Insensitivity to sample size Underestimating the variance for large and small sample sizes. Traders too often make assumptions about the accuracy of their system based on just a few trades, or even change parameters after only a few losers.
A decent sample size is 30 – 50 trades. Do not alter anything about your approach before you have reached this number. And make sure that you follow the same rules to get an accurate picture of your trading within the sample size.
Contagion heuristic Avoiding contact with objects people see as “contaminated” by previous contact. Traders avoid markets/instruments after having a large loss in that instrument, even when the loss was the fault of the trader.
Hindsight We see things that have already occurred as more probable than they were before they took place. Looking back on your trades and fishing for explanations why the trade has failed, even though those signals weren’t obvious at the time.
Do not change your indicator or setting after a loss to come up with explanations or excuses. Accept that losses are normal and always follow your plan.
Hot-hand fallacy After a successful outcome on a random event, another success is more likely. Traders believe that once they are in a winning streak, things become easier and they can “feel” what the market is going to do next.
I wrote about the hot-dand-fallacy in trading before: click here
Peak–end rule People judge an event based on how they felt at the peak of the event. Traders look at a losing trade and only see how much they were in profit at the maximum, but don’t look at what went wrong afterwards.
Do not change your reference point when in a trade and have a plan for your trade management and when to exit before entering a trade.
Simulation heuristic People feel more regret if they miss an event only by a little. Price that missed your target only by a little bit, or a trade where you got stopped out just by a few points can be more painful than other trades.
The outcome is out of your control and you cannot influence the price movements. The only thing you can do is manage your trade within your rules.
Social proof If unsure what to do, people look for what other people did. Traders too often ask for advice from other traders when they are not sure what to do – even when other traders have a completely different trading strategy.
You must take responsibility for your actions and results. And not rely on someone else.
Framing People make decisions based on how it is presented; a gain is more valuable than a loss and a sure gain is more valuable than a probabilistic greater gain. Traders close profitable trades too early because they value current profits more than a potentially larger profit in the future.
Cutting winners too soon is a huge problem. If this is an issue for you, reducing screen time can be helpful. Do not watch your trades tick by tick.
Sunk cost We will invest in something just because we have already invested in it. before Adding to losing trades because you are already invested, even though no objective reason to add exists.
You must define your stop loss in advance and then execute it without hesitation when it has been reached.
Confirmation Only looking for information that confirms your beliefs, ideas and actions. Blanking out reasons and signals that don’t support your trade and just looking for confirmation.
Especially when traders are in a loss, they only look for supportive information. Stay objective!
Overconfidence People have a higher confidence than what their level of skill actually suggests. Traders misjudge their level of expertise and skill. Consistently losing traders don’t see that it’s their fault.
Analyze your results objectively and get a trading journal to add even more accountability.
Selective perception Forgetting those things that caused discomfort. Traders forget easily that their own mistakes and wrong trading decisions caused the majority of their losses.
Do not blame the marjets, unfair circumnstances, your broker or any other outside event. You are the one who is responsible for making it work. It’s totally up to you and blaming others won’t help you make progress.
Which bias is the one that is causing you the greatest troubles? What are you workin on right now? Let me know in the comments below and I will answer with tips and ideas on how to overcome your struggles.
This chart is just for information
Never stop learning
I would also love to know your charts and views in the comment section.
Thank you

The ABCD Pattern: from A to DHello dear @TradingView community!
Are you familiar with the ABCD pattern?
The ABCD pattern is a highly effective tool utilized in trading to identify potential opportunities across diverse markets, including forex, stocks, cryptocurrencies, and futures. This pattern takes the form of a visual and geometric arrangement, characterized by three consecutive price swings or trends. When observed on a price chart, the ABCD pattern exhibits a striking resemblance to a lightning bolt or a distinctive zig-zag pattern.
Importance of the ABCD Pattern
The significance of the ABCD pattern lies in its ability to identify trading opportunities across different markets, timeframes, and market conditions. Whether the market is bullish, bearish, or range-bound, the ABCD pattern remains a reliable tool.
By recognizing the completion of the pattern at point D, you can get a perspective trade entries. Furthermore, the ABCD pattern helps you determine the risk-to-reward ratio before initiating a trade. When multiple patterns converge within the same timeframe or across different timeframes, it strengthens the trade signal and increases the likelihood of a profitable outcome.
Finding an ABCD Pattern
The ABCD pattern has both a bullish and bearish version. Bullish patterns indicate higher probability opportunities to buy or go long, while bearish patterns suggest opportunities to sell or go short.
To identify an ABCD pattern, it is essential to locate significant highs or lows on a price chart, represented by points A, B, C, and D. These points define the three consecutive price swings or legs of the pattern: the AB leg, the BC leg, and the CD leg.
Trading is not an exact science, so traders often employ Fibonacci ratios to determine the relationship between the AB and CD legs in terms of both time and price. This approximation assists in locating the potential completion of the ABCD pattern. When patterns converge, it increases the probability of successful trades and enables you to make more accurate decisions regarding entries and exits.
Types of ABCD Patterns
There are three types of ABCD patterns, each having both a bullish and bearish version. To validate an ABCD pattern, specific criteria and characteristics must be met. Here are the characteristics of the bullish and bearish ABCD patterns:
📈 Bullish ABCD Pattern Characteristics (buy at point D):
To effectively trade the bullish ABCD pattern, you might consider the following characteristics:
1. Find AB:
Identify point A as a significant high and point B as a significant low. During the move from A to B, ensure that there are no highs above point A and no lows below point B.
2. After AB, then find BC:
Point C should be lower than point A. In the move from B up to C, there should be no lows below point B and no highs above point C. Ideally, point C will be around 61.8% or 78.6% of the length of AB. However, in strongly trending markets, BC may only be 38.2% or 50% of AB.
3. After BC, then draw CD:
Point D, which marks the completion of the pattern, must be lower than point B, indicating that the market has successfully achieved a new low. During the move from C down to D, there should be no highs above point C.
4.1 Determine where D may complete (price):
To determine the price level at which point D may complete, Fibonacci and ABCD tools can be utilized. CD may equal AB in price, or it may be 127.2% or 161.8% of AB in price. Alternatively, CD can be 127.2% or 161.8% of BC in price.
4.2 Determine when point D may complete (time) for additional confirmation:
For additional confirmation, you can analyze the time aspect of the pattern. CD may equal AB in time, or it may be around 61.8% or 78.6% of the time it took for AB to form. Additionally, CD can be 127.2% or 161.8% of the time it took for AB to form.
5. Look for Fibonacci, pattern, trend convergence:
Convergence of Fibonacci levels, pattern formations, and overall trend can strengthen the trade signal. Therefore, you should look for instances where these elements align.
6. Watch for price gaps and/or wide-ranging candles in the CD leg:
As the market approaches point D, it is important to monitor for any price gaps or wide-ranging candles in the CD leg. These may indicate a potential strongly trending market, and you might expect to see price extensions of 127.2% or 161.8%.
📉 Bearish ABCD Pattern Characteristics (sell at point D):
To effectively trade the bearish ABCD pattern, you might consider the following characteristics:
1. Find AB:
Identify point A as a significant low and point B as a significant high. During the move from A up to B, ensure that there are no lows below point A and no highs above point B.
2. After AB, then find BC:
Point C should be higher than point A. In the move from B down to C, there should be no highs above point B and no lows below point C. Ideally, point C will be around 61.8% or 78.6% of the length of AB. However, in strongly trending markets, BC may only be 38.2% or 50% of AB.
3. After BC, then draw CD:
Point D, which marks the completion of the pattern, must be higher than point B, indicating that the market has successfully achieved a new high. During the move from C up to D, there should be no lows below point C and no highs above point D.
4.1 Determine where D may complete (price):
To determine the price level at which point D may complete, Fibonacci and ABCD tools can be utilized. CD may equal AB in price, or it may be 127.2% or 161.8% of AB in price. Alternatively, CD can be 127.2% or 161.8% of BC in price.
4.2 Determine when point D may complete (time) for additional confirmation:
For additional confirmation, you can analyze the time aspect of the pattern. CD may equal AB in time, or it may be around 61.8% or 78.6% of the time it took for AB to form. Additionally, CD can be 127.2% or 161.8% of the time it took for AB to form.
5. Look for Fibonacci, pattern, trend convergence:
Convergence of Fibonacci levels, pattern formations, and overall trend can strengthen the trade signal. Therefore, you should look for instances where these elements align.
6. Watch for price gaps and/or wide-ranging bars/candles in the CD leg:
As the market approaches point D, it is important to monitor for any price gaps or wide-ranging bars/candles in the CD leg. These may indicate a potential strongly trending market, and you might expect to see price extensions of 127.2% or 161.8%.
💜 We would love to hear your feedback!
Did you find the article on the ABCD pattern helpful? We strive to provide valuable and informative content for traders like you. Your feedback is important to us as it helps us improve our articles and better serve our readers.
Please take a moment to share your thoughts and suggestions. Did the article cover the topic comprehensively? Were the explanations clear and easy to understand? Is there anything you would like us to add or elaborate on?
We appreciate your time and input. Thank you for being a valued reader, and we look forward to hearing your feedback!
