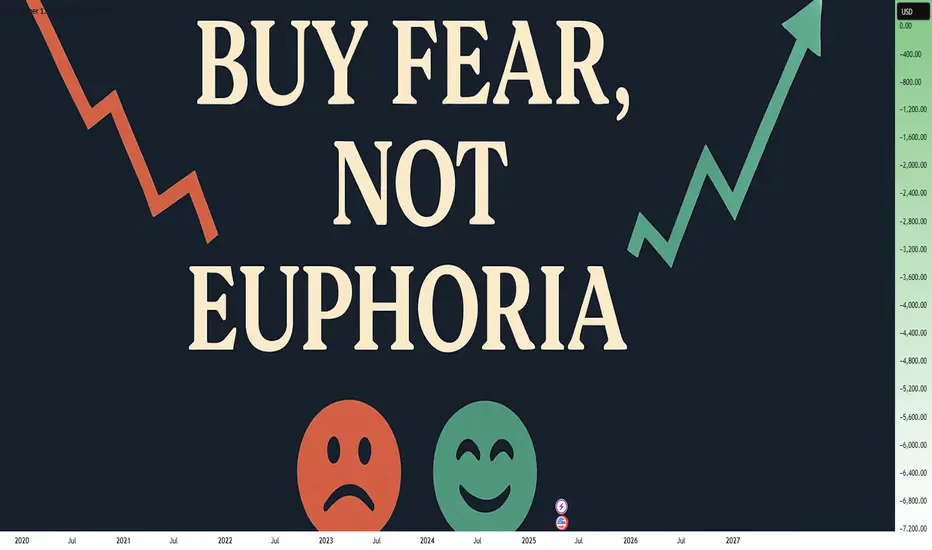
Buy Fear, Not Euphoria: The Trader's EdgeWhen you look back at the greatest trading opportunities in history, they all seem to share a common element: fear. Yet, when you're in the moment, it feels almost impossible to pull the trigger. Why? Because fear paralyzes, while euphoria seduces. If you want to truly evolve as a trader, you need to master this fundamental shift: buy fear, not euphoria.
Let's break it down together.
________________________________________
What Fear and Euphoria Really Mean in Markets
In simple terms, fear shows up when prices are falling sharply, when bad news dominates the headlines, and when people around you are saying "it's all over."
Euphoria, on the other hand, is everywhere when prices are skyrocketing, when everyone on social media is celebrating, and when it feels like "this can only go higher."
In those moments:
• Fear tells you to run away.
• Euphoria tells you to throw caution to the wind.
Both emotions are signals. But they are inverted signals. When fear is extreme, value appears. When euphoria is extreme, danger hides.
________________________________________
Why Buying Fear Works
Markets are pricing machines. They constantly adjust prices based on emotions, news, and expectations. When fear hits, selling pressure often goes beyond what is rational. People dump assets for emotional reasons, not fundamental ones.
Here’s why buying fear works:
• Overreaction: Bad news usually causes exaggerated moves.
• Liquidity Vacuums: Everyone sells, no one buys, creating sharp discounts.
• Reversion to Mean: Extreme moves tend to revert once emotions stabilize.
Buying into fear is not about being reckless. It’s about recognizing that the best deals are available when others are too scared to see them.
________________________________________
Why Chasing Euphoria Fails
At the peak of euphoria, risks are often invisible to the crowd. Valuations are stretched. Expectations are unrealistic. Everyone "knows" it's going higher — which ironically means there's no one left to buy.
Chasing euphoria often leads to:
• Buying high, selling low.
• Getting trapped at tops.
• Emotional regret and revenge trading.
You’re not just buying an asset — you're buying into a mass illusion.
________________________________________
How to Train Yourself to Buy Fear
It's not enough to "know" this. In the heat of the moment, you will still feel the fear. Here's how you build the right habit:
1. Pre-plan your entries: Before panic strikes, have a plan. Know where you want to buy.
2. Focus on strong assets: Not everything that falls is worth buying. Choose assets with strong fundamentals or clear technical setups.
3. Scale in: Don’t try to catch the bottom perfectly. Build positions gradually as fear peaks.
4. Use alerts, not emotions: Set price alerts. When they trigger, act mechanically.
5. Remember past patterns: Study previous fear-driven crashes. See how they recovered over time.
Trading is a game of memory. The more you internalize past patterns, the easier it is to act when everyone else panics.
________________________________________
A Recent Example: April 2025 Tariff Panic
Very recently, at the start of April, Trump’s new tariff announcements sent shockwaves through the market. Panic took over. Headlines screamed. Social media was flooded with fear.
But if you looked beyond the noise, charts like SP500 and US30 told a different story: the drops took price right into strong support zones.
At the time, I even posted this : support zones were being tested under emotional pressure.
If you had price alerts set and reacted mechanically, not emotionally , you could have bought into that fear — and potentially benefited from the rebound that followed just days later.
This is the essence of buying fear.
________________________________________
Final Thoughts
In trading, you are paid for doing the hard things. Buying when it feels terrible. Selling when it feels amazing.
Remember:
Fear offers you discounts. Euphoria offers you traps.
The next time the market feels like it's crashing, ask yourself:
• Is this fear real, or exaggerated?
• Is this an opportunity hiding under an emotional fog?
If you can answer that with clarity, you're already ahead of 90% of traders.
Stay rational. Stay prepared. And above all: buy fear, not euphoria.
Disclosure: I am part of Trade Nation's Influencer program and receive a monthly fee for using their TradingView charts in my analyses and educational articles.
Educationalposts
How to Regain Your Trading MOJOEvery trader, no matter how experienced, eventually hits a rough patch — a period where trades don’t work out, motivation fades, and confidence slips away.
If you feel like you've lost your trading mojo, you're not alone. The key is not to quit but to rebuild it methodically.
Here’s how to get your trading energy back on track:
1. Accept That Slumps Are Normal
First, realize that losing your mojo is part of the trading journey.
Even the best traders experience drawdowns — emotionally and financially.
Acknowledging that this phase is temporary immediately removes some of the pressure and guilt.
Self-acceptance is your first weapon.
2. Reduce Risk and Slow Down
When your confidence is low, lower your position size.
Trade smaller. Risk less.
You don’t need to stop trading completely — you need to stop damaging yourself further.
Think of it as “active recovery,” much like athletes training lightly after an injury.
3. Go Back to Basics
Strip your trading plan down to the essentials:
- Focus on one setup you trust.
- Use clear entry and exit rules.
- Avoid complicated strategies or "revenge trading."
Simplicity restores clarity, and clarity brings confidence.
4. Reframe Losses Mentally
Instead of seeing losses as failures, view them as fees for learning.
Ask yourself after each trade:
- "Was this trade according to my plan?"
- "Did I respect my stop loss?"
If yes, you are winning — even if the trade loses money.
Consistency in good decision-making rebuilds emotional momentum.
5. Visualize the Trader You Want to Be
Take 5 minutes each day to visualize yourself executing perfect trades:
- Calmly analyzing.
- Patiently waiting.
- Executing your plan without emotion.
Your brain needs new emotional associations with trading — not fear and anxiety, but calm and focus.
6. Set Tiny Wins
Don't chase the big win right away.
Set micro-goals like:
- "I will follow my stop loss rules today."
- "I will not overtrade today."
- "I will wait for my setup."
Achieving small wins daily rebuilds your trader identity brick by brick.
Final Thoughts :
Regaining your trading mojo is less about finding a "magic moment" and more about stacking good habits and resetting your mind.
You don't need a new system, a new market, or a lucky break.
You need to reconnect with the disciplined, focused trader within you.
Stay patient, stay structured, and remember — your mojo isn’t lost forever. It’s just waiting for you to catch up. 🚀

Peace Headlines Are Here — But Markets Have Already Moved OnA Russia-Ukraine peace deal making headlines right now is historic news — politically and emotionally.
But for the forex and commodities markets?
The real money already left this story behind months ago.
🧠 Smart Money Knows: Markets Price in the Future, Not the Past
Two years ago, the war sent shockwaves through oil, gas, wheat, and risk currencies.
By late 2023, price action had already normalized — the "war premium" faded out quietly.
Commodities stabilized. Forex volatility shifted. Safe havens lost their edge.
Traders adapted, recalibrated, and moved on to new battlegrounds.
Bottom Line:
The market already priced in a future where this conflict would eventually fade — peace or no peace.
📊 What Actually Drives Forex Now
While peace headlines grab attention, the real macro drivers today are:
🔥 Tariff escalation and global trade wars
🔥 Sticky inflation battles (core services inflation still high)
🔥 Central bank pivot games (Fed, ECB, BoJ)
🔥 Global growth fears (China slowdown, EU stagnation)
This is where new money is flowing.
Not into a two-year-old headline finally catching up.
🛡️ "Buy the Rumor, Sell the Fact" in Action
For two years, markets have priced in an eventual end (or fade) to the Ukraine conflict.
A peace agreement now?
→ It confirms expectations, not shocks them.
→ It may trigger a short-lived risk-on pop (EUR, AUD, NZD up, gold down) —
→ But unless it unleashes massive new money flows (unlikely), that pop gets sold.
🔥 Final Thought:
If you're still trading the last war, you're already late.
The next major moves won't come from peace headlines — they'll come from tariff escalations, inflation battles, and central bank pivots.
Focus forward.
That's where opportunity lives.
💬 Question for Serious Traders:
Which macro theme are you really watching into summer 2025?
Peace headlines... or the new fires already burning?
Drop your insights below. 👇

MEME: HOW THE HUMAN BRAIN WORKSSuper in-depth infographic detailing how the human brain works. Crypto People TOO! 🤣🤣🤣🤣
You can right-click the image below and select "Save As..." to download and share it with your friends.
Have FUN!

Trading Psychology Trap: The Dark Side of Hedging a Bad Trade⚡ Important Clarification Before We Begin
In professional trading, real hedging involves sophisticated strategies using derivatives like options, futures, or other financial instruments.
Banks, funds, and major institutions hedge to manage portfolio risk, based on calculated models and complex scenarios.
This article is not about that.
We are talking about the kind of "hedging" retail traders do — opening an opposite position at the broker to "protect" a losing trade.
It may feel smart in the moment, but psychologically, it can be a hidden trap that damages your trading discipline.
Let’s dive into why emotional hedging rarely works for independent traders.
________________________________________
In trading, there’s a moment of panic that every trader has faced:
"My short position is in the red… maybe I’ll just open a long to balance it out."
It feels logical. You’re hedging. Protecting yourself. But in reality, you might be stepping into one of the most deceptive psychological traps in trading.
Let’s unpack why emotional hedging is rarely a good idea—and how it quietly sabotages your progress.
________________________________________
🧠 1. Emotional Relief ≠ Strategic Thinking
Hedging often arises not from a solid strategy, but from emotional discomfort.
You don’t hedge because you’ve analyzed the market. You hedge because you can’t stand the pain of a losing position.
This is not trading.
This is emotional anesthesia.
You’re trying to feel better—not trade better.
________________________________________
🎭 2. The Illusion of Control
Opening a hedge feels like taking back control.
In reality, you’re multiplying complexity without clarity.
You now have:
• Two opposing positions
• No clear directional bias
• An unclear exit strategy
You’ve replaced one problem (a loss) with two: mental conflict and strategic confusion.
________________________________________
🎢 3. Emotional Volatility Rises Sharply
With two positions open in opposite directions:
• You root for both sides at once.
• You feel relief when one wins, and stress when the other loses.
• Your mind becomes a battleground, not a trading desk.
This emotional volatility leads to irrational decisions, fatigue, and trading paralysis.
________________________________________
🔄 4. You Delay the Inevitable
When you hedge a losing position, you don’t fix the mistake.
You prolong it.
Eventually, you’ll have to:
• Close one side
• Add to one side
• Or exit both at the wrong moment
Hedging here is just postponed decision-making—and it gets harder the longer you wait.
________________________________________
🧪 5. You Build a Dangerous Habit
Hedging out of fear creates a reflex:
"Every time I’m losing, I’ll hedge."
You’re not learning to cut losses or reassess your strategy.
You’re learning to panic-protect.
And over time, you start to rely on hedging as a crutch—rather than developing real confidence and discipline.
________________________________________
✅ The Healthier Alternative
What should you do instead?
• Cut the loss.
• Review the trade.
• Wait for a fresh setup that aligns with your plan.
Accepting a losing trade is hard. But it’s a sign of maturity, not weakness.
Hedging may feel clever in the moment, but long-term consistency comes from clarity, not complication.
________________________________________
🎯 Final Thought
Emotional hedging isn’t about strategy.
It’s about fear.
The best traders don’t hedge to escape a loss.
They manage risk before the trade starts —and have the courage to close what’s not working.
Don’t fall into the illusion of safety.
Master the art of decisive action. That’s where real edge lives. 🚀

Serios Traders Trade Scenarios, Not Certaintes...If you only post on TradingView, you're lucky — moderation keeps discussions professional.
But on other platforms, especially when you say the crypto market will fall, hate often knows no limits.
Why?
Because most people still confuse trading with cheering for their favorite coins.
The truth is simple:
👉 Serious traders don't operate based on certainties. They work with living, flexible scenarios.
In today's educational post, I'll show you exactly how that mindset works — using a real trade I opened on Solana (SOL).
________________________________________
The Trading Setup:
Here’s the basic setup I’m working with:
• First sell: Solana @ 150
SL (stop-loss): 175
TP (take-profit): 100
• Second sell: Solana @ 160
SL: 175
TP: 100
I won’t detail here why I believe the crypto market hasn’t reversed yet — that was already explained in a previous analysis.
Today, the focus is how I prepare my mind for different outcomes, not sticking to a fixed idea.
________________________________________
The Main Scenarios:
Scenario 1 – The Pessimistic One
The first thing I assume when opening any position is that it could fail.
In the worst case: Solana fills the second sell at 160 and goes straight to my stop-loss at 175.
✅ This is planned for. No drama, no surprise. ( Explained in detail in yesterday's educational post )
________________________________________
Scenario 2 – Pessimistic but Manageable
Solana fills the second sell at 160, then fluctuates between my entries and around 165.
If I judge that it’s accumulation, not distribution, I will close the trade early, taking a small loss or at breakeven.
________________________________________
Scenario 3 – Mini-Optimistic
Solana doesn’t even trigger the second sell.
It starts to drop, but stalls around 120-125, an important support zone as we all saw lately.
✅ In this case, I secure the profit without waiting stubbornly for the 100 target.
Important tactical adjustment:
If Solana drops below 145 (a support level I monitor), I plan to remove the second sell and adjust the stop-loss on the initial position.
________________________________________
Scenario 4 – Moderately Optimistic
Solana doesn’t fill the second order and drops cleanly to the 100 target.
✅ Full win, perfect scenario for the first trade
________________________________________
Scenario 5 – Optimistic but Flexible
Solana fills the second sell at 160, then drops but gets stuck at 120-125(support that we spoken about) instead of reaching 100.
✅ Again, the plan is to close manually at support, taking solid profit instead of being greedy.
________________________________________
Scenario 6 – The Best Scenario
Solana fills both sell orders and cleanly hits the 100 target.
✅ Maximum reward.
________________________________________
Why This Matters:
Scenarios Keep You Rational. Certainties Make You Fragile.
In trading, it's never about being "right" or "wrong."
It's about having a clear plan for multiple outcomes.
By thinking in terms of scenarios:
• You're not emotionally attached to a single result.
• You're prepared for losses and quick to secure wins.
• You're flexible enough to adapt when new information appears.
Meanwhile, traders who operate on certainties?
They get blindsided, frustrated, and emotional every time the market doesn’t do exactly what they expected.
👉 Trading scenarios = trading professionally.
👉 Trading certainties = gambling with emotions.
Plan your scenarios, manage your risk, and stay calm. That's the trader's way. 🚀

Russia-Ukraine Peace Agreement what could it mean to forex!A peace agreement between Russia and Ukraine could send ripples through the Forex and Commodities markets. Here's how major assets might react:
📊 Key Market Shifts to Watch:
✅ Risk-On Sentiment Returns
Traders may rotate out of safe havens like USD, JPY, CHF, and Gold.
Risk currencies like AUD, NZD, and emerging market currencies could strengthen.
✅ Euro Strength Likely (EUR ↑)
Europe gains the most relief → energy prices fall, inflation cools, confidence grows.
✅ Oil & Energy Prices May Drop
Peace reduces supply fears → crude oil and gas prices could fall → impacting CAD, NOK, RUB.
🔀 Likely Forex Movements:
🔼 Pairs Likely to Rise 💡 Reason
EUR/USD Euro up on peace; USD weakens as fear fades.
AUD/JPY Aussie rises on risk appetite; Yen weakens.
EUR/JPY Similar to AUD/JPY—EUR gains, JPY loses.
NZD/JPY Risk-on favors NZD; JPY drops.
EUR/CHF Swiss Franc weakens; Euro benefits.
USD/ZAR (falls) Rand strengthens on global optimism.
🔽 Pairs Likely to Fall 💡 Reason
USD/JPY USD and JPY both weaken, but USD may drop more.
USD/CHF Same story—less demand for safe havens.
USD/RUB Ruble recovery if sanctions ease.
CAD/JPY Oil-sensitive CAD may dip slightly
🟡 What About Commodities Like Gold? (XAU/USD)
⬇️ Gold Likely to Fall
As a traditional safe-haven, Gold (XAU/USD) tends to rise during geopolitical turmoil.
Peace = lower fear = investors rotate out of Gold into riskier, yield-bearing assets.
Lower inflation expectations could also reduce demand for Gold as an inflation hedge.
🧠 Key Level Watch:
If peace is confirmed, XAU/USD could drop below key support zones, especially if USD strengthens slightly on rate differentials.
🔍 Final Thoughts:
The magnitude of these moves depends on the terms and credibility of the peace deal.
If it includes sanctions relief and long-term commitments, expect larger market reactions.
Stay alert for central bank policy shifts, especially if inflation drops.
💬 What pairs or commodities are you watching if peace becomes a reality? Drop your insights below!
📌 Follow me for more macro-FX breakdowns, commodities analysis, and trading insights.

Why I Deal With Losses Before They Even Appear📉 Mastering the mindset that most traders avoid
There’s a moment that happens in every trader’s journey — not during a win, but during a loss.
A frozen moment where your mind screams, “It shouldn’t have gone this way!”
You look at the screen, your stop is hit, your equity drops, and your brain starts the negotiation:
“What if I held a bit longer?”
“Maybe the stop was too tight.”
“I need to make this back. Now.”
But the problem didn’t start with that loss.
It started long before you placed the trade.
________________________________________
💡 The Biggest Lie in Trading: “I’ll Deal With It When It Happens”
Too many traders operate from a place of reactivity.
They focus on the chart, the breakout, the “R:R,” the indicator... but they forget the only thing that actually matters:
❗️ What if this trade fails — and how will I handle it?
That’s not a pessimistic question.
It’s the most professional one you can ask.
If you only accept the possibility of a loss after the loss happens, it’s too late.
You’ve already sabotaged yourself emotionally — and probably financially, too.
So here's the core principle I apply every single day:
________________________________________
🔒 I Accept the Loss Before I Enter
Before I click "Buy" or "Sell," I already know:
✅ What my stop is.
✅ How much that stop means in money.
✅ That I am 100% okay losing that amount.
If any of those don’t align, the trade is dead before it begins.
This is not negotiable.
________________________________________
🚫 Don’t Touch the Stop. Touch the Volume.
One of the biggest mistakes I see — and I’ve done it too, early on — is this:
You find a clean technical setup. Let’s say the proper stop is 120 pips away.
You feel it’s too wide. You want to tighten it to 40. Why?
Not because the market structure says so — but because your ego can’t handle the potential loss.
❌ That’s not trading. That’s emotional budgeting.
Instead, keep the stop where it technically makes sense.
Then reduce the volume until the potential loss — in money, not pips — is emotionally tolerable.
We trade capital, not distance.
________________________________________
🧠 This Is the Only Risk Model That Makes Sense
Your strategy doesn’t need to win every time.
It just needs to keep you in the game long enough to let the edge play out.
If your risk is too big for your mental tolerance, it’s not sustainable.
And if it’s not sustainable, it’s not professional trading.
The goal isn’t to be right. The goal is to survive long enough to be consistent.
________________________________________
📋 My Framework: How I Deal with Losses Before They Show Up
Here’s my mental checklist for every trade:
1. Accept the loss before entering.
If I’m not okay losing X, I reduce the volume or skip the trade.
2. Set the stop based on structure, not comfort.
If the setup needs a 150-pip stop, so be it. It’s not about feelings.
3. Adjust volume to match my comfort zone.
I never trade “big” just because a setup looks “great.” Ego has no place here.
4. View trades as part of a series.
I expect losses. I expect drawdowns. One trade means nothing.
5. Be willing to exit early if the story changes.
If price invalidates the idea before the stop is hit (or the target), I’m gone.
________________________________________
🧘♂️ If You Can’t Sleep With the Trade, You’re Doing It Wrong
Peace of mind is underrated.
If a trade is making you anxious — not because it’s near SL, but because it’s threatening your sense of control — something is off.
And that something is usually your risk size.
Professional trading isn’t built on adrenaline.
It’s built on calm decisions, repeated for years.
________________________________________
🏁 Final Thoughts: Profit is Optional. Loss Management is Mandatory.
If you want to become consistent, start every trade with a simple, brutally honest question:
“Can I lose this money and still feel calm, focused, and in control?”
If the answer is no, you’re not ready for the trade — no matter how good the chart looks.
Profit is a possibility.
Loss is a certainty.
Master the certainty. The rest will follow.
🚀 Keep learning, keep growing.
Best of luck!
Mihai Iacob

Why All You Need Is the Chart: Let the Market Speak FirstYou missed the news? Doesn’t matter. The chart already heard it for you.
________________________________________
1. The Myth of Being “Informed”
Modern traders feel pressured to be constantly plugged in:
• Twitter alerts
• Trump’s latest outburst
• CNBC headlines
It feels like you’re missing out if you’re not watching everything.
But here’s the truth:
By the time you read the news, the market already priced it in.
Being "informed" doesn’t make you early . It usually makes you late .
________________________________________
2. The Chart Already Knows
Imagine a bullish surprise in the economy. You didn’t catch it live.
But when you open your chart, you see this:
📈 A bullish engulfing candle bouncing cleanly off major support.
That’s all you need. That’s your trade. You don’t need to know why it happened.
The chart speaks last. And the chart speaks loudest.
________________________________________
3. Price Is the Final Judge
All the noise — opinions, reports, breaking headlines — flows into a single output: price.
• Economic collapse? The chart shows a break.
• Political turmoil? Price still rejects resistance.
Price is truth.
Instead of asking: " What happened? ", start asking: " What is price doing? "
________________________________________
4. Real-Life Analogy
You don’t need to read the newspaper to know it’s raining. Just look out the window. 🌧️
Same with trading. Just look at the chart.
The price is your weather forecast. React to that. Not to noise.
________________________________________
5. What to Do Instead of Watching News:
• Draw clean support/resistance levels
• Wait for real confirmation (engulfings, breakouts, rejections)
• Manage risk — always
• Be patient. Let the market show its hand
________________________________________
Final Thought:
If something important happened, you’ll see it on the chart. You don’t need 10 sources. You don’t need speed. You need clarity.
Let the chart speak. It knows more than the news ever will.

Educational Video: How Technical Analysis worksThe chart is explained in the video and we can see how you can get an Alpha over the market by knowing when to invest in a stock. Selecting fundamentally strong company is very important but why investing in a Fundamentally strong company when it has a technical breakout can give you a better yield on your investment is explained in the video.
Disclaimer: This is not a recommendation to buy Tata Consumer Product stock but we are using it as an illustration to understand what Technical analysis is and how it works.
The above information is provided for educational purpose, analysis and paper trading only. Please don't treat this as a buy or sell recommendation for the stock or index. The Techno-Funda analysis is based on data that is more than 3 months old. Supports and Resistances are determined by historic past peaks and Valley in the chart. Many other indicators and patterns like EMA, RSI, MACD, Volumes, Fibonacci, parallel channel etc. use historic data which is 3 months or older cyclical points. There is no guarantee they will work in future as markets are highly volatile and swings in prices are also due to macro and micro factors based on actions taken by the company as well as region and global events. Equity investment is subject to risks. I or my clients or family members might have positions in the stocks that we mention in our educational posts. We will not be responsible for any Profit or loss that may occur due to any financial decision taken based on any data provided in this message. Do consult your investment advisor before taking any financial decisions. Stop losses should be an important part of any investment in equity.

No Setup, No Trade: Staying Sane in Gold’s MadnessToday, Gold hit $3500.
And while that may not sound like a shock on its own, what is unprecedented is the fact that in the past 10 days, Gold has climbed 5,000 pips.
That's not a normal rally.
That’s a vertical explosion.
And yes — it is looking “overextended”, but so it dit at 3300...
But then it went up another 2000 pips.
Will it drop? Probably — and hard.
When? No one knows.
Will it rise another 2000 pips before that?
Again, no one knows.
This is where most traders lose themselves — not because they don’t have tools, but because they pretend to know what’s unknowable.
________________________________________
🎯 The Strongest Skill: Admit When You Don’t Know
Every trader wants clarity.
But real professionals know when they’ve entered the fog.
The market is not obligated to give you structure just because you want to trade.
And the worst trades often happen when:
• You think it's overbought (but it keeps going)
• You think it’s due for a correction (but it doesn't care)
• You think it can't go higher (but it does)
This isn’t analysis — it’s wishful thinking.
________________________________________
🧠 Do You Actually Have Edge? Ask Yourself:
1. Do I see a structured setup, or just a reaction to “how far it’s gone”?
2. Can I define my entry, stop, and exit in advance?
3. Am I trading because I have a plan — or because it feels like a top (or simply have nothing better to do)?
If you can’t answer these — you don’t have edge.
You’re just guessing with conviction.
________________________________________
✅ The Only Thing That Matters: A Valid Trade
If you’re going to trade this madness, make sure your trade is:
• Planned (with defined risk)
• Repeatable (not emotional)
• Based on structure or volatility patterns
Otherwise, it’s just ego vs. market.
And the market always wins that fight.
________________________________________
🧘♂️ Final Thought: When Things Get Wild, Stay Sane
There’s no shame in stepping aside when things make no sense.
In fact, that’s where the real skill begins.
“Knowing when you don’t know isn’t weakness — it’s your strongest edge.”
So take a breath.
Zoom out.
And wait for the moment when you actually know what you're doing — not just think you do.
________________________________________
And remember:
No setup, no trade. No clarity, no risk. No ego, no drama.
Disclosure: I am part of Trade Nation's Influencer program and receive a monthly fee for using their TradingView charts in my analyses and educational articles.

The Truth About 2nd Retests in Forex, Stocks, and Crypto"Structure protects the trader from their own emotions."
This post is for those traders out there who have been second-guessing themselves when the market pulls back. If you're noticing second retests more frequently in Forex compared to stocks and crypto, you're not imagining things. Let me break it down from experience and research.
🔄 2nd Retests: What Are They?
The "2nd retest" refers to when price:
Breaks through a key level
Pulls back to that level
Then comes back again to retest that zone before the real trend unfolds
💱 Forex: Where Retests Move Fast
Forex has high liquidity and volume. When a level is broken, you often get a quick pullback, then a second retest -- sometimes in the same session. It's common to catch a good entry, see profit, then watch price reverse, hit the zone again, and consolidate with a W or M formation.
This is where most traders start to doubt themselves.
But if you're reading structure and candles properly, you're not wrong -- you're just early.
Remember: Forex is designed to shake you out with speed.
📊 Stocks: Slower and Sentiment-Driven
Stocks don’t move like Forex. They’re based more on fundamentals, earnings, and market sentiment.
2nd retests happen, but they play out over days or weeks
You often see consolidation ranges instead of clean pullback entries
That means unless you’re patient or watching higher time frames, you’ll miss it or get caught in sideways chop.
💿 Crypto: The Middle Ground
Crypto behaves like Forex, but slower. Patterns like W and M retests still appear – but it takes more time. The liquidity isn’t as deep, and reactions are more volatile.
You need strong discipline
You need to trust your zones
Don’t expect instant gratification
🧠 My Strategy: Multi-Timeframe Surfing
I personally surf between multiple timeframes to track how the candle looks and behaves:
Lower timeframes = Reaction + Entry Zones
Higher timeframes = Intent + Trend Bias
When I catch the first breakout and get into profit, I don’t panic if the 2nd retest comes.
I look for structure -- not emotion.
If you're unaware of the candle you're trading on, you'll always feel lost in the retracement.
So instead of jumping ship, I wait. I watch the new candle form. I know where I'm at in the story. That's what keeps me in the trade and out of my feelings.
🔹 Final Takeaway:
Whether you're trading Forex, Crypto, or Stocks — the market always leaves clues.
But you need:
A solid grasp of structure
Understanding of candle behavior
Patience to let the 2nd retest show its true intent
Stay sharp. Stay grounded. Trust the chart — not the chatter.
Let me know your thoughts below. How often do YOU see these 2nd retests in your trading?

12 Tips Every New Forex Trader Should Know!New to Forex? These 12 tips will save you months of frustration.
Forex trading can be overwhelming in the beginning, but it doesn’t have to be. Whether you're just starting out or still finding your feet, these tips are designed to help you avoid common mistakes and fast-track your learning curve.
✅ Save this post
✅ Follow for more Forex insights
✅ Drop a comment with your biggest struggle as a beginner, I might turn it into the next tip!
Let’s grow together. 📈💪

There's a Time to Trade and a Time to Watch Lately, the market has been in chaos – indices are dropping like there’s no tomorrow, and when it comes to Gold, what used to be a normal fluctuation of 100 pips has now turned into a 500-pip swing. In such a volatile environment, many traders feel compelled to be constantly active, believing that more trades mean more profit. But the truth is, there’s a time to trade and a time to watch.
Conservation of Capital is Essential 💰
The best traders understand that their capital is their lifeline. It’s not about making trades; it’s about making the right trades.
The market doesn’t reward effort; it rewards patience and precision.
Instead of jumping into mediocre setups, learn to appreciate the value of patience .
Every time you enter a trade that doesn’t meet your criteria, you risk your capital unnecessarily. And every loss chips away at your ability to capitalize on the real opportunities when they come. Capital preservation should be your priority.
Focus Only on A+ Signals 📌
Not every setup is worth your time and money. The goal should be to only enter positions that offer a clear edge – signals that you’ve identified as high-probability opportunities through your experience and strategy.
A + setups are those that offer:
• A clear technical pattern or setup you've mastered.
• A favorable risk-to-reward ratio, ideally 3:1 or better.
• Alignment with your overall strategy and market context.
If these criteria aren't met, it’s often better to do nothing. Waiting for the right setup and market conditions is part of the game.
The Power of Doing Nothing 🤫
Inaction is a skill. It requires discipline to avoid the urge to "force" trades. But the market will always be there tomorrow , and so will the opportunities.
By learning to watch rather than trade during uncertain or suboptimal conditions, you avoid unnecessary losses and conserve your capital for when the market truly presents an edge.
Conclusion 🚀
Trading is about quality, not quantity. Respect your capital and recognize that sometimes, the smartest move is to wait. Let the market be clear.
Remember, there’s a time to trade and a time to watch. Master this balance, and you’ll be miles ahead of most traders.

Tariffs Didn’t Cause the Correction — It Was Coming Anyway🚩 Intro: Markets Correct — They Don’t Need Permission
Every time the market drops hard, the headlines rush in to explain it. This time, it was President Trump’s dramatic tariff announcement on April 2nd. The media called it a shock.
I didn’t.
I’ve been calling for S&P 500 to drop to 5,200, and NASDAQ-100 to 17,500, since early January.
Not because I predicted tariffs. But because the charts told the story.
The market didn’t fall because of politics — it fell because it had to.
________________________________________
🔥 The Spark: Trump’s “Liberation Day” Tariffs
On April 2, 2025, Trump rolled out an aggressive trade agenda:
• 10% blanket tariff on all imports
• Up to 54% tariffs on Chinese goods
• 25% tariffs on imported cars and parts
• With limited exemptions for USMCA-aligned countries
Markets reacted instantly:
• S&P 500 dropped 4.8% — worst day since 2020
• NASDAQ-100 plunged over 6%
• Tech mega caps lost 5–14% in a day
Sounds like cause and effect, right?
Wrong.
________________________________________
🧠 The Real Cause: A Market That Was Ready to Fall
Let’s talk technicals:
• S&P 500 had printed a textbook double top at the 6100–6150 zone
• NASDAQ-100 had formed a rising wedge, with volume divergence and momentum fading
• RSI divergence was in place since February
• MACD had crossed bearish and also deverging
• Breadth was weakening while indices were still pushing highs
• Sentiment was euphoric, volatility crushed — a classic setup
You didn’t need to guess the news. The structure was screaming reversal.
SP500 CHART:
NASDAQ CHART:
________________________________________
🧩 Why Tariffs Made a Convenient Narrative
Markets love clean stories. And Trump’s tariffs offered everything:
• Emotional trigger
• Economic fear factor
• Political drama
• Global implications
But smart traders know better: markets correct based on positioning, not politics.
As soon as the wedge broke on NAS100 and SPX broke the double top's neck line the path was clear — risk off.
________________________________________
📉 I Was Calling This Since Q1
The targets were public:
SPX = 5,200. NAS100 = 17,500.
And the logic was simple:
• Overextension in AI-led tech
• Complacent VIX environment
• Crowded long positioning
• Bearish divergences and fading momentum
Double Top and Rising Wedge on SPX and Nas100
We didn’t need a reason to drop. The market had been levitating without support. All we needed was a trigger — and we got one.
________________________________________
🧭 Lesson: Trade the Structure, Not the Story
Here’s what I hope you take away:
✅ Setups come first. News comes later.
✅ If it wasn’t tariffs, it would’ve been CPI, earnings, Fed minutes, or a bird on a wire
✅ Don’t chase headlines. Anticipate setups.
The best trades aren’t reactive. They’re built on structure, sentiment, and timing — not waiting for CNBC to tell them what’s happening.
________________________________________
🔚 Conclusion: It Was Never About Tariffs
Tariffs were the match.
But the market was already soaked in gasoline.
This correction was technical, predictable, and clean.
📝 Post Scriptum — The Setup Shapes the Narrative
Let me be clear:
I’m not a Trump fan. Hoho — not by far.
But I’ll swear this on any chart:
If the setup had been the opposite — double bottom, falling wedge, positive divergences, and improving momentum — these exact same tariffs would’ve been interpreted as “bold leadership,” “pro-growth protectionism,” or “markets pricing in a stronger America.”
That’s how it works.
Price action leads. Narrative follows.
When structure is bullish, traders celebrate even bad news.
When structure is bearish, even good news becomes a reason to sell.
So no — it wasn’t about Trump. It never is. It’s about where the market wants to go. The rest is storytelling.
Disclosure: I am part of Trade Nation's Influencer program and receive a monthly fee for using their TradingView charts in my analyses and educational articles.

FXAN & Heikin Ashi TradeOANDA:AUDCHF
In this video, I’ll be sharing my analysis of AUDCHF, using FXAN's proprietary algo indicators with my unique Heikin Ashi strategy. I’ll walk you through the reasoning behind my trade setup and highlight key areas where I’m anticipating potential opportunities.
I’m always happy to receive any feedback.
Like, share and comment! ❤️
Thank you for watching my videos! 🙏

Understanding Market Downturns: How to Navigate the StormLately, the markets have been in a downtrend, leaving many traders and investors wondering what comes next. Whether it’s stocks, crypto, or other financial assets, downturns are an inevitable part of the game. While they can be unsettling, they also present opportunities—if you know how to navigate them.
Market declines happen for many reasons: economic slowdowns, geopolitical tensions, changes in interest rates, or even shifts in investor sentiment. Regardless of the cause, understanding the different types of market downturns, their impact, and the right strategies to handle them is key to making informed decisions.
So, let’s break down market downturns, how they unfold, and what you can do to stay ahead.
📊 DOWNTURN #1: Down -2% — A Ripple of Volatility
A -2% drop is like a minor speed bump—annoying but not alarming. These small dips are common and often part of natural market fluctuations.
✅ Key Characteristics:
• Typically short-lived and often recovers quickly.
• Can be triggered by minor news events, investor sentiment shifts, or profit-taking.
• Provides opportunities to enter positions at a slightly better price.
💡 Strategy:
• If you're a long-term investor, ignore these small movements. They are normal.
• If you're a trader, these dips can be buying opportunities in an uptrend.
________________________________________
🔄 DOWNTURN #2: Down -5% — The Pullback Perspective
A 5% decline is often called a pullback—a temporary market retreat within an ongoing trend.
✅ Key Characteristics:
• Pullbacks often occur after strong rallies as the market cools off.
• Typically seen as healthy corrections in an overall uptrend.
• Not necessarily a signal of long-term weakness.
💡 Strategy:
• Long-term investors should hold steady and potentially add to positions.
• Swing traders may look for a bounce at key support levels (moving averages, previous highs/lows).
________________________________________
🛑 DOWNTURN #3: Down -10% — Entering Correction Territory
When a market drops 10% from its recent high, it officially enters correction territory.
✅ Key Characteristics:
• Often caused by changes in economic outlook, inflation concerns, or major geopolitical events.
• Moving averages may start crossing downward, signaling caution.
• Momentum shifts, and bearish traders begin to take control.
💡 Strategy:
• If you’re a long-term investor, consider rebalancing your portfolio or hedging with defensive assets.
• Traders may look for short opportunities or play reversals at support levels.
• Be cautious with leverage—downturns can accelerate quickly.
________________________________________
🐻 DOWNTURN #4: Down -20% — The Bear Market Looms
A 20% drop or more marks a bear market, signaling a significant shift in market sentiment.
✅ Key Characteristics:
• Confidence is shaken; investors turn risk-averse.
• Defensive sectors (utilities, consumer staples, healthcare) tend to outperform.
• Market psychology shifts from "buying the dip" to "protecting capital."
💡 Strategy:
• Consider defensive positions, hedging strategies, or increasing cash reserves.
• Avoid high-risk assets—stocks with weak fundamentals often fall the hardest.
• If you’re a trader, look for short-selling opportunities or inverse ETFs.
________________________________________
⚠️ DOWNTURN #5: Down -50% — The Market Crash Crisis
A 50% market decline is rare but catastrophic, often fueled by deep economic crises.
Historical Examples:
• 2008 Financial Crisis: Banks collapsed, and global markets fell over 50%.
• Dot-Com Bubble (2000): Tech stocks crashed after unsustainable hype.
• Oil Crisis (1973-74): Economic stagnation and inflation led to severe losses.
✅ Key Characteristics:
• Panic selling dominates the market.
• Fear-driven liquidation leads to extreme undervaluation.
• Long-term recovery often follows—but timing is uncertain.
💡 Strategy:
• If you have cash reserves, these moments present once-in-a-decade buying opportunities (but patience is needed).
• Dollar-cost averaging (DCA) can be effective for long-term investors.
• Traders should expect extreme volatility—both to the downside and in sharp relief rallies.
________________________________________
🌧️ DOWNTURN #6: Prolonged Downside — The Economic Depression
Unlike a crash, a depression is a long-term, sustained downturn that deeply affects the economy.
✅ Key Characteristics:
• Prolonged recession, lasting years rather than months.
• Unemployment soars, economic activity collapses.
• Investor confidence remains low for an extended period.
Historical Example: The Great Depression (1930s)
• U.S. unemployment hit 25%.
• Stock markets stayed depressed for a decade.
• Industrial production and wages plummeted.
💡 Strategy:
• Preservation of capital is key—cash, gold, and defensive assets become crucial.
• Income-producing investments (dividend stocks, bonds) provide stability.
• Patience is essential; full recovery can take years.
________________________________________
🧭 Conclusion: Navigating Market Downturns Like a Pro
Downturns are an inevitable part of investing and trading. While they can be unsettling, being informed and prepared is the key to staying ahead.
✅ Key Takeaways:
• Minor dips (-2% to -5%) are normal and often present opportunities.
• Corrections (-10%) require caution, but markets usually recover.
• Bear markets (-20%) signal broader economic concerns—risk management is crucial.
• Crashes (-50%) are rare but can create massive buying opportunities for long-term investors.
• Depressions are the most severe and require a long-term, defensive approach.
No matter the downturn, the key is to stay calm, adjust your strategy, and use market cycles to your advantage.
With the right approach, you won’t just survive market downturns—you’ll thrive in the long run. 🚀
Starting over in trading- A short guideThe internet has made it easier than ever to learn trading for free. You have access to blogs, videos, books, podcasts, and more. Yet, most traders still fail.
Why?
Because there’s too much information. It’s overwhelming, confusing, and filled with conflicting advice.
So, if I had to start over from scratch, here’s exactly how I’d do it—step by step.
________________________________________
Step 1: Master Risk Management
No matter what type of trader you become—day trader, swing trader, options trader, quantitative trader, etc.—risk management is the foundation of long-term success.
It’s also one of the easiest things to master, and once you do, it will pay off for the rest of your trading career.
Risk Management Essentials:
✅ Never risk more than 1-2% of your account per trade.
✅ Always use stop losses to protect your capital.
✅ Focus on risk-to-reward ratios (aim for at least 1:2 or better).
✅ Manage position sizing properly to avoid blowing up your account.
Once you understand how to protect your capital, it’s time to expose yourself to the trading world.
________________________________________
Step 2: Learn & Explore Different Trading Styles
When you're just starting, you don’t know what you don’t know.
Your goal at this stage is to explore different trading strategies, tools, and methods.
What to Learn:
🔹 Candlestick patterns & price action
🔹 Indicators (moving averages, RSI , MACD , etc.)
🔹 Chart patterns (head & shoulders, triangles, etc.)
🔹 Market structures (support/resistance, trends, ranges)
🔹 Different trading styles (day trading, swing trading, scalping, momentum trading, etc.)
Mindset for This Phase:
🚀 Keep an open mind—don’t judge strategies too early.
🚀 Focus on learning rather than making money right away.
🚀 Accept that not everything will work for you—and that’s okay.
At this stage, your goal is not to become an expert in everything but to discover what resonates with you.
________________________________________
Step 3: Pick ONE Strategy & Go Deep
After exploring different strategies, you need to commit to ONE.
This eliminates information overload and allows you to focus on mastering a single trading method.
How to Choose a Strategy:
🔹 Does it fit your personality? (e.g., If you hate fast decision-making, avoid scalping.)
🔹 Does it match your lifestyle? (e.g., If you have a full-time job, swing trading might be better than day trading.)
🔹 Can you understand the logic behind it? (A good strategy should be simple, not overly complicated.)
Example: Mean Reversion Strategy in Stocks
• Identify stocks in an uptrend 📈
• Wait for a pullback (price moves lower)
• Enter when the stock shows signs of resuming the trend
• Sell on the next rally
By focusing on one strategy, you eliminate confusion and make faster progress.
________________________________________
Step 4: Create & Refine Your Trading Plan
Now that you have a strategy, it’s time to turn it into a structured trading plan.
Your trading plan should include:
✅ Market Conditions – When will you trade? Trending or ranging markets?
✅ Entry Rules – What signals will you use to enter a trade?
✅ Exit Rules – When will you take profits or cut losses?
✅ Risk Management – How much will you risk per trade?
💡 Example Trading Plan (Momentum Trading):
• Market: Trade only in strong uptrends.
• Entry: Buy when the price breaks above a key resistance level.
• Exit: Take profit at 2x risk, cut losses at a 1x risk.
• Risk Management: Risk only 1% of the account per trade.
A clear, structured plan removes emotion from trading and keeps you disciplined.
________________________________________
Step 5: Test Your Strategy (Before Risking Real Money)
You never know if a strategy works until you test it.
How to Test a Trading Strategy:
🔹 Backtesting – Analyze past data to see if the strategy has worked historically.
🔹 Forward Testing (Paper Trading) – Trade in a demo account without real money.
What You’ll Learn from Testing:
✔️ Does the strategy make money over time?
✔️ How often does it win vs. lose?
✔️ How big are the drawdowns?
✔️ Does it match your risk tolerance?
If the strategy performs well in testing, you now have a solid foundation to trade with real money.
If it doesn’t work, tweak and improve it—this is part of the process.
________________________________________
Final Thoughts: The Key to Long-Term Success
Starting over isn’t about finding the “perfect” system —it’s about following a structured approach.
Here’s the Path to Trading Success:
1️⃣ Master Risk Management – Protect your capital first.
2️⃣ Learn & Explore – Understand different strategies & tools.
3️⃣ Pick ONE Strategy – Focus on a proven method.
4️⃣ Create a Trading Plan – Define your rules clearly.
5️⃣ Test & Improve – Validate your strategy before going live.
🔥 Bonus Tip: Trading success is 80% psychology and 20% strategy. Stay patient, disciplined, and treat trading like a business—not a get-rich-quick scheme.

How to Choose the Right Leverage in Trading: What Metters?One of the most common questions I get from beginner traders is: What leverage should I use ?
And every time, my answer is the same: The leverage offered by the broker is irrelevant. What truly matters is the position size you control in the market.
Understanding Leverage in Trading
Leverage is a tool that allows you to control a larger amount of money in the market than you actually have in your account. Brokers regulated in the U.S., EU, or Australia limit leverage to 1:30, but in other jurisdictions, these restrictions do not apply, and brokers may offer leverage of 1:200 or even higher.
What does this mean? Let’s take a concrete example:
• You have an account with $1,000.
• Your broker offers 1:200 leverage.
• This means you can control $200,000 in the market.
Although this may sound tempting, you must understand that your profit and loss are calculated based on the amount controlled, not your initial capital.
The Real Risk of High Leverage
Let’s assume you open a position using the full leverage available and control $200,000 in the market.
• If the market moves 100 pips against you, your loss is $2,000.
• Your $1,000 account is completely wiped out in just 50 pips of adverse movement.
In other words, high leverage can quickly take you out of the game if you do not manage your risk properly.
How to Trade Safely
If you have an account of $1,000, it is recommended to control much smaller amounts in the market to reduce risk.
A safer approach would be:
• To control $5,000, meaning you open a position of 0.05 lots.
• If you have a higher risk appetite, a maximum of 0.1 lots, which means you control $10,000 in the market.
This way, a 100-pip movement against you will not completely wipe out your account, giving you a better chance to manage risk and learn from experience.
Conclusion
The leverage offered by the broker does not matter; what matters is the position size you open. Set an appropriate risk level for your account and do not be tempted by high leverage offered by brokers. Survival in trading depends on proper risk management, not on how big you can bet on each trade.

US Cash Market Goes 'Flippant'. Understanding Revenge in TradingFirst of all, revenge trading is a destructive pattern of behavior in trading where individuals make impulsive and emotionally-driven decisions in an attempt to recoup previous losses. This practice is not limited to novice traders; even experienced traders can fall prey to it. The primary emotions driving revenge trading include anger, frustration, greed, fear, and shame, which cloud judgment and lead to irrational decision-making.
Causes of Revenge Trading
Emotional Response: Traders often react emotionally to significant losses, feeling compelled to immediately recover their losses without adequate analysis or strategy.
Lack of Discipline: Deviating from established trading plans and risk management principles is common in revenge trading.
Psychological Triggers: Feelings of injustice, anger, or a desire for vengeance against the market can trigger revenge trading.
Consequences of Revenge Trading
Financial Losses: Revenge trading often results in larger losses due to riskier trades and poor timing.
Emotional Burnout: The stress and frustration from repeated losses can lead to emotional exhaustion and decreased trading performance.
Career Impact: Persistent revenge trading can erode confidence and lead to a trader questioning their abilities.
Real-Life Examples of Revenge Trading
Increasing Position Size: A trader experiences a significant loss and decides to double or triple their position size in the next trade, hoping to quickly recover their losses. This action disregards risk management principles and often leads to even greater losses.
Ignoring Stop-Loss Orders: After a loss, a trader might hold onto a losing position longer than planned, hoping it will turn around. This behavior ignores established stop-loss orders and can result in further financial damage.
Chasing Trades: A trader feels compelled to enter trades without proper analysis, driven by the urge to recoup losses quickly. This impulsive behavior can lead to a series of poor trading decisions.
Market Reversal Scenario: A trader suffers a loss due to a sudden market reversal. In an attempt to recover, they enter a trade in the opposite direction without thorough analysis, which can exacerbate their losses.
Wish more examples? Watch recent one below 👇👇
How to Avoid Revenge Trading
To avoid revenge trading, traders should focus on maintaining discipline and adhering to their trading strategies. This includes:
Taking Breaks: After a loss, taking time to reassess the market and calm emotions can help prevent impulsive decisions.
Sticking to Plans: Adhering to established trading plans and risk management principles is crucial.
Emotional Awareness: Recognizing emotional triggers and taking steps to manage them can help prevent revenge trading.
In conclusion, revenge trading is a HARMFUL AND DANGEROUS practice that can lead to significant financial and emotional consequences. Understanding its causes and recognizing its signs are essential steps in avoiding this behavior and maintaining a successful trading career.
--
Best wishes,
@PandorraResearch Team 😎

Trading Miscalibration: Crypto Aims Too High, FX Aims Too LowI was thinking about something fascinating—the way traders approach different markets and, in my opinion...
One of the biggest mistakes traders make is failing to calibrate their expectations based on the market they’re trading.
📌 In crypto, traders dream of 100x gains, refusing to take profits on a 30-50% move because they believe their coin is going to the moon.
📌 In Forex and gold, the same traders shrink their expectations, chasing 20-30 pip moves instead of riding 200-500 pip trends.
Ironically, both approaches lead to frustration:
🔴 Crypto traders regret not taking profits when the market crashes.
🔴 FX and gold traders regret not holding longer when the market runs without them.
If you want to be a profitable trader, you must align your strategy with the reality of the market you’re trading.
________________________________________
Crypto: Stop Aiming for the Moon—Trade Realistic Outcomes
Crypto markets are highly volatile, and while 10x or 100x gains can happen, they are rare and unpredictable. However, many traders have been conditioned to expect extreme returns, leading them to ignore solid 30-50% gains—which are already fantastic trades in any market.
🔴 The Problem: Holding Too Long & Missing Profits
Many traders refuse to take profits on a 30-50% move, convinced that a 10x ride is around the corner. But when the market reverses, those unrealized gains disappear—sometimes turning into losses.
🚨 Frustration:
"I was up 50%, but I got greedy, and now I’m back to break-even—or worse!"
✅ The Fix: Take Profits at 30-50% Instead of Waiting for 10x
✔️ Take partial profits at key resistance levels.
✔️ Use a trailing stop to lock in gains while allowing for further upside.
✔️ Understand that even professional traders take profits when they’re available—they don’t blindly hold for the next 100x.
📉 Example:
If Bitcoin jumps 30% in a month, that’s already a massive move! Instead of waiting for 200%, a disciplined trader locks in profits along the way. Similarly, if an altcoin is up 50% in two weeks, securing profits makes sense—instead of watching it all disappear in a market dump.
________________________________________
FX and Gold: Stop Thinking Small—Aim for Big Market Trends
On the other hand, when it comes to Forex and gold, many traders shrink their expectations too much. Instead of capturing multi-hundred-pip moves, they settle for 20-30 pip scalps, constantly entering and exiting the market, exposing themselves to unnecessary whipsaws.
🔴 The Problem: Exiting Too Early & Missing Big Trends
Unlike crypto, where traders hold too long, in FX and gold, they don’t hold long enough. Instead of riding a 200-500 pip move, they panic-exit for a small profit, only to watch the market continue without them.
🚨 Frustration:
"I closed at 30 pips, but the market kept running for 300 pips! I left so much money on the table!"
✅ The Fix: Target 200-500 Pip Moves Instead of Scalping
✔️ Focus on higher timeframes (4H, daily) for clearer trends.
✔️ Set realistic yet ambitious targets —200-300 pips in Forex, 300-500 pips in gold.
✔️ Use a strong risk-reward ratio (1:2, 1:3, even 1:5) instead of taking premature profits.
📉 Example:
• If EUR/USD starts a strong downtrend, why settle for 30 pips when the pair could drop 250 pips in a week?
• If gold breaks a major resistance level, a move of 300-500 pips is entirely possible—but you won’t catch it if you exit at 50 pips.
________________________________________
Why Traders Fail to Calibrate Properly
So why do traders fall into this misalignment of expectations?
1️⃣ Social Media & Hype Culture – Crypto traders are bombarded with "to the moon" narratives, making them feel like 30-50% gains are not enough. Meanwhile, in Forex, traders get stuck in a scalping mindset, thinking that small, frequent wins are the only way to trade.
2️⃣ Fear of Missing Out (FOMO) vs. Fear of Losing Profits (FOLP)
• In crypto, FOMO keeps traders holding too long. They don’t want to miss "the big one," so they refuse to take profits.
• In FX and gold, fear of losing small profits makes traders exit too soon. They don’t let trades develop because they fear a pullback.
3️⃣ Misunderstanding Market Structure – Each market moves differently. Crypto is highly volatile but doesn’t always go 10x. Forex and gold move slower but offer consistent multi-hundred-pip trends. Many traders don’t adjust their strategies accordingly.
________________________________________
The Solution: Align Your Strategy with the Market
🔥 In crypto, don’t wait for 10x— start taking profits at 30-50%.
🔥 In FX and gold, don’t settle for 30 pips—hold for 200-500 pip moves.
By making this simple mental shift, you’ll:
✅ Trade smarter, not harder
✅ Increase profitability by targeting realistic moves
✅ Reduce stress and overtrading
________________________________________
Final Thoughts: No More Frustration!
The calibration problem leads to frustration in both cases:
⚠️ Crypto traders regret not taking profits when the market crashes.
⚠️ FX and gold traders regret not holding longer when the market trends.
💡 The solution? Trade according to the market's behavior, not emotions.

Stop chasing 20-30 pips if you want to become profitableOne of the biggest obstacles for traders who want to become consistently profitable is the mindset of chasing small 20-30 pip moves.
While it may seem appealing to enter and exit trades quickly for immediate profits, this strategy is often inefficient, risky, and unsustainable in the long run. Here’s why you should change your approach if you want to succeed in trading.
________________________________________
1. Trading Costs Eat Into Your Profits
When you target small moves, you need to open and close many trades. This means that spreads and commissions will eat up a significant portion of your profits. If you have a spread of 2-3 pips (depending on the pair) and you’re only aiming for 20-30 pips per trade, a consistent percentage of your potential gains is lost to execution costs.
________________________________________
2. High Risk Compared to Reward
A smart trader focuses on a favorable risk-reward ratio, such as 1:2, 1:3 or even 1:4. When you chase just 20-30 pips, your stop-loss has to be very tight, making you highly vulnerable to the normal volatility of the market. An unexpected news release or a liquidity spike can stop you out before the price even reaches your target.
________________________________________
3. You Miss Big Moves and Real Opportunities
Professional traders focus on larger trends and significant price movements of hundreds of pips. The market doesn’t move in a straight line; it goes through consolidations, pullbacks, and major trends. If you’re busy trading short-term 20-30 pip moves, you’ll likely miss the big trends that offer more sustainable profits and better risk management.
________________________________________
4. Increased Stress and Emotional Trading
Short-term trading requires constant monitoring and quick decision-making. This increases your level of stress and negative emotions like fear and greed, leading to costly mistakes. In the long run, this trading style is mentally exhausting and difficult to sustain.
________________________________________
How to Change Your Approach to Become Profitable
✅ Think in terms of larger trends – Focus on 200-300+ pip moves instead of small fluctuations.
✅ Aim for a strong risk-reward ratio – Look for setups with at least 1:2 risk-reward to maximize your profits.
✅ Use higher timeframes – Charts like 4H or daily provide clearer signals and reduce market noise.
✅ Be patient and wait for the best setups – Don’t enter trades just for the sake of activity; wait for high-probability opportunities.

Mastering MACD- Complete Guide- 10 ways to trade itThe Moving Average Convergence Divergence (MACD) is a versatile indicator that can help traders navigate the markets with precision. From trend identification to momentum assessment, the MACD provides multiple actionable insights. In this educational post, we’ll explore the key ways to use MACD effectively, with an example illustration accompanying each strategy.
________________________________________
1. Signal Line Crossovers
The most common use of MACD is the signal line crossover, which identifies potential shifts in market momentum:
• Bullish Signal: When the MACD line (fast-moving) crosses above the signal line (slow-moving), it suggests upward momentum is increasing. This can be an entry signal for a long trade. Bullish crossovers often occur after a period of consolidation or a downtrend, signaling a reversal in market sentiment.
• Bearish Signal: When the MACD line crosses below the signal line, it signals downward momentum, often triggering a short-selling opportunity. Bearish crossovers can occur during retracements in an uptrend or at the start of a bearish reversal.
How to Use: Look for confirmation from price action or other indicators, such as a breakout above a resistance level for a bullish signal or a breakdown below support for a bearish signal. It's essential to avoid acting solely on a crossover; consider volume (stocks, crypto), candle stick formations and other market conditions.
Example: A bullish crossover on the daily chart on TRADENATION:XAUUSD indicates a potential buying opportunity as the price begins to rise. Add a stop-loss below recent lows to manage risk and look for a 1:2 risk:r eward in the next resistance.
________________________________________
2. Zero Line Crossovers
The MACD’s zero line acts as a boundary between bullish and bearish momentum, making it a valuable trend confirmation tool:
• Above Zero: When the MACD line moves above the zero line, it confirms an uptrend, as the fast-moving average is above the slow-moving average. Sustained movement above zero often indicates a strong bullish trend.
• Below Zero: A MACD line below zero reflects a downtrend, indicating bearish market conditions. Persistent movement below zero confirms bearish momentum.
How to Use: Use the zero line crossover to validate trades based on other signals, such as candlestick patterns or trendline breaks. The crossover can act as a second layer of confirmation for existing trade setups.
Example: MACD on a crypto pair crosses above the zero line, confirming the start of a new bullish trend. Traders can combine this with volume analysis to ensure strong market participation.
________________________________________
3. Histogram Analysis
The histogram represents the distance between the MACD line and the signal line, offering insights into momentum:
• Expanding Histogram: Indicates strengthening momentum in the direction of the trend. Larger bars show increasing dominance of bulls or bears.
• Contracting Histogram: Suggests weakening momentum, signaling a possible reversal or consolidation. Smaller bars indicate a loss of trend strength.
How to Use: Monitor the histogram for early signs of momentum shifts before a crossover occurs. The histogram can act as a leading indicator, providing advanced warning of potential changes in price direction.
Example: A shrinking histogram in a forex pair signals that the bullish momentum is losing steam, warning traders of a possible retracement. This can be a cue to tighten stop-loss levels or take partial profits. Conversely, an expanding histogram during a breakout confirms the strength of the move.
________________________________________
4. Identifying Divergences
MACD divergences are powerful tools for spotting potential reversals:
• Bullish Divergence: Occurs when the price makes a lower low, but the MACD forms a higher low, signaling weakening bearish momentum. This often precedes a trend reversal to the upside.
• Bearish Divergence: Happens when the price makes a higher high, but the MACD forms a lower high, indicating diminishing bullish strength. This suggests a potential reversal to the downside.
How to Use: Combine divergence signals with support or resistance levels to enhance reliability. Divergences are most effective when spotted at major turning points in the market.
Example: On a TRADENATION:EURUSD chart, a bearish divergence signals an upcoming price reversal from an up trend to a down trend.
________________________________________
5. Trend Confirmation
MACD confirms trends by staying consistently above or below the zero line:
• Above Zero: Indicates a strong uptrend. Look for pullbacks to enter long trades. The longer the MACD remains above zero, the stronger the trend.
• Below Zero: Reflects a persistent downtrend. Use rallies as opportunities to short. A sustained period below zero reinforces bearish dominance.
How to Use: Use MACD’s trend confirmation alongside other trend-following tools like moving averages or Ichimoku clouds. Ensure that market conditions align with the broader trend.
Example: Combining MACD trend confirmation with moving averages helps traders stay on the right side of the trend in a stock market index. For example, buy when both MACD and a 50-day moving average indicate an uptrend. Exit trades when the MACD begins to cross below zero or shows a divergence.
________________________________________
6. Overbought and Oversold Conditions
Although MACD is not traditionally an overbought/oversold indicator, extreme deviations between the MACD line and the signal line can hint at stretched market conditions:
• Overbought: When the MACD line is significantly above the signal line, it may indicate a price correction is imminent. This often occurs after an extended rally.
• Oversold: When the MACD line is well below the signal line, it suggests a potential rebound. Such conditions are common following sharp sell-offs.
How to Use: Monitor extreme readings in conjunction with oscillators like RSI for added confidence. Look for reversals near key support or resistance levels.
Example: An extended bearish move with a large MACD-signal line gap warns traders of a potential price correction. This can signal an opportunity to exit. Pair this observation with a bullish candlestick pattern to confirm the move (in this example morning star)
________________________________________
7. Combining MACD with Other Indicators
MACD works best when paired with complementary indicators to provide a more comprehensive market analysis:
• RSI (Relative Strength Index): Use RSI to confirm momentum and overbought/oversold conditions.
• Bollinger Bands: Validate price breakouts or consolidations with MACD signals.
• Support and Resistance: Use MACD signals around key levels for confluence.
How to Use: Wait for MACD signals to align with other indicator readings to improve accuracy. Cross-validation reduces false signals and increases confidence in trades.
Example: A bearish MACD crossover near a key resistance level reinforces a short-selling opportunity.
________________________________________
8. Multi-Timeframe Analysis
Using MACD across different timeframes strengthens trade signals and provides context:
• Higher Timeframe: Identify the broader trend to avoid trading against the market. For instance, if the daily chart shows a bullish MACD, focus on long trades in lower timeframes.
• Lower Timeframe: Pinpoint precise entries and exits within the higher timeframe’s trend. The MACD on lower timeframes can help fine-tune timing.
How to Use: Align MACD signals on both higher and lower timeframes to confirm trade setups. This alignment minimizes the risk of false signals.
________________________________________
9. Customizing MACD Settings
Traders can tailor MACD settings to suit different trading styles and timeframes:
• Shorter Periods: Provide more sensitive signals for scalping or day trading. Shorter settings react quickly to price changes but may generate more false signals.
• Longer Periods: Produce smoother signals for swing trading or position trading. Longer settings are less responsive but more reliable.
How to Use: Experiment with different settings on a demo account to find what works best for your strategy. Adjust settings based on the volatility and nature of the asset.
Example: A scalper uses a 5, 13, 6 MACD setting to capture quick momentum shifts in the market, while a swing trader sticks with the standard 12, 26, 9 for broader trends. Compare results across different markets to refine the approach.
________________________________________
10. Crossovers or Divergence at Key Levels
Combining MACD crossovers with price action levels enhances the reliability of trade signals:
• Horizontal Levels: Use MACD signals to confirm reversals or breakouts at support and resistance levels. Crossovers near these levels are often more reliable.
• Fibonacci Retracements: You can combine MACD with retracement levels to validate potential entries or exits. Confluence with retracements adds weight to the signal.
How to Use: Wait for MACD signals to align with key price levels for higher probability trades. Confirmation from candlestick patterns or volume (stock and crypto) adds further credibility.
Example: A bullish MACD divergence aligns with a strong support level, signaling a strong buy setup. Add confirmation with a candlestick reversal pattern, such as a piercing pattern in our case, to enhance precision.
________________________________________
Conclusion:
The MACD indicator’s flexibility makes it a must-have tool for traders of all styles. By mastering these strategies and integrating them in your trading, you can elevate your trading decisions.
Disclosure: I am part of Trade Nation's Influencer program and receive a monthly fee for using their TradingView charts in my analyses and educational articles.
