SMC Education - Sweep LQD Confirmation Entry !This Content is for Education Purpose only.!
Smart Money Concept (SWEEP LIQUIDITY & CLEAR CONFIRMATION ENTRY ) as I mentioned in the Chart.!
Keep Supporting LIKE, COMMENT And FOLLOW.!
Thank You.!
Educationalposts

Shorting AUD/USD on the basis of S&R !! #ShortShorting AUD/USD on the basis of S&R !!
This trade is for Educational Purpose only.
The Goal is to highlight the importance of Support & Resistance zones (S&R) and how can Weak and Strong zones be identified.
Support & Resistance (S&R) can play vital roles when it comes to trading. Most traders use S&R in order to look for precise entries and exits.
The Pair has been Bouncing off from zone Marked in Red which acted as Support earlier. The Support was tested four times.. Soon it was broken with strong Bearish Candle. The more touches/bounces the Support zone had, the weaker it got and as a result it got broken. Often time Support acts as Resistance zones and Vice versa . It is important to note that S&R can act as a strong Confluence but trading just on the basis of it alone can be dangerous. Using other Confluences such as Market Structure, Divergences and Chart Patterns such as Double Top/Bottom are equally important. Since Trading is the game of Probability, it is Essential to have more than One Confluence.
The Trade Plan:
The trade plan is to Short AUD/USD, once it re-tests the broken support zone which is now likely to Act as Resistance.
Note: Take this trade after doing on your own analysis.
Target:
Target is set on the basis of Fibonacci Re-tracement which comes in between 0.618 & 0.5.
Stop Loss:
Stop Loss is simply set on the basis of 1:3 Risk to Reward Ratio.
Time Frame used:
1H
Analysis based on:
- Market Structure
- Support & Resistance.
- Fibonacci Retracement tool .. used for setting Target

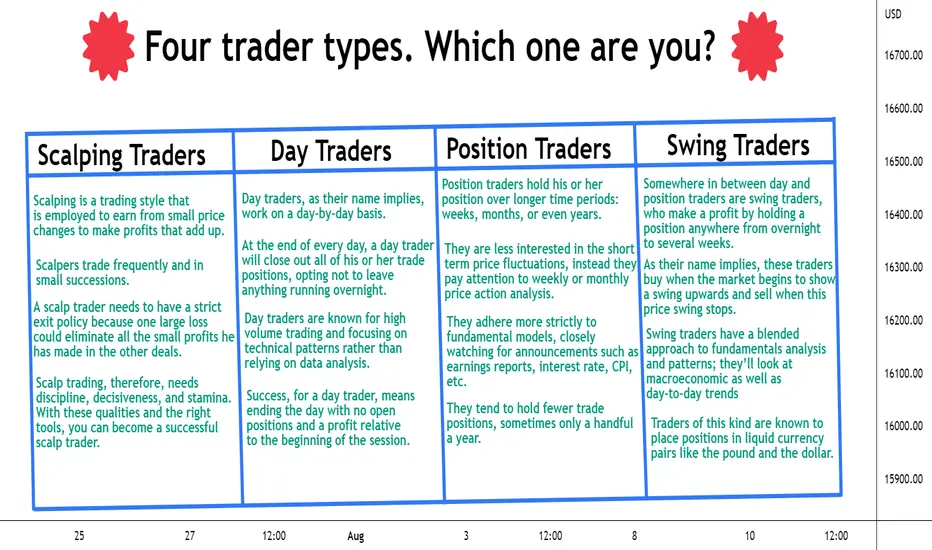
Four trader types. Which type are you?New traders are often confused which trading style to pursue. If you too have the same dilemma, this article is for you. It is imperative to pick a trading style that best suits your personality before you start navigating the market. Without a technique, you will get confused and may end up with huge losses. Your adopted style must depend on your financial goal, risk tolerance, time that you can invest daily to follow the market, and several other similar factors. So, you must learn about the different trading techniques to make an informed choice. In this article, we will discuss four trading styles. So, keep reading.
1. Scalping Traders
Scalping is a trading style that is employed to earn from small price changes to make profits that add up.
Scalpers trade frequently and in small successions.
A scalp trader needs to have a strict exit policy because one large loss could eliminate all the small profits he has made in the other deals.
Scalp trading, therefore, needs discipline, decisiveness, and stamina. With these qualities and the right tools, you can become a successful scalp trader.
2 Day Traders
Day traders, as their name implies, work on a day-by-day basis.
At the end of every day, a day trader will close out all of his or her trade positions, opting not to leave anything running overnight.
Day traders are known for high volume trading and focusing on technical patterns rather than relying on data analysis.
Success, for a day trader, means ending the day with no open positions and a profit relative to the beginning of the session.
3. Position Traders
Position traders hold his or her position over longer time periods: weeks, months, or even years.
They are less interested in the short term price fluctuations, instead they pay attention to weekly or monthly price action analysis.
They adhere more strictly to fundamental models, closely watching for announcements such as earnings reports, interest rate, CPI, etc.
They tend to hold fewer trade positions, sometimes only a handful a year.
4. Swing Traders
Somewhere in between day and position traders are swing traders, who make a profit by holding a position anywhere from overnight to several weeks.
As their name implies, these traders buy when the market begins to show a swing upwards and sell when this price swing stops.
Swing traders have a blended approach to fundamentals analysis and patterns; they’ll look at macroeconomic as well as day-to-day trends
Traders of this kind are known to place positions in liquid currency pairs like the pound and the dollar.
If you enjoyed reading this article please show your support with likes.
Comment below what trading style is best for you.
How to properly use Pivot Points in your tradingA flaw many traders have is the habit of seeking “certainty” via indicators. It’s not uncommon to see charts with 5-7 indicators overlaid on them. However, the traders that seek certainty through indicators are usually the same traders that don’t “dig deep” into the indicator to understand how it’s built.
Today we will “dig deep” into a very useful indicator that can generate significant reference points. This indicator is useful for pinpointing entry levels, stop loss levels, and profit targets.
Pivot Points: from pit to platform
A little-known fact is that Pivot Points originated differently to other indicators. Contrary to most technical indicators, they originated within trading pits of equity and futures exchanges. This pragmatic origin is perhaps the reason why Pivot Points remain one of the most useful indicators out there.
To properly understand Pivot Points, we need to explore how they are calculated.
Note that Pivot Points can be calculated for any time horizon. Traditionally, pivots were calculated based on daily data. However, within FX this might not be the best way to employ them. But more on this later. For now, let’s start by understanding how daily Pivot Points are calculated.
The Pivot Points formula
P = Central Pivot Point = (Previous Day High + Previous Day Low + Previous Day Close)/3
R1 = Central Pivot * 2 – Previous Day Low
S1 = Central Pivot * 2 – Previous Day High
R2 = Central Pivot – S1 + R1
S2 = Central Pivot – R1 – S1
R3 = Central Pivot – S2 + R2
S3 = Central Pivot – R2 – S2
Pivots can help you sell high and buy low
If there is one principle that most traders know but tend to neglect, it’s “buy low and sell high”. However, the concepts of “high” and “low” are relative and not absolute. With Pivot Points—along with their statistical edge—we can define high and low in a very robust way.
You know that the odds can be in your favour if you are a buyer at S1. If price rallies past the central pivot and reaches R1, you might want to take some risk off the table. This is because R1 is often the high for the day.
The same rationale goes for S2 and R2. If price exceeds S1 and reaches S2, the odds can be tilted in your favour. Buying at S2 with a target at R1 is another solid way to exploit the statistical edge of Pivot Points.
Adapting Pivots to the FX market structure
One key difference in FX that throws some people off-balance is that there isn’t a centralised market open and close. In reality, three main money centres operate during a 24-hour period.
What this means is that there are actually three “market opens and closes”.
The Asia/Pacific session: The majority of turnover in this time zone takes place in Sydney, Tokyo, Hong Kong, and Singapore. Typically, there will be exporters and regional central banks active in this session. However, the liquidity is nowhere near as deep as it is during London or New York. As such, the price action is not usually as interesting as it is during the other sessions.
The London session: This is still the most important session of the day, for geographical reasons above all else. Along with London, other European financial centres are active—Frankfurt, Geneva, and Paris. That’s why large corporate flows activity takes place during this session and contributes to the deep liquidity that London benefits from
The New York session: The Forex market experiences its peak in turnover as London passes the baton onto New York. However, whereas the London session tends to be trendy, New York has much more volatility and chop. Therefore, the best trading strategies to deploy change significantly. After noon in New York, liquidity starts to dry up quickly.
What’s next?
Pivot Points can be a versatile technical tool to help ascertain potential supports and resistances.
If nothing else, Pivot Points allow you to walk into any given session—day, week, or month—ready and prepared to react to the market’s movements. Being prepared already puts you in an advantageous position.

Is mindset holding you back 🤔Trading can be a rollercoaster of emotions.
Many traders are unaware of when their state of mind leads to underperforming trades and why it happens.
We are all different and unique when it comes to trading, and understanding the type of trader you are is essential to your success.
Traders can spend a lot of time studying technical indicators and strategies, but understanding the psychology driving your trading decisions is just as important.
The first starting point of getting on the right path in regards to trading psychology and emotions is by having the right one of two mindset choices.
There's two mindsets which will effect your trading results and progress massively.
They are 'Growth mindset' and 'Fixed mindset'
Of those two mindsets there is only a place for one when it comes to trading and that is 'GROWTH MINDSET'
The graphic on chart shows the difference between the two mindsets.
If you can't ditch the 'Fixed mindset ' you will never be able to progress in trading.
No matter how great of a trader you think you are, or how well you think you handle your emotions.
It's impossible to remove them from the equation completely when trading.
When emotions are combined with a 'Fixed mindset' mentality however you are going to feel emotional pain and loss of money when it comes to your trading.
Once you have learned to recognise your mindset, you can then begin the next important step of switching to the ' Growth mindset '
People with a ' Fixed mindset ' believe they are born with a certain amount of intelligence and that it is fixed for the rest of their lives.
People with a 'Growth mindset ' however know that intelligence is not fixed and that you can in effect grow your brain.
They see their traits as just a starting point and know that these can be developed by hard work, effort, dedication and challenge.
Having a growth mindset can improve your progress and attainment and this is crucial in being successful as a trader.
The brain can be developed like a muscle, changing and growing stronger the more it is used.
Your abilities are also very much like muscles they need training in order to perform at their peak.
You can learn how to do anything you want to do and you can get better at whatever that is with time and consistent practice.
Even if you have what you perceive to be a talent or ability for something, if you never practice that talent or ability you simply will never improve.
Applying this theory to your trading game will help you grow not just your accounts but as a person also.
Get that 'Growth mindset' and start believing in your ability to change.
Thanks for looking.
Darren 🙌

Why is a workplace important in trading?Why is a workplace important in trading?
Trading is such a small life that you live every day by opening a chart and an exchange. And above all, you must live this life with dignity. And in order not to break down, not to burn out, to save your nerve cells, it is important to devote time, first of all, to psychology.
Your workspace
It is important that you feel comfortable working. Nothing should cause you negative emotions, remove all irritants: wipe the dust, remove all unnecessary, leaving only those things that you use daily.
You should sit down at the workplace and get maximum satisfaction, everything should be as comfortable.
You need to achieve maximum comfort, pay attention to what you are sitting on. Chair or office chair, choose it according to your height, back position, soft or hard, leather or velor.
Customize the location of the monitor, mouse, keyboard or laptop in general.
Use the speakers you need to play your favorite music in the background.
Why is it so important? Because even the slightest irritants can affect your work on the crypto exchange.
For example, you got a loss, at the same moment the cup with your cold coffee fell and now after 30 seconds - you are furious at everything around, and next time you start open random positions and get more and more loses.
How to build a workflow?
After you have prepared the workplace, you need to prepare the work itself.
First, decide on the time. You need to draw up a trading schedule. You should not sit 24/7, tremble over the charts and follow every candle, except for overtrading. Yes, it will be difficult to choose the time for yourself right away. Highly recommend you to watch my video about trading styles.
Create best workflow on exchange or trading view! Add favorite tool which you use all the time. Time charts, crypto lists colors, background, and all this small things. Ill make another video with trading view setups.
But who knows you better than yourself? That's right, nobody. Therefore, think about how you will be more comfortable.
Next, we need to determine in ourselves those things that can interfere with trade. For example: you are very sensitive to money, every penny counts. You may need to work on your relationship with money. Maybe we should not overestimate their importance. After all, this can be detrimental to emotional health in the future.
Or you are an extremely gambling person, like disputes, get adrenaline from the process itself. In this case, you should think about how you will deal with excitement while trading.
After all, I already told you that trading is a small life. The crypto exchange is not a place of fulfillment of desires. This is the battlefield.
And in conclusion, I want to add to the preparation:
Pay attention to the chart, set the colors and tools that are convenient for you in the trading view and on the exchange itself.
Get a notepad. Write everything down the first time. All observations, all transactions, all emotions, all flaws. Write absolutely everything there, every day.
Write yourself a checklist, add to it everything that prevents you from working and hang it in front of the monitor. Every morning, before you sit down for a chart, see if the conditions are right.
For example: excellent mood, no headache or other pain, slept well, concentrated. All urgent matters are done so that nothing distracts you, etc.
And most importantly, be self-disciplined.
Hope you enjoyed the content I created, You can support with your likes and comments this idea so more people can watch!
✅ Look at my ideas about interesting altcoins in the related section down below ↓
✅For more ideas please hit "Like" and "Follow"!

SMC Education - Bearish Setup..!This Content is for Education Purpose only.!
Smart Money Concept ( Bearish Setup ) as I mentioned in the Chart.!
Keep Supporting LIKE, COMMENT And FOLLOW.!
Thank You.!

Danger of TradingHello trader!
Welcome back to another episode with Analyst Aadil1000x.
Today I am here to show you some stories that many traders don't know that can also happen to them and many traders can also relate these stories with them. You will only see success stories on the internet and that's only 1% truth.
Have you not seen how much tough the market is? If you are not working very hard then there is no way to win because this is the toughest business in the whole world.
A person can understand better if the situation is told in a story that's why to make you understand I am sharing some stories.
First story.
There was a guy who was living in my city. He started forex trading and he got some lucky shots and made a small amount of money but he didn't know that this happens to all new traders, LOL. Once he made money he thought making money is as easy as opening an account but he lost 50,000 USD and not only that what he did later will scare you. He used all of his father's retirement fund and sold the house and lost everything in forex. He lost almost 600,000 USD.
To recover the amount he started to put more money. He wanted a fight with the market. From me, you will always listen that we will move with the market. Normally people say kill the market or will beat the market. You can't do that. The mindset of moving with the market is the only option to win.
Second Story
There was a guy who started trading and with little experience, he started to trade on borrowed money and he lost almost 60K and now he has a debt that he can't even pay.
Never trade from borrowed money if you have little experience or your strategy is not perfect. The chances of your winning are -100%.
Third story
It's a story of a girl living in another country whose monthly salary was 2500 pounds. She was trading different options and she lost 200,000 pounds in a year. Again whose money was that? It was her parent's money and she used that without telling them.
She was trading with untested methods. When she figured out something new she start to put money into a new method and she kept changing methods and losing all the time.
There are many stories that I hear every week with losses with more than they have earned in their life. So don't do these types of mistakes. If you are a new trader then trade only 20$ and grow it to 100$ and make notes of the strategy. If you make it possible then you can be a successful trader.
REASON BEHIND YOUR LOSS
One main reason behind the loss is WRONG knowledge on the internet. Even if you search for the most popular post, it has 5000+ like and it has more than a dozen images and he is guiding how to trade. The surprising thing is out of 12 images all 12 images are wrong and it's the most popular post. How is that possible that 100% of the guidance is wrong? Even he can give one correct direction by mistake but he failed to give one direction correct even by mistake. That's how tough the market is. Even so-called experts don't know what they are doing.
The reason behind all wrong is that he learned it online and taught the fake knowledge to many traders and it keeps continuing..
Imagine millions of traders losing without knowing their mistakes. When they lose they go back to the same information read it carefully and try to do the same thing in the best way possible and they still lose because they are using never working methods.
You have to work very very hard to move with the market. I worked really hard and formed some working methods and I know that those who don't know exactly what's happening in the market have little chance of survival.
Don't forget to give some boost and follow to stay connected.

Domino principe in crypto marketBINANCE:BTCUSDT
Let's start with what the S&P500 is.
The S&P 500 is a stock market index made up of 500 large companies whose total shares are traded on the New York Stock Exchange (NYSE) or NASDAQ.
The NASDAQ index - trades over 3,000 stocks. This exchange specialises in stocks of high-tech companies
I will not torture you with charts, but I will tell you why the classical stock market indices affect the cryptocurrency. Correlation of the cryptocurrency and stock market.
The S&P 500 and NASDAQ indices include stocks of technology companies, incl. crypto companies. For example, Coinbase Global , Riot Blockchain , etc. In other words, their indicator reflects the state of the entire sector of the economy.
Cryptocurrencies are highly correlated with US technology stocks, as they belong to the same class - risky instruments.
They are bought, counting on a strong price increase, and sold at the slightest signal of impending problems. And inflation and geopolitical uncertainty motivate to seek protection in safe-haven assets.
In April, the US reported inflation of 8.3% (money is depreciating, prices for goods and services are rising), the main reason is that they have printed too much money, the national currency has to be strengthened. All this immediately affected the stock and crypto markets. Bitcoin was the first to react. Based on this, we can build a chain of influence: world events / inflation > stock market > bitcoin > altcoin > panic around stables.
Panic is subject to the Domino principle. One event affects another, causing a chain reaction, and everything gradually tends to destruction. We will try to illustrate this principle.
Following the record crash of the $LUNA Terra token and its $UST stablecoin, increased volatility has been seen across all stablecoins. Someone, as usual, knew everything in advance. Back in April, there were many articles about how Terra has a weak algorithm and can easily play the death spiral scenario. The bottom line: “If the price of $LUNA comes under pressure, $UST holders may fear that the $UST peg is under threat and decide to buy out their UST positions. To do this, $UST is burned, and $LUNA is minted and sold on the market. This will further exacerbate the fall in the price of $LUNA, pushing more $UST holders to sell their $UST.”
There are many theories about the group of people behind this pressure. It boils down mainly to the fact that pressure is exerted in order to regulate the crypt. This is not so important. The trouble is that the system failed, and if this is possible within the framework of the "game rules", but it does not matter by what method this was achieved, it would have happened sooner or later.
Investigation to be! The US Securities and Exchange Commission (SEC) is investigating the decoupling of UST from the dollar. And in the United States, they pass a law on the regulation of stablecoins by the end of 2022.
The situation with LUNA put the strongest pressure on the market, $UST was shaking for several days until it completely died, the situation escalated, panic attacks seized all sectors of the market, the domino principle was launched.
USDT ≠ UST ?
What does stable mean? $USDT is backed by fiat dollar reserves and assets. Those. For every $USDT, there is a real $1 US. This distinguishes $USDT from algorithmic $UST.
Part of the securities backed by $USDT is related to the Chinese real estate sector, which is in crisis. If these securities depreciate, then the peg may lose the rate 1:1.
And this fear has been around for a long time, so Tether is reducing the share of commercial paper, increasing the share of the real dollar.
In February 2021, Tether agreed to provide reports as part of the settlement of allegations of covering up the loss of funds and lying about the state of the reserves.
As of March 31, Tether had assets of at least $82.4 billion, as well as $82.2 billion of liabilities related to the digital tokens it issued.
But this does not change the reasons for the shorts, because the specific sources of commercial paper have not been disclosed.
Do not forget that during a general panic, fear provokes fear, each event causes two more, all this grows exponentially, and someone is sure to profit from it, this is the golden law.
After analyzing the current situation, I can note a lot:
Stablecoins, not so stable. If not backed by real $, and even here you can bet.
You can’t panic, otherwise volatility is inevitable, and sometimes you can even make money on it.
Be vigilant, remembering that panic takes over everyone. At such times, risk is everywhere, analyze what you are doing and be careful.
A crisis is a difficult time, on the other hand, it is a time of opportunity.
Study what you invest in, these are market conditions.
The cryptocurrency market is directly related to the stock market. First of all, the stock market affects Bitcoin .
Is it really that bad?
Cryptocurrency has already experienced difficult times. The market cannot go up all the time, the current situation is quite natural. But it was at such times that the most significant projects of the sphere were born and developed on the market.
Collective panic cant strongly shake the market, any token and even shake $USDT. Don't despair, we are in the right place.
Hope you enjoyed the content I created, You can support with your likes and comments this idea so more people can watch!
✅Please be aware of the risks involved in trading. This idea was made for educational purposes only not for financial Investment Purposes.
* For more ideas please hit "Like" and "Follow"!

Some cool features on Tradingview!Many times we search for holy grail strategies that works and we tend to ignore some little stuffs that can help us defeat that 'Goliath', the giant market. We all know that there's no such thing as a 'holy grail' strategy. There are only certain things (simple things) that needs to be combined and when used well these can be good strategy to help us defeat that furious Goliath.
In this article I am going to discuss about some cool tradingview features which are important to every trader and which we should not dare ignore. You might be familiar with these or perhaps already use these in your day to day trading activity.
The first one is Alert.
This feature allows you to set alerts on certain levels of interest or price. Once the market reaches the price or level you specified you get notified immediately by visual popups, audio signals, email alerts and email-to-sms alerts. You can set alerts like, "Alert me if Bitcoin crosses above $25000."
You can set alerts on your trendline, indicators like moving average and once the market touches the desired level of your indicator you receive a notification. How cool is that!
Instead of you watching the chart 24/7 to wait for Bitcoin to reach $25000, you can set an alert on that level so you get notified once price reaches there. Why alerts relevant in trading? Just like you need alarm in the morning so you don't miss an important appointment, you need alerts so you don't miss important trading opportunities. Alerts have really helped me to focus on quality trades. All I do is set an alert in advance if I see that Gold will reach a strong support in few days, because there can be a lot of interruption. Once Gold reaches the support level I get notified.
Go have fun with your friends buddy, just set that alert and be notified once the market reaches your desired level.
The second feature is Replay
Replay tool on tradingview can be used to study past price action and trading history.
Why is this feature relevant?
Well, if you want to master your strategy one way to do is to study historical data or price action. With the replay tool it can allow you to go back moment in time and replay the same price action that occurred in the past. That way you can practice your strategy and see how you could have traded that market.
The third feature is News/Headlines
If you want to receive news and headlines of what is shaking the market then you should not ignore this feature. With just a click of a button you can view important headlines that is moving the market. What I find interesting about this is, the news or headlines you see is specified by the instrument that you are currently viewing on the chart. For example, if you are currently on EURUSD, once you click on the news icon, most of the headlines you will see there are those that will have a direct impact on that pair. How beautiful is that! Instead of you having to struggle to search for fundamental information affecting the market, this feature has everything you need to stay on top of financial news.
The last feature in this article is Screener.
Screener is a tool that can be used to scan and filter instruments based on market cap, dividend yield, volume to find top gainers and most volatile instruments.
Why is this important?
If you want to learn which instruments are gaining or weakening then the first place you need to go is to the screener. By looking at the stock screener it helps me gauge how the stock markets are doing thus it helps me have informed decision as to what to focus on and it helps me have strong conviction in my biased.
Do you use these tools in your trading?
Note: Some of these features you need to have a paid plan with tradingview for them to be enabled.

SMC Education - Trendline Liquidity..!This Content is for Education Purpose only.!
Smart Money Concept ( Trendline Liquidity ) as I mentioned in the Chart.!
Keep Supporting LIKE, COMMENT And FOLLOW.!
Thank You.!

Education - 5 Simple Rules for Trading Excellence Good Day - hope everyone is good, and enjoying the opportunities currently being presented by the Market.
Aim of the post above, is to highlight simple principles that can propel Retail Investor chances of success, to the next level.
The next level meaning - mental equilibrium, excellent R/R opportunities and the ability to execute opportunities flawlessly.
In this 'game of trades', where Banks & Financial Institutions nourish themselves with the excess liquidity that sub-par Retail Traders enthusiastically provide the when they enter trades poorly (either timing or opportunities), it often comes down to a 'mental game' and excellent rules to follow.
Please share what you think about the 5 rules, above - and take the opportunity to ask me any burning trading-related questions on your mind!
Keep executing flawlessly.
Best,
Figuring Out Finance

India Cement Long - For educational purposePositional we can buy India cement above 174.30 stop loss 169 closing basis.
Target 1 : 180
Target 2 : 186
Setup:
Cup and handle pattern
Inside candle in daily chart

Gold: trading ascending and descending channelTAKING PROFIT: trading trend pattern sometimes is not that easy because sometimes our targets meets some hurdle on the way which make us to exit the trade with fear before our target and we end up regretting it because the market finally gets to our target. But believe me incase whereby you've a sell order in a descending channel you don't have to panic in such situations because any delay and hurdle faced on the way down is a blessing I mean the more it delays the more low is going to touch the trend which is more profit while if you've a buy order in descending channel the best time to exit is when the market start struggling near the up part of the trend because sometimes the market turn back from there(which will make some people panic and take less profit when the market is already going down so is better you to exit close to the trend or at retest/double top) and retest on the up part of the trend forming double top and start reversing. Vice versa with ascending trendline.
ENTRY: most people form their trend with 3+ touches without breaking but I prefer mine with 2 touch at one part and 1 touch at the the other part(I mean highest or lowest point between the part with two touch). I form the trend from the part that held twice then I clone it and move to the part with 1 touch once capped at the point with 1 touch I make an entry.to the other part. For me once market have touched any part of trend 3x it can't longer be trusted I've to be very sure it holds before making an entry and from this point 5 touches is the maximum I can trust. I don't know about other pairs I trade only Gold.
SPOTTING FAKE BREAKOUT:
Combining trend and supply and demand is best strategy you might want to try that will always help you to spot fake break out because most times the market break out of trend and hit zone and cap back at trend and sometimes market break out of zone and hit trend and cap back at zone. This help you spot fake break out to avoid trading fake breakouts.

Why can't you make it?Hello dear traders,
These are some common mistakes that i used to do that are part of my trading journey which is about 6-7 years. This is my first video on tradingview so apoligize for some pauses in my speech. I was a bit nervous when i did it. If you are at the beginning of your trading journey and it seems that everything is wrong, you gotta ask yourself why can't you make it? Here are some common mistakes that i did and some that i gathered from various discord and slack groups.
1. FOMO-ing (i guess this is in all the videos out there) - Remember that money goes from impatient to the patient.
2. Journaling - this is an important and key process of your trading journey. No matter how boring it looks, its gonna make you better i promise
3. Understanding macro concepts - this is a very important aspect and unfortunately it takes time to progress in this matter. There is always something to learn when it comes to macro economics. Its very important to gauge your sentiment from having a good understanding on what is happening globally. You can do it! Even if you trade mechanical its good to have it in the back of your head.
4. Not writing down key levels on a daily basis (updates of the assets you are trading)
5. Phone trading(while good to watch the markets sometimes) just so you know professional traders dont do it(probably only to adjust orders). We spend time in front of the desk like a regular job. Also it distracts you from being social and turns into an angry monkey because you are high on watching the markets. Been there done that.
6. Quitting your job to trade full time - before you make this switch make sure you are at least profitable for one year on a real account. This is a very common mistake and i met some people along my journey that ended up pretty bad.
7. Overtrading and spending 12-14 hrs in front of the pc - very unhealthy habit and it will turn into an antisocial being. Less is more!
8. Overleveraging - If you dont protect your capital, who else will do it for you? You are the warden of your money and you should treat them with a serious attitude. No one likes to lose so lose less until you get better to crank that leverage up. (use a degen account if you want to go banana on an account but not on the main account)
9. If you are in a trade with defined risk (don't micro manage it) leave it to play out. You already knew the risk from the beginning and you already defined it. Closing too soon can lead to consecutive losses.
10. Using more than 1% risk per trade. Dont go more than that even if its a small account. It will help you build confidence in time.
11. Having a good process -> how many sessions do you want to trade? 1 or 2? (london&new york) ...i mostly trade London and then calling it quits for the day.
12. Daytrading(just so you know there are days where you have to wait for the pricce to come to your levels and it may take a few days for one trade to actually happen) You know what to do in that spare time, learn about the markets and review your trades.
If you want you can add more mistakes here. I hope your journey is a successful one and you want to become better everyday in everything you do. You can do it!

SMC Education - Trend Reversal..!This Content is for Education Purpose only.!
Smart Money Concept ( Trend Reversal ) as I mentioned in the Chart.!
Keep Supporting LIKE, COMMENT And FOLLOW.!
Thank You.!

🧅My trade journal 7/15/2022My previous trade journal was in a private post...no wonder why
It's was my fault i was too hurry to post the idea so i will linked below this description .
if you want to see it just click on all my related ideas.
.
.
.
.
.
.
.
.
🧅Disclaimer :There are risks associated with investing in securities. Investing in stocks, bonds, exchange traded funds, mutual funds, and money market funds involve risk of loss. Loss of principal is possible. Some high risk investments may use leverage, which will accentuate gains & losses. Foreign investing involves special risks, including a greater volatility and political, economic and currency risks and differences in accounting methods. This is Not Financial Advice
🧅JUST AN OPINION OF THE ONION.🧅

SMC Education - High Probability Setup..!This Content is for Education Purpose only.!
Smart Money Concept ( High Probability Setup ) as I mentioned in the Chart.!
Keep Supporting LIKE, COMMENT And FOLLOW.!
Thank You.!

Become a better trader by just answering these questions!Hey Traders!
Most people think that trading success is found within a system... yet a successful trading system could be something as simple as 2 or 3 basic combinations, knowledge of price action and a sprinkle of instinct.
To me successful trading is a completely different path, I believe that real trading success falls into one sentence which is "Constant and never-ending improvement",
self-improvement that is, and in today's post, since it is the weekend, I want to go over this core improvement process with you so you too can become a better trader next week!
First to make it clear, I believe that out of the 100% required for trading success the system part falls into the low 10%, while the other 90%+ is within you, it is your knowledge, knowhow, instinct, mindset and everything else that makes you... you. The system is something you learn once and all you have to do is follow it forever with consistency and focus, sounds simple right? It kind of is but we humans tend to make it complicated.
Anyway, its Saturday the 9th of July and I want to give you 6 questions that if you answer will make you better by at least 1% right away, but if you continue to answer these questions each time you will, guaranteed no matter what (as long as you are honest) get better by 1% each time, how much better you become in entirely up to you, and by that I mean how honest you are and how consistent you are in answering these questions!
So, without anymore delays, here are the 6 questions that can make you a better trader:
What was my biggest loss and why?
What was my biggest profit and how?
What was the best thing I did this week?
What am I most excited about for the upcoming week?
Did I follow my system on every trade?
Was I in control of my trading, mentally, every time I traded?
BONUS QUESTIONS:
What prevented me from doing better?
What motivated me most?
What will I not repeat next week?
What will I repeat next week?
What do I want to remember it for?
What is the best highlight?
What do I regret not doing?
Do you have any of your own questions that could help other traders? - Do share in the comments!

SMC Education - Why Trader Fail..?This Content is for Education Purpose only.!
Smart Money Concept ( Why Trader Fail..? ) as I mentioned in the Chart.!
Keep Supporting LIKE, COMMENT And FOLLOW.!
Thank You.!

Session Times and Liquidity EducationGBPUSD - This is purely an educational post. One of the cleanest trading days. As we can see the market created the fake liquidity grab post Asia range, this was then followed by the real liquidity grab from the upside. As the market is overall bearish this was spotted much easier. We can then view the NYSE open where the price came back to grab liquidity from the supply area then drop. Text book price action

When London Pays Out!If you follow my previous posts you'll begin to see this pattern.
It happens everyday. You just have to follow the breadcrumbs.
Double Tops And Double Bottom Patterns are a Snipers Best Friend.
Learn them like you know how to spell your last name.
They will lead you to the land of Pip$ we all dream about.
Never Over Leverage.
Trust your trade set up.
Have Fun!
I AM Pro Trading Made Simple.

What is the potential of the crypto market and Bitcoin?📈👀
As everyone gets used to crypto, big players and institutional investors are starting to adopt it.
For example, just today the CAR launched its national cryptocurrency, and Timberlane launched an animated monkey music video called BAYC, following Snoop Dogg and Eminem.
Let's examine the potential of BTC and crypto in general.
In the main picture you can compare the capitalization of different parts of the financial market.
The largest capitalizations are in forex, futures, and funds. Then, with a big gap, the other components of the market go, including crypto, with a current capitalization of only about $700 billion.
That is, the crypto can still get scammed)
Why isn't crypto being adopted faster?
First of all, because there is no stability in it. No matter how much crypto-enthusiasts talk about Bitcoin as the new gold, in reality it is a very speculative asset and most bitcoins are in the hands of private investors. States are afraid of what they don't control, so they don't invest in crypto, but rush to issue their own digital stablecoins.
- Except for El Salvador's, which everyone is laughing at (they've already bought BTC)
How much can a BTC be worth?
Bitcoin is the face of the entire crypto market, as it grows and updates historic highs, it attracts new investors and more people learn about it.
At the time of the bull run in 2021, at $69,000, BTC had a capitalization of just $1100 billion.
To reach the desired mark of $100,000, BTC needs a capitalization of about $2100 billion at the current turnover of 21 million coins.
Even if that happens, the crypto market will still be incomparably small compared to other parts of the economy and the potential is truly great. We are the pioneers of this industry, and as we know, it is the first ones who make the most profit.
Under what conditions will the BTC break through the $100,000 mark?
1. Adaptation
Cryptocurrency adaptation is when every third person will have a cryptocurrency wallet installed on their phone and will be able to use it to buy clothes or pay for groceries in the supermarket.
2. State stablecoins
The launch of digital national currencies will force people to adapt to the new reality and use blockchain in their daily lives. Many people will have to learn what crypto is and how to use it. At the same time, trust towards crypto will increase.
3. Education in schools
Just like now parents and teachers explain to children that every country has its own currency and that you can buy a piece of a company if you have money, in the future they will also have to explain that every country has its own stablecoin and you can buy a piece of some cool project on the blockchain.
Cryptocurrency - Blockchain - will absorb at least x10 liquidity from other markets, IT’S ONLY QUESTION OF TIME!
