Technical Analysis !!!👨🏫Hello, my trader friends🙋🏻.
I want to tell you the story of Technical Analysis, its advantages & disadvantages.
We're even gonna learn about its branches.
Like any other science, Technical Analysis has come a long way, and it's still evolving. But why should we learn it and know it well?🤷🏻
When you're trading, you may be afraid or greedy. But how do professional traders control these two?🤔
Let me start with a simple example.
If someone turns off the lights & challenges you in a new room, you will feel scared or lack confidence because you don't know that place. But if the challenge happens in your bedroom or home🏡, you'll feel more powerful 💪🏻 and confident because this environment is familiar & you can act better.✅
Fear is caused by the unknown. When you don't know this market, you can't get good results (or at least permanent good results).
So follow this page to conquer all the peaks⛰️ of Technical Analysis together🙌🏻 and learn from A to Z of it.
Also, I'm a fellow traveler on this route🛤️, not your tour guide.
So, if you have any questions, ask me in the comments💬.
My trader fellas, let's take one step👣 at a time because taking long and hurried steps will only hit you harder. I'm with you in all these steps🪜 & get started with the first type of market analysis.
Technical Analysis is old. I mean, it's almost 300 years old📜, but it doesn't like to talk about its age, so we couldn't find the exact information about its birth date🗓️😑.
Maybe it’s from Japan⛩️🎌 and was born in the 18th century, or perhaps its date of birth is in the Middle Ages.
But there is some more information that I'm sure about. For example, in 1879, the Technical Analysis found a friend by the name of Chart📈, and they have not separated until today.
Let's skip this story and be serious☺️. Technical analyzers believe that everything is in the Chart.
In Technical Analysis, there is all the necessary information for trading, such as entry points, exit points, market volume, stock prices in the past and present, etc. (The Chart is a complete encyclopedia for Technical analyzers!!🤦🏻😶 )
There is another type of analysis that examines the available information about a stock (from the founder of a stock or company to the cost and income and even the company manager's records), called Fundamental. But the Technicalists say that even some of the Fundamental information is in the Chart! 😐
Overall, Technical and Fundamental are both complementary to each other and opposite to each other. But both are related to the Chart. (These three have a complicated relationship; I mean, there is a love triangle, so we should stay out of it !!🤫😂 )
Let's skip the joke. All these things are just like the gears⚙️ of a car, but it's not enough. You need to follow more rules in the market to pass the finish line🏁 with your trading car🏎️ . Don't worry cause I'm gonna tell you everything you need to know to win🏆 this trade racing with your strategy car.
Now that we have learned a little about the history of Technical Analysis, it is better to learn about its contents.
The price chart, our most important resource and tool in Technical Analysis, consist of the price-time, Charts, and Candles.
But these candles🕯️ existed 100 years before bar and dot charts.📊📉
In 1700, a Japanese man named Huma realized that the price of rice depended on the emotions of traders in addition to supply and demand.
Candles show these feelings with their colors.
For example, the green candles🟢 show trust and good feelings among people who invested in a stock.🤑
But red candles🔴 indicate doubts or hopelessness of people about a stock, and they sell it.😞
I don't know why I remembered Moody's octopus doll🐙 :)
But candles tell you the feelings of other traders just like these dolls. But only its color is not essential.
Can you guess the other important factors about candles? I will tell you the rest of them soon.😉.
Have you heard that history repeats itself?
By looking carefully🧐 at the old charts, some creative people found that the prices behaved similarly to their past.
They realized that the candles make interesting shapes next to each other, and they made these shapes repeatedly in different periods.🔁
They formed different geometric shapes and patterns & continued to make these shapes until today :)
Let's accept that the Chart is creative and artistic! 🎨🖌️😊
For example, they found a shape called a Head & Shoulders Pattern. This type of pattern will cause a downward trend⤵️ in the Chart.
I tried to find it & place it on someone's Head & Shoulders to remember it better. 😁
Many patterns can be found in any chart, and I have already taught the reversal patterns in my previous posts, But I want to go over all the patterns in detail again in the future, so let's dive into the other contents of Technical Analysis.👇
Using formulas, mathematical🧮 ratios, and advanced calculations, indicators were created that can generally show the market's present and past and give a relative opinion about the future (Please don't get the indicators wrong with magic 8 ball🎱 or Professor Dumbledore's wand✨. )
Let's be serious about it. Maybe you know that indicators depend on the two factors of time and place of price.
In terms of time🕦, they are divided into two categories: leading and lagging.
In terms of price movement💹, they are divided into three categories: trend indicators, oscillators, and volume indicators.
The indicator that I made the above meme for is a leading oscillator.
Now it’s time to go for the other various tools that are made by using numbers🔢 and people’s actions in the market.
A person named Nelson Elliott made a useful tool, although, after his death, many people worked on this tool and improved it until today it reached us, but we are going to discuss it better in the following posts like the rest of the contents of Technical Analysis.😉
But I have to say Elliot believed that the market is not disordered and always repeats a repetitive cycle, and Eliot called these repeated movements waves.
According to him, if you can perfectly identify the repeating patterns in the price, you can predict how the price will change (or not change) in the next phase.
Eliot published his experiences and theories in a book called the waves principle, which I recommend if you want to get good information in this field; it's better to start from the origin of this theory.
I think there is no better definition for the word "Wave" than sea waves🌊, and I tried to draw Elliot waves like sea waves reaching the shore. 🏖️
In the end, I want to say that whatever style of analysis you have or whatever type of Chart you use, in the future, this machine will not go the right way without following a series of principles.
Suppose you have the best car in the world, but you neither know how to drive nor the rules. It can be guessed that you will either crash with someone or break the car💥.
You should have risk management along with your trading system, and don't forget that no trading system is perfect.🙅🏻
It is better to try each method on demo accounts before making real trades.
Of course, you can count on me and ask any questions you may have.🙂💭
In the following posts, I’ll talk more about the things that have been said and introduce you to good trading systems that can be obtained from any method.
I'm by your side so that if you are a beginner, you can find your own way, and if you know the market, we can learn the basics of this market better & together🤝🏻.
Wish you happiness, health & success guys🙋🏻.
Educationaltrade

STOP LOSS TRADING STRATEGY!Hi guys, This is @CRYPTOMOJO_TA One of the most active trading view authors and fastest-growing communities.
Consider following me for the latest updates and Long /Short calls on almost every exchange.
I post short mid and long-term trade setups too.
Hey traders,
In this post, we will discuss 3 classic trading strategies and stop placement rules.
1) The first trading strategy is a trend line strategy.
The technique implies buying/selling the touch of strong trend lines, expecting a strong bullish/bearish reaction from that.
If you are buying a trend line, you should identify the previous low.
Your stop loss should lie strictly below that.
If you are selling a trend line, you should identify the previous high.
Your stop loss should lie strictly above that.
2) The second trading strategy is a breakout trading strategy.
The technique implies buying/selling the breakout of a structure,
expecting a further bullish/bearish continuation.
If you are buying a breakout of resistance, you should identify the previous low. Your stop loss should lie strictly below that.
If you are selling a breakout of support, you should identify the previous high. Your stop loss should lie strictly above that.
3) The third trading strategy is a range trading strategy.
The technique implies buying/selling the boundaries of horizontal ranges, expecting a bullish/bearish reaction from them.
If you are buying the support of the range, your stop loss should strictly lie below the lowest point of support.
If you are selling the resistance of the range, your stop loss should strictly lie above the highest point of resistance.
As you can see, these stop-placement techniques are very simple. Following them, you will avoid a lot of stop hunts and manipulations.
What Is a Stop-Loss Order?
A stop-loss order is an order placed with a broker to buy or sell a specific stock once the stock reaches a certain price. A stop-loss is designed to limit an investor's loss on a security position. For example, setting a stop-loss order for 10% below the price at which you bought the stock will limit your loss to 10%. Suppose you just purchased Microsoft (MSFT) at $20 per share. Right after buying the stock, you enter a stop-loss order for $18. If the stock falls below $18, your shares will then be sold at the prevailing market price.
Stop-limit orders are similar to stop-loss orders. However, as their name states, there is a limit on the price at which they will execute. There are then two prices specified in a stop-limit order: the stop price, which will convert the order to a sell order, and the limit price. Instead of the order becoming a market order to sell, the sell order becomes a limit order that will only execute at the limit price (or better).
Advantages of the Stop-Loss Order
The most important benefit of a stop-loss order is that it costs nothing to implement. Your regular commission is charged only once the stop-loss price has been reached and the stock must be sold.
3
One way to think of a stop-loss order is as a free insurance policy.
Additionally, when it comes to stop-loss orders, you don't have to monitor how a stock is performing daily. This convenience is especially handy when you are on vacation or in a situation that prevents you from watching your stocks for an extended period.
4
Stop-loss orders also help insulate your decision-making from emotional influences. People tend to "fall in love" with stocks. For example, they may maintain the false belief that if they give a stock another chance, it will come around. In actuality, this delay may only cause losses to mount.
5
No matter what type of investor you are, you should be able to easily identify why you own a stock. A value investor's criteria will be different from the criteria of a growth investor, which will be different from the criteria of an active trader. No matter what the strategy is, the strategy will only work if you stick to it. So, if you are a hardcore buy-and-hold investor, your stop-loss orders are next to useless.
At the end of the day, if you are going to be a successful investor, you have to be confident in your strategy. This means carrying through with your plan. The advantage of stop-loss orders is that they can help you stay on track and prevent your judgment from getting clouded with emotion.
2
Finally, it's important to realize that stop-loss orders do not guarantee you'll make money in the stock market; you still have to make intelligent investment decisions. If you don't, you'll lose just as much money as you would without a stop-loss (only at a much slower rate.)
Types of Stop-Loss orders
Fixed Stop Loss
The fixed stop is a stop loss order triggered when a particular pre-determined price is hit. Fixed stops can also be timed-based and are most commonly used as soon as the trade is placed.
Time-bound fixed stops are useful for investors who want to provide the position with a pre-set amount of time to profit prior to moving on to the next trade.
Only utilize time-based stops when positioned sized properly to permit major adverse swings in share price.
Trailing Stop-Loss Order
Trailing order caters to the capital gains protection of an investor, while simultaneously providing a hedge against any unexpected price downturns. It is set as a percentage of the total asset price, and the order to sell is triggered in case market prices fall below the stipulated level. However, in the case of a price rise, the trailing order adjusts automatically in tune with an overall increase in market valuation.
Suppose, in a trailing stop-loss market, an order for execution is set if the price of a security falls below 10% of the market value. Assuming the purchase price is 100 an order to sell the security is executed automatically by an authorised broker if the price falls below 90.
In case the share prices rise to 120, the trailing order stands at 10% of the current market price, which is 108. Hence, if prices consequently start falling after peaking at. 120, a stop-loss order will be executed at 108. It allows an individual to enjoy a capital gain of 8 (108 – 100) on his/her investment corpus.
Stop-Loss Order Vs Market Order
While a stop-loss order performs a sale of underlying securities provided the price falls below a prescribed limit, a market order is issued to a broker to conduct trade (both buying and selling) at the prevailing market price. Stop-loss orders are designed to reduce the risk factor, while market orders aim to increase liquidity in the stock market by eradicating the bid-ask spread difference. A market order is the most basic form of trade order placed in a stock market.
Stop-Loss Order and Limit Order
Limit orders execute a trade of stipulated securities if the price reaches a pre-set value. While a buy limit order facilitates the purchase of any securities if the price falls below the given limit, a sell limit order is executed if the price rises above the value. Limit orders are designed to maximise the profitability of an investment venture by maximising the bid-ask spread. It is in contrast to stop-loss orders, which are implemented only if the price is equal to the limit stated by investors, as a method of minimising losses in a bear market.
If you like our content, please feel free to support our page with a like, comment & follow for future educational ideas and trading setups.

What is day trading?What is day trading?
Day trading is the buying and selling of stocks, foreign exchange, commodities and other assets or financial derivatives during a single trading session. Traders speculate on the movement in asset prices by employing various strategies.
Decades ago, day trading was undertaken only by investment firms, financial institutions, trading funds and brokerages. Today, online trading platforms have brought day trading to the palm of a retail investor’s hand.
According to US investment bank BNY Mellon, retail investors have become a “growing force to be reckoned with”. Their share of total equities traded went up to nearly 25% in 2021, from the 10% to 15% reported in the first decade of the 2000s.
For many retail investors, day trading has become a career. Others have burnt their hands trying to make profits from this risky and fast-paced short-term strategy.
Now that we have gone through the definition of day trading, let us read more about day traders, their techniques and strategies, and day trading examples.
Life of a day trader
An experienced day trader’s session will start hours before the market opens or the night before. The trader will take their time to analyze price charts, investor sentiment, corporate news, macroeconomic developments and more.
As the stock market opens in the morning, some traders may sit on the sidelines in the first hour of a trading session to avoid the opening minutes that tend to be volatile.
After the market settles, day traders spend the day scanning for market opportunities. Day traders usually stick to securities that they have experience with as they will be aware of the little intricacies regarding that particular security.
The day trader will open and close positions according to their price targets and risk tolerance. A trader’s setup may involve hedging to protect against unexpected losses.
Day trading is particularly popular with foreign exchange traders. Popular Forex pairs have deep liquidity and tight spread, which allow day traders to speculate on small price movements.
Strategies used by day traders
To understand how day trading works, readers need to know about the various intraday strategies used by traders.
Scalping
Scalping involves a day trader aiming to speculate on small changes in an asset’s price. Traders place numerous short-lived scalp trading bets in a day so that small profits add up to a significant daily gain. Day traders need to implement a strict exit strategy to prevent large losses.
Range trading
Day traders are known for their use of technical analysis which involves identifying support and resistance price levels and analysing price trends, volume and volatility.
Range trading involves buying and selling of securities between a range of price where the top price is determined by the price resistance level and the bottom is determined by the price support level.
Algorithmic day trading
Algorithmic trading involves execution of trade orders based on pre-programmed instructions based on price, time and volume of a security.
Algorithmic trading is extensively used by hedge funds and investment banks to carry out day trades in large orders at high speed. This is also known as high-frequency trading.
News-based day trading
The trader will set up his trade setup based on trading opportunities arising from expected corporate and macroeconomic developments. An example of this type of day trading is anticipating a fall in broad markets before the publication of market-moving data such as inflation numbers or corporate earnings calls.
Day trading explained through examples
To better understand day trading, let’s look at the following example. Note that it is for educational purposes only and does not constitute investment advice.
John is a self-taught day trader who has learnt the art of intraday trading over time through trial and error. He specialises in stock trading and is particularly interested in the US equity market.
Over the years, John has traded Apple (APPL) shares extensively and is well-versed with developments at the iPhone maker.
Before Apple’s fourth-quarter earnings announcement, John conducted a thorough research on Apple and concluded that the company will report strong revenue and profit growth.
John aimed to trade using news-based trading and range bound trading techniques on the day of the result announcement.
The trader opened an intraday position with a target price of $155, based on identified resistance levels, and a stop-loss at $135, based on identified support levels for Apple shares trading at $145.
If Apple announces higher-than-expected earnings, which would cause the stock to rise to a level above $155, John will book profit. In case the company surprises on the downside, causing the stock price to fall, John’s position will automatically close when the price falls below $135, booking a loss.
During the day, John will constantly monitor Apple’s intraday performance to react to unexpected market volatility and to adjust his profit-taking and stop-loss levels, according to real-time performance.
by capital.com

nzdusdthe key in auctioning process ,
whether you looking at initiative buying -initiative selling / responsive buying-responsive selling
we start with the auction market process and value in the market as institutions do and then we learn to track responsive and initiative trades to be able to trade with them
trading is all about leverage and managing risk fast it's not about scalping trading all day everyday its all about finding trade locations based upon the auction process.
institution money flow its called tracking volume imbalances in order flow otherwise known as heavy volume all this does is indicate that there big money traders hedge funds pension funds mutual funds mangers large institution governments either putting lot of money to work or unlock or unwinding postion
basically, all the people that are in the know ok. you and I were not in the know we are we never gonna know we never gonna be inside there always gonna some one else
we don't want based upon what they saying there gonna do we want make their bets on what actually do the best way to track that is through large orders that come through either through a commitment of traders reports that's obviously a weekly report from CBOT .ORG OR SEC GOV
if you track day-to-day transactions and you and you keep track of that you can accumulate better levels of which to trade from therefore you have better probabilities
market is not trading base upon chart patterns candle stick patterns or anything else becuse thats all subjective thats subjective to what you put on your charts what you need to think about bigger picthure
we gonna identify higher opertunities your not just gonna buy just besuse everything selling off the same way wouldnt buy the all time all time highs just becuse it maid a new all time high or break out how maney times you buy breakout it reverse on you well if you want stop doing that you got better prepared is all im trying to say so the auction that these institutions speefically private equity smart money is going to do its going to leave imbalance in volume and they going to have to what these auction leaves to distingushed orderflow foot print that can have effect on the futhure price movement of a security or market whether its next 15 mintues or the next 15 more days if you follow institutional money flow you can determine whether you should be looking to buy something or to short it or just to adjust your risk what it really signals is that those who those who track institution money there is lot of inventory or supply to move
imbalance volume i track, buy imbalance, sell imbalance, crossed market trade auctionning market where buyers lift and market come back in to these buying imbalnce area i can look opertunities given this information this tracking volume imbalance over time
www.cmegroup.com

Financials stocks have long way to moveFinancials are out performing since last QTR, still they have lots of scope to move up. A low risk bet with reasonable valuations. Numbers are improving and institutions are showing interest in EDELWEISS. A long term candidate.


Link swing short idea Greetings from Team : Trading The Tides.
lets discuss a short sell oportunity on (Link USDT )
Target area for initiating short : 7.3
DCA Limits : 8 to be exact as there is a big gap remaining
TP : 6.8 , 6.3 thats a swing position so
SL : no sl
Hold Time : short - mid term
Technical Chart Pattern: structure gaps , rising wedge
Posible liquidity area : 8
Exchange: Binance
Rules :
We use big capital with less leverage .
Max leverage : 3x
Better take trades with 1x.
We only post the exact setup we are following for the trades .
But DYOR .
Not a Financial Advice !
From Team :
Trading The Tides
Like , Share ,Follow
Thanks a lot and see you soon on the next trade .

IDXNONCYC: Is It Time for "Consumer Defensive Stock" to Shine?Hello Fellow Global Stock Trader/Investor!
IDX Sector Consumer Non-Cyclical is an index that tracks the price movement of Indonesia Consumer Defensive Stocks. People call it "Consumer Defensive Stocks" because the customers will continue to consume the company's products even during an economic downturn.
Why do we forecast the IDXNONCYC?
By Analyzing the Sectoral Indices Movement, We could use the data as a filter to look for a potential trading setup in a specific sector.
Technical Analysis
1. IDXNONCYC is moving above the EMA90 which indicates a bullish trend
2. Breaking out of the Falling Wedge pattern
3. MACD created a golden cross, it signified the possibility of continuing its bullish trend to the target area
The roadmap will be invalid after reaching the target/support area.
" Disclaimer: The outlook is only for educational purposes, not a recommendation to put a long or short position on the IDXNONCYC"

How to build a Mechanical Trading strategy? Building a mechanical strategy is usually overcomplicated. As long as your system contains simple but well defined and detailed rules it allows the strategy and the trader to execute with as little friction as possible. Take a look at the example included in the photo as we diagnose problems and optimze the trading plan to it's full potential.

Trading needs to be treated like a business 🧑💼This is spoken about a lot but what does it mean?
In starting a business you would need funding and a business plan, right?
You would have realistic goals mapped out and be focused on your cashflow.
You wouldn't blow your 'cash' in recruiting too fast, or buying too much stock or spending too much on marketing.
Yet, in trading most don't have a plan. Or focus on protecting their cash.
They also don't think long term in line with their plan.
They over estimate their expectations short term and in doing so mess up what they could achieve long term.
You just wouldn't do this in business right?
No one would open or run a business you knew nothing about.
Most come in to trading thinking this will be easy! It's not and we all come in knowing nothing.
So again would you start any other business with no training or idea?
Most can keep the trading cash flow topped up as we all start out on this journey having another job to fund trading.
There is no such thing as a sure-fire way to make money online. However, if you seriously want to make money out of forex trading it needs treating like a business.
In a lot of ways, being a trader is like being an entrepreneur. It takes more than just knowledge and a killer idea.
It also takes hard work, discipline and mental preparation.
The reason it’s a good idea to treat forex trading like a business is because as a trader, your account is your own business.
Trading isn't about the quick money it's about being consistent.
That consistency comes from having a plan and sticking to it much like you would a business plan.
Treat losses as a cost of business and factor them into the plan.
The business plan for you the trader will be the strategy and risk management you opt to run.
Set realistic targets and goals this will ensure suitability, Much how good businesses set up there own goals and aims for coming year with out being to risky.
If you lack on the knowledge front in certain areas invest in education and training, No successful business neglects training and learning.
Invest in resources that will help your business grow. Yes TradingView is free but having a higher package and more data help me just as an example.
There is no other business in the world like trading where the over heads and start up cost are low, So if paid resources can kick you on to next level factor them in as a cost of business.
Keep treating trading as a hobby and it becomes an expensive one.
Start treating trading as a business with the ethos and cultures applied the same as those of successful businesses and that profit starts to come naturally.
Thanks for taking the time to read my idea.
Hope you all have a good weekend
Darren 👍

Why my trade failed?Spot buying a long bias on LDO. Range-reclaim on support is the setup. Entr based on invalidation was the entry technique.

USDCHF ! Daily technical analysisThe price is showing support after a dumping, don't forget it's strongest trendline. Be careful when entering a short trade because there is a high probability of pump from this point.
Here is an analysis of how to entry good accurate short trade.

MOVING AVERAGE TRADING | ADVANCED LESSONHello traders 👋
Today im sharing my trading strategy with moving average.
What Is an Exponential Moving Average (EMA)?
An exponential moving average (EMA) is a type of moving average, but it's better than MA(Only my opinion. It is one of the most important things in forex trade. Because this gives you the best direction of the trend.
How to trade And Use moving average. 🧑🏫
When most traders use it moving average crossing. I don't think it's a good strategy. For me, when using it, looks at a trading setup.
1. Looking daily timeframe 👀
This is because you want to find the price action for a longer period and not just some light movement.
2. Draw ✏️
To draw a trend line ( if you don't know how to draw trendline watch my last lesson)
3. Add 50 EMA 📉
4. The Basics of Support and Resistance + key levels ✔️
the concept is applied in order to maximise the chances of winning trades.
5. Looking for entry + risk management 💰
Always wait for confirm example; trend line break + price making lower low + pullback + add indicators.
In this lesson, we expect EURJPY to fall below 134.50. Let's see what happens in the future.
🤲 If you are enjoying the lesson, please hit the like show your support. 🤲

TRENDLINE TRADING | Advanced trading lesson Hello traders 👋
Today im sharing my trading strategy with trendlines. It's my first education post, so maybe a lot of mistakes. Please don't take it the wrong way, thank you.
Let's talk about lesson
What are Trend lines?
Trend lines are diagonal lines that are drawn on charts in the financial markets trading. Trend lines are used to highlight , visualize , and make price action easier to analyze on different instruments and assets in the financial market.
How to trade And Use Trend Lines + basic supports.
1. Wait for touch ⌛
When drawing a trendline, the first thing price is check the three times or more. If the price is not checked three times or less, can't draw trendline.
2. Draw ✏️
To draw a trend line, you must choose a time frame. I'm use always bigger than 1 hour timeframe . This is because you want to find the price action for a longer period and not just some light movement.
3. The Basics of Support and Resistance + key levels ✔️
When trading with trend lines, the concept is applied in order to maximise the chances of winning trades.
4. Looking for entry + risk management 💰
Always wait for confirm example; trend line break + price making lower low + pullback + add indicators
🤲 If you like my strategy, Please like and comments. 🤲
Thank you!

SPX500Here's the outline of my explanation for my bias and why I see/saw what I'm showing you guys here on this chart. Enjoy (:

ALL Crypto is High Manipulated! Tracking BOTS PART 2!Padawans,
The Market maker bot has come right on time, to set the direction of the market or liquidate people or both. Maybe he is on some Super Yacht right now off the coast of Dubai, who knows. Now I am not saying that we can trade while he is up to his dirty behavior, but what I do know is that along with some other technical analysis, we can generally tell the general direction of the market AFTER he or they are finished
Perhaps should not have posted this. lol- Incase they change the market entry time from this cycle. What do I know about the direction you may ask- I know it is time to hand me my LightSaber

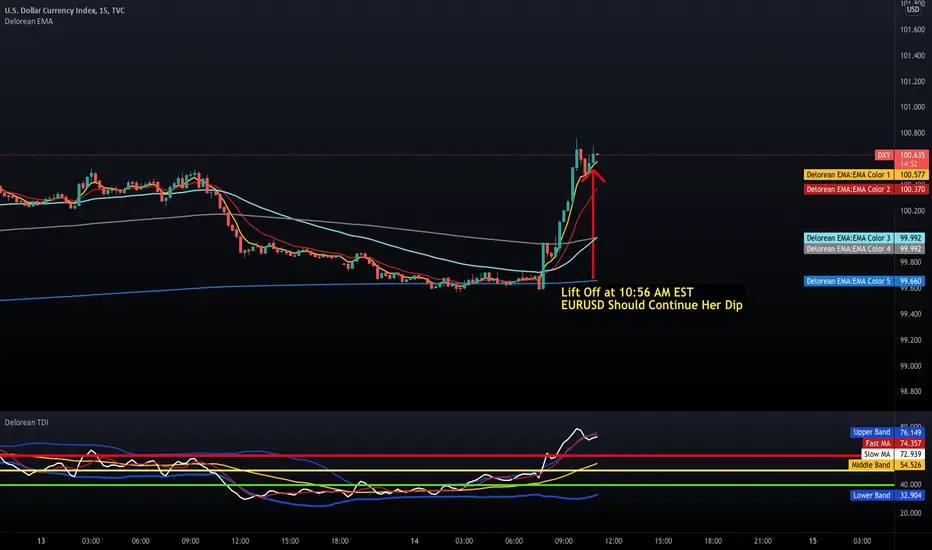
DXY LIFT OFF!!!!!In this chart we see the DXY setting up to give us a BULLISH engulfing signal.
If DXY knock out this double top strongly; look for EURUSD to Continue to sell.
Happy trading Family!
PS All US Base Pairs should be experiencing some kind of correction.
Corrections are very profitable.
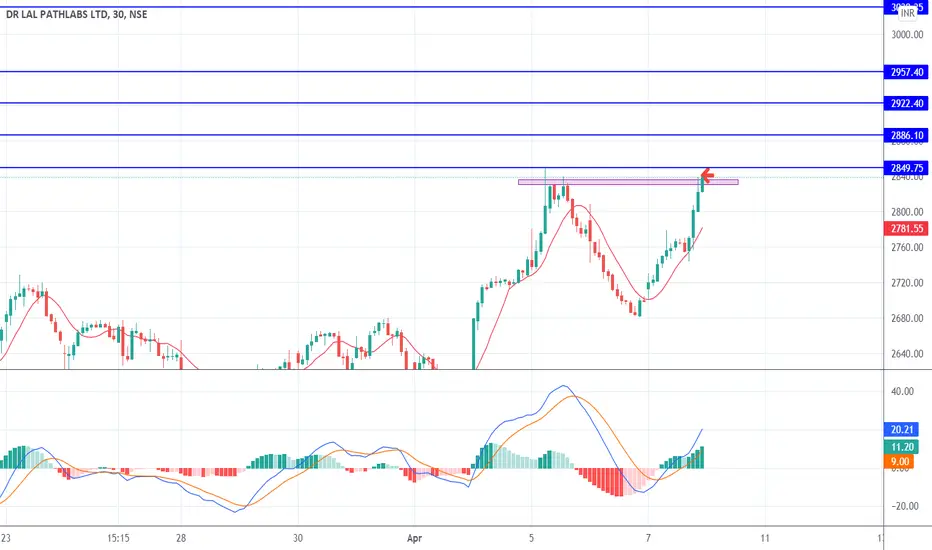
Everyday with one Equity Intraday Profitable Idea:-Dr LalpathlaTrend Analysis is arguably the most important area of technical analysis and is key to determining the overall direction of a security. Trends are based on the principle of higher highs, higher lows (for an uptrend) and lower highs, lower lows (for a downtrend).
Dr.Lal path lab is now in short term bullish mode in corrective wave pattern. and stands in Resistance area. Expecting bullish momentum, when it will cross 2850 with volume. Please initiate trade after breakout and retesting.
Dr all path lab Buy above 2856.
Target 2870,2880,2890,2915
Positional Target :(BTST):- 2950,3000,3050
BNBUSD WAVE And Pattern Analysis The correctional structure, especially the three waves, whether in descending or ascending and pulse correction, indicates the formation of a diametric pattern.
This post is just a personal idea and analysis should not be the criterion for buying or selling
The last specified pattern is currently in a flat pattern. The structure is in high time and the whole chart is in the form of a diametric pattern. You can see the ascent from this area, but lower levels can be achieved

Educational USDJPYAfter a daily morning star formation as highlighted , I waited for a pull and waited for some rejection before going down on lower timeframes to find entry .

The ins and outs of trading psychologyThe ins and outs of trading psychology
For something that I believe makes up the bulk of trading itself, I believe it is also the most overlooked. Trading psychology is what I am talking about, and it is definitely the most important aspect of trading that every trader needs to develop and master in order to become successful.
In the most basic ways to put it, trading psychology is the term that defines all the feelings and emotions experienced day to day by traders. It is not something that can easily be controlled, however with time and experience it is definitely something that is needed to master in order to move forward in your trading journey.
The two emotions that drive the markets are fear and greed. Based on these two emotions, you can find all the negative effects of trading psychology.
Based on the emotion of fear, the following can occur:
• Fear of missing out (FOMO), leading to bad entries
• Exiting a trade too early
• Exiting a trade in a drawdown only to see it go in their original direction
• Adding to a losing position in hope of recovering the drawdown
• Constantly checking your trade
• Finding yourself glued to the charts
Based on the emotion of greed, the following can occur:
• Moving your original TP in order to gain more profits
• Adding large positions after seeing gains in a position
• Over trading and overleveraging to chase big returns
• Risking big on a single trade
Another important thing that needs to be understood is the difference between mistakes and losses. A lot of people think that trading mistakes and trading losses are the same thing. However, a trading loss is simply a trade that hit your stop loss and did not go your way. Until the day you learn to accept that losses are just as much a part of trading as winners, you will not become successful. A trading mistake on the other hand is you simply not following your own rules. You have to understand the importance of being disciplined and how it is possibly the single most important aspect of lasting in the markets. Never break your own rules just to be right, because as said earlier, you need to learn that losses are completely normal and expected.
Emotions are a normal part of everyday life, however it cannot be stressed enough how important it is to leave them completely out of your trading. Many others believe that negative emotions should be shut off, however positive emotions are great to have, however I think otherwise. Emotions should not be attached in any way to trades, whether positive or negative. If emotions are attached to every single trade then what can happen is that you could have a great week and make a certain amount of money that week. Now by attaching an emotion to that trade, you are programming your mind to believe that the following week even if half that amount was made, it is not good enough as you do not have the same intensity of positive emotions. In trading you have to be emotionless towards both wins and losses and strictly follow your rules.
Constantly working on your psychology and mindset is key to developing and succeeding as a trader. Something as simple as developing a daily morning routine, keeping a journal, meditation, exercise, and visiting a mindset coach, are great tools to constantly develop and keep your psychology and mindset at its best. Meditation alone has helped me to develop as a successful trader by improving my focus and attention, reducing stress, reduced panic, improved my information processing, increased mental strength and emotional intelligence, and increase in my focus.
If there is one thing that cannot be stressed enough, it is that the aim of forex is to gain pips and not money. Chasing money, especially fast money, is gambling and you will never have control as long as you remain with that attitude.

Training Trading Positions | Nikkei 4H• Training trading positions Along with how to use trading volume and the impact of volume on price movement !

✅ How to approach Trendline BreakoutsIt's a very simple strategy. It is more reliable the longer the timeframe.
1. Find a TREND LINE
2. Wait for the BREAKOUT
3. Buy while price is RETESTING the TrendLine
4. During LATERAL movements Keep in mind other indicatores such as RSI or other support lines.
5. Enjoy profits during the UPWARD movement (Take profits gradually during the upward move)
