📚 Learn More 💰 Earn More with us: FLAG = Impulse + CorrectionFLAG = Impulse + Correction
📚 LEARN MORE
💰 EARN MORE
With ForecastCity
After a significant drop in Bitcoin price , the price is in a correction wave.
What makes the chart interesting today is that:
. Bitcoin is likely to challenge the 18042 ~ 18227 resistance zone.
. A break above 18227 could push the pair to the 19487 area .
. A resistance rejection , however could lead to another retest of the lower supports.
Will the Bitcoin see a rejection from the resistance zone or an upside breakout?
No one knows it! We have to wait and see!
Educationaltrade

📚 💰 Descending Triangle in GBPNZD - "Learn More Earn More"📚 LEARN MORE
💰 EARN MORE
With ForecastCity
Descending Triangle Definition:
A Descending Triangle is a type of triangle chart pattern that occurs when there is a support level and a slope of lower high.
It is defined by two lines:
. A horizontal support line running through valleys.
. A Downtrend line drawn through the peaks.
The lower highs indicate more sellers are gradually entering the market and selling pressure increases as price consolidates moving further towards the apex.
A Descending Triangle is classified as a continuation chart pattern .
If price can break through the support level, that level will now act as a resistance level.
Breakouts can also happen in both directions. Statistically, downward breakouts are more likely to occur, but upward ones seem to be more reliable.
In most cases, the sellers will win this battle and the price will break out past the support. But Sometimes the support level is too strong, and there is simply not enough selling power to push it through. Therefore you should be ready for movement in EITHER direction.
ENTRY:
We would set an entry order below the support line and above the slope of the lower highs.
TARGET:
Target is approximately the same distance as the height of the triangle formation.
❤️ If you find this helpful and want more FREE forecasts in TradingView
. . . . . Please show your support back,
. . . . . . . . Hit the 👍 LIKE button,
. . . . . . . . . . Drop some feedback below in the comment!
❤️ Your Support is very much 🙏 appreciated! ❤️
💎 Want us to help you become a better Forex trader ?
Now, It's your turn !
Be sure to leave a comment let us know how you see this opportunity and forecast.
Trade well, ❤️
ForecastCity English Support Team ❤️

📚 💰 Ascending Triangle in AUDCAD - "Learn More Earn More" 📚 LEARN MORE
💰 EARN MORE
With ForecastCity
Ascending Triangle Definition:
An ascending triangle is a type of triangle chart pattern that occurs when there is a resistance level and a slope of higher lows.
It is defined by two lines:
. A horizontal resistance line running through peaks.
. An uptrend line drawn through the bottoms.
The higher lows indicate more buyers are gradually entering the market and buying pressure increases as price consolidates moving further towards the apex.
An ascending triangle is classified as a continuation chart pattern.
If price can break through the resistance level, that level will now act as a support level.
Breakouts can also happen in both directions. Statistically, upward breakouts are more likely to occur, but downward ones seem to be more reliable.
In most cases, the buyers will win this battle and the price will break out past the resistance. But Sometimes the resistance level is too strong, and there is simply not enough buying power to push it through. Therefore you should be ready for movement in EITHER direction.
ENTRY:
We would set an entry order above the resistance line and below the slope of the higher lows.
TARGET:
Target is approximately the same distance as the height of the triangle formation.
❤️ If you find this helpful and want more FREE forecasts in TradingView
. . . . . Please show your support back,
. . . . . . . . Hit the 👍 LIKE button,
. . . . . . . . . . Drop some feedback below in the comment!
❤️ Your Support is very much 🙏 appreciated! ❤️
💎 Want us to help you become a better Forex trader ?
Now, It's your turn !
Be sure to leave a comment let us know how you see this opportunity and forecast.
Trade well, ❤️
ForecastCity English Support Team ❤️

📚💰Head and Shoulders in GBPCAD - Learn More Earn More with US📚 LEARN MORE
💰 EARN MORE
With ForecastCity
Head and Shoulders Definition:
A head and shoulders pattern is also a trend reversal formation.
It is formed by a peak (left shoulder), followed by a higher peak (head), and then another lower peak (right shoulder).
A “ Neckline ” is drawn by connecting the lowest points of the two troughs. Neckline support does not need to be strictly horizontal.
. This illustrates that the upward trend is coming to an end.
. When a Head and Shoulders formation is seen in an uptrend, it signifies a major reversal.
. The pattern is confirmed once the price breaches the neckline support
In this example, we can easily see the head and shoulders pattern.
How to Trade the Head and Shoulders Pattern:
ENTRY:
we put an entry order below the neckline.
TARGET:
We can also calculate a target by measuring the highest point of the head to the neckline.
This distance is approximately how far the price will move after it breaks the neckline.
❤️ If you find this helpful and want more FREE forecasts in TradingView
. . . . . Please show your support back,
. . . . . . . . Hit the 👍 LIKE button,
. . . . . . . . . . Drop some feedback below in the comment!
❤️ Your Support is very much 🙏 appreciated! ❤️
💎 Want us to help you become a better Forex trader ?
Now, It's your turn !
Be sure to leave a comment let us know how you see this opportunity and forecast.
Trade well, ❤️
ForecastCity English Support Team ❤️

📚💰Inverted Head and Shoulders in VETUSDT -Learn More Earn More📚 LEARN MORE
💰 EARN MORE
With ForecastCity
Inverted Head and Shoulders Definition:
A head and shoulders pattern is also a trend reversal formation.
It is formed by a Valley (left shoulder), followed by a Lower Valley (head), and then another Higher Valley (right shoulder).
A “ Neckline ” is drawn by connecting the highest points of the two Peaks. Neckline resistance does not need to be strictly horizontal.
This illustrates that the downward trend is coming to an end.
When a Head and Shoulders formation is seen in a downtrend, it signifies a major reversal.
The pattern is confirmed once the price breaches the neckline resistance.
In this example, we can easily see the head and shoulders pattern.
How to Trade the Head and Shoulders Pattern:
ENTRY:
we put an entry order above the neckline.
TARGET:
We can also calculate a target by measuring the lowest point of the head to the neckline.
This distance is approximately how far the price will move after it breaks the neckline.
❤️ If you find this helpful and want more FREE forecasts in TradingView
. . . . . Please show your support back,
. . . . . . . . Hit the 👍 LIKE button,
. . . . . . . . . . Drop some feedback below in the comment!
❤️ Your Support is very much 🙏 appreciated! ❤️
💎 Want us to help you become a better Forex trader ?
Now, It's your turn !
Be sure to leave a comment let us know how you see this opportunity and forecast.
Trade well, ❤️
ForecastCity English Support Team ❤️

📚 💰 Descending Triangle in ETHBTC - "Learn More Earn More" 📚 LEARN MORE
💰 EARN MORE
With ForecastCity
Descending Triangle Definition:
An Descending Triangle is a type of triangle chart pattern that occurs when there is a support level and a slope of lower high .
It is defined by two lines:
. A horizontal support line running through valleys.
. A Downtrend line drawn through the peaks.
The lower highs indicate more sellers are gradually entering the market and selling pressure increases as price consolidates moving further towards the apex.
An Descending Triangle is classified as a continuation chart pattern.
If price can break through the support level, that level will now act as a resistance level.
Breakouts can also happen in both directions. Statistically, downward breakouts are more likely to occur, but upward ones seem to be more reliable.
In most cases, the sellers will win this battle and the price will break out past the support. But Sometimes the support level is too strong, and there is simply not enough selling power to push it through. Therefore you should be ready for movement in EITHER direction.
ENTRY:
We would set an entry order bellow the support line and above the slope of the lower highs.
TARGET:
Target is approximately the same distance as the height of the triangle formation.
❤️ If you find this helpful and want more FREE forecasts in TradingView
. . . . . Please show your support back,
. . . . . . . . Hit the 👍 LIKE button,
. . . . . . . . . . Drop some feedback below in the comment!
❤️ Your Support is very much 🙏 appreciated! ❤️
💎 Want us to help you become a better Forex trader ?
Now, It's your turn !
Be sure to leave a comment let us know how you see this opportunity and forecast.
Trade well, ❤️
ForecastCity English Support Team ❤️

How to use inverted chart in analyzing the pairTradingview has offer us a inverted chart tool which is extremely helpful in finding the trend in another point of view. In simple terms we can define Inverted chart is USDEUR and the normal chart is EURUSD. We may think that the trend going to reverse on particular point but if we see through the inverted scale it will shows us continuation of the trend. Use this tool wisely and have a happy trading..

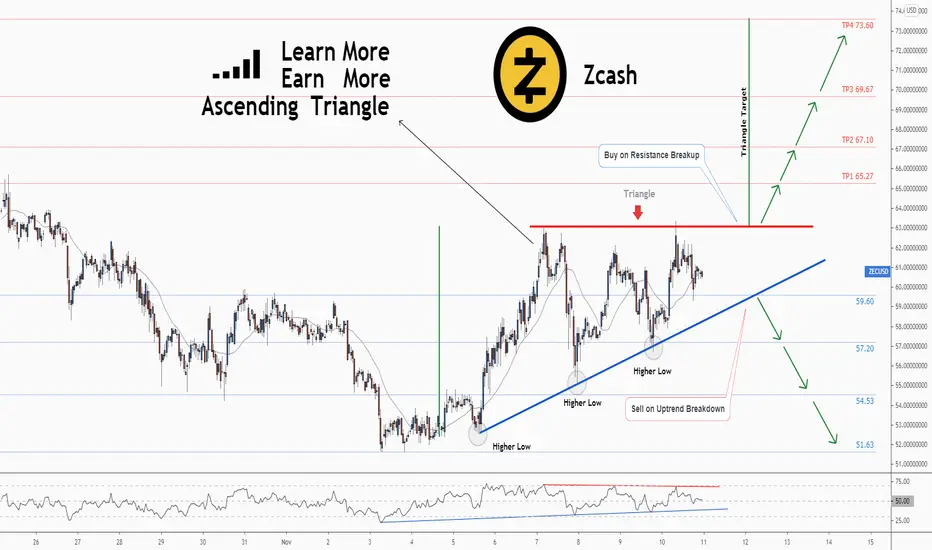
💡Ascending Triangle in ZECUSD - "Learn More Earn More" With USAscending Triangle Definition:
An ascending triangle is a type of triangle chart pattern that occurs
when there is a resistance level and a slope of higher lows .
It is defined by two lines:
. A horizontal resistance line running through peaks.
. An uptrend line drawn through the bottoms.
The higher lows indicate more buyers are gradually entering the market
and buying pressure increases as price consolidates moving further towards the apex.
An ascending triangle is classified as a continuation chart pattern .
If price can break through the resistance level, that level will now act as a support level.
Breakouts can also happen in both directions. Statistically,
upward breakouts are more likely to occur, but downward ones seem to be more reliable.
In most cases, the buyers will win this battle and the price will break out past the resistance.
But Sometimes the resistance level is too strong,
and there is simply not enough buying power to push it through.
Therefore you should be ready for movement in EITHER direction.
ENTRY:
We would set an entry order above the resistance line and below the slope of the higher lows .
TARGET:
Target is approximately the same distance as the height of the triangle formation.
❤️ If you find this helpful and want more FREE forecasts in TradingView
. . . . . Please show your support back,
. . . . . . . . Hit the 👍 LIKE button,
. . . . . . . . . . Drop some feedback below in the comment!
❤️ Your Support is very much 🙏 appreciated! ❤️
💎 Want us to help you become a better Forex trader ?
Now, It's your turn !
Be sure to leave a comment let us know how you see this opportunity and forecast.
Trade well, ❤️
ForecastCity English Support Team ❤️
💡Ascending Triangle in USDTRY - "Learn More Earn More" With USAscending Triangle Definition:
An ascending triangle is a type of triangle chart pattern that occurs
when there is a resistance level and a slope of higher lows .
It is defined by two lines:
. A horizontal resistance line running through peaks.
. An u ptrend line drawn through the bottoms.
The higher lows indicate more buyers are gradually entering the market
and buying pressure increases as price consolidates moving further towards the apex.
An ascending triangle is classified as a continuation chart pattern.
If price can break through the resistance level , that level will now act as a support level .
Breakouts can also happen in both directions. Statistically,
upward breakouts are more likely to occur, but downward ones seem to be more reliable.
In most cases, the buyers will win this battle and the price will break out past the resistance.But Sometimes the resistance level is too strong, and there is simply not enough buying power to push it through. Therefore you should be ready for movement in EITHER direction.
ENTRY:
We would set an entry order above the resistance line and below the slope of the higher lows.
TARGET:
Target is approximately the same distance as the height of the triangle formation.
❤️ If you find this helpful and want more FREE forecasts in TradingView
. . . . . Please show your support back,
. . . . . . . . Hit the 👍 LIKE button,
. . . . . . . . . . Drop some feedback below in the comment!
❤️ Your Support is very much 🙏 appreciated! ❤️
💎 Want us to help you become a better Forex trader ?
Now, It's your turn !
Be sure to leave a comment let us know how you see this opportunity and forecast.
Trade well, ❤️
ForecastCity English Support Team ❤️

💡Ascending Triangle in GBPNZD- "Learn More Earn More" With USAscending Triangle Definition:
An ascending triangle is a type of triangle chart pattern that occurs
when there is a resistance level and a slope of higher lows .
It is defined by two lines:
. A horizontal resistance line running through peaks.
. An uptrend line drawn through the bottoms.
The higher lows indicate more buyers are gradually entering the market
and buying pressure increases as price consolidates moving further towards the apex.
An ascending triangle is classified as a continuation chart pattern .
If price can break through the resistance level, that level will now act as a support level.
Breakouts can also happen in both directions. Statistically,
upward breakouts are more likely to occur, but downward ones seem to be more reliable.
In most cases, the buyers will win this battle and the price will break out past the resistance.But Sometimes the resistance level is too strong, and there is simply not enough buying power to push it through. Therefore you should be ready for movement in EITHER direction.
ENTRY:
We would set an entry order above the resistance line and below the slope of the higher lows .
TARGET:
Target is approximately the same distance as the height of the triangle formation.
❤️ If you find this helpful and want more FREE forecasts in TradingView
. . . . . Please show your support back,
. . . . . . . . Hit the 👍 LIKE button,
. . . . . . . . . . Drop some feedback below in the comment!
❤️ Your Support is very much 🙏 appreciated! ❤️
💎 Want us to help you become a better Forex trader ?
Now, It's your turn !
Be sure to leave a comment let us know how you see this opportunity and forecast.
Trade well, ❤️
ForecastCity English Support Team ❤️

How to take advantage of a trade multiple times? Check it out!Hi guys!
Just published my very first educational post, I hope you will like it!
This is a trade which I took yesterday and I thought it would be interesting to "dissect" it into 4 steps in order to understand why and when is the "best" moment to buy and/or to sell.
I have incorporated the explanations in my chart.
Please note that this is an "ideal" trade and it doesn't happen like that all the time... but it gives you an idea of how I analyze it.
Feel free to comment/like it if you find it valuable!

Ascending Triangle in USDCAD - "Learn More Earn More" With USUSDCAD is coiling for its next move.
The higher lows suggest strength, but USDCAD needs to secure a close above 1.34200 to open the door to the 1.35000 area.
Keep an eye on 1.33720 in the event of a pullback.
❤️ If you find this helpful and want more FREE forecasts in TradingView
. . . . . Please show your support back,
. . . . . . . . Hit the 👍 LIKE button,
. . . . . . . . . . Drop some feedback below in the comment!
❤️ Your Support is very much 🙏 appreciated!❤️
💎 Want us to help you become a better Forex trader?
Now, It's your turn!
Be sure to leave a comment let us know how do you see this opportunity and forecast.
Trade well, ❤️
ForecastCity English Support Team ❤️

Rising Wedge - "Learn More Earn More" with usWhat makes the chart interesting today is that:
. BTCUSD challenging the Wedge's UpTrend.
. A break bellow Wedge's UpTrend could push the pair to its $10,400 ~ $10,500 previous support areas.
. A rejection at the Wedge's UpTrend, however, could lead to another retest of the Wedge's top.
Will the BTC see an downside breakout against the USD?
No one knows it! We have to wait and see!
Learn More,
Earn More,
With ForecastCity!

Rising Wedge - "Learn More Earn More" with usWhat makes the chart interesting today is that:
BTCUSD challenging the Wedge's UpTrend.
A break bellow Wedge's UpTrend could push the pair to its $10,400 ~ $10,500 previous support areas.
A rejection at the Wedge's UpTrend, however, could lead to another retest of the Wedge's top.
Will the BTC see an downside breakout against the USD?
No one knows it! We have to wait and see!
Learn More,
Earn More,
With ForecastCity!
