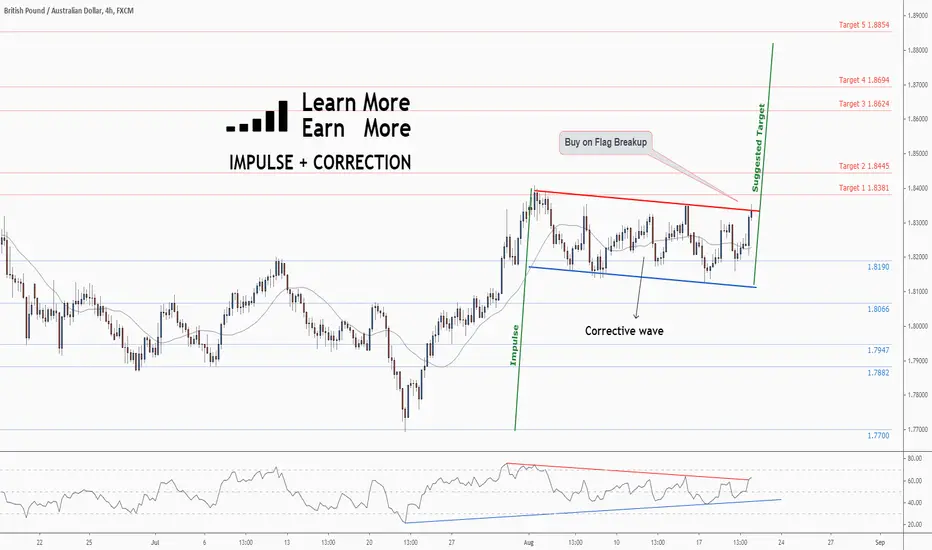
FLAG = Impulse + Correction - "Learn More Earn More" with usWhat makes the chart interesting today is that:
. GBPAUD challenging the 1.8415 ~ 1.8450 resistance zone.
. Min 450 pips room to run. A break above 1.8450 could push the pair to its 1.8900 previous areas of interest.
. A rejection at the Flag range resistance, however, could lead to another retest of the Flag’s support.
Will the GBP see an upside breakout against the AUD ?
No one knows it! We have to wait and see!
Educationaltrade
IMPULSE + CORRECTION in Gold - "Learn More Earn More" With USThe market makes an impulse then makes a correction before making the impulse again.

Ascending Triangle in Bitcoin - "Learn More Earn More" With USBitcoin is coiling for its next move.
The higher lows suggest strength, but BTC needs to secure a close above $12,100 to open the door to the $13,000 area.
Keep an eye on $11,600 in the event of a pullback.
❤️ If you find this helpful and want more FREE forecasts in TradingView
. . . . . Please show your support back,
. . . . . . . . Hit the 👍 LIKE button,
. . . . . . . . . . Drop some feedback below in the comment!
❤️ Your Support is very much 🙏 appreciated! ❤️
💎 Want us to help you become a better Forex trader ?
Now, It's your turn !
Be sure to leave a comment let us know how do you see this opportunity and forecast.
Trade well, ❤️
ForecastCity English Support Team ❤️
Ascending Triangle in Bitcoin - "Learn More Earn More" With US

EUR/USDBriefly and clearly.
We can observe that we are on a very strong support (since July 2008) and, in my understanding, there is the possibility of a strong reversal, as traders have been draining the dollar for several months ... (a clear drain can be observed in the USD/CHF pair.)
In my understanding, big players will buy the dollar and close their positions that they opened against the US dollar.
In fact, there are no prerequisites for buying the dollar and the index of the dollar itself broke through a week earlier its strong support level ... there is one assumption - they knock out stops at longs ... and I think that major part of small traders have already entered the shorts for the dollar and accordingly the hedge funds will have work for the month of August to knock us out again.
The chart shows that there was a breakthrough, but according to the monthly chart, we see a pullback. This month this is the last day of trading so before the market closes, you can even sell the pair and make some money in short-term trading.
In general, I don't want to complicate things with all sorts of indicators and other inserts on the chart, because I support the idea of simple trading.
Write comments and like.
I don't force anyone to trade and all positions that you open, you do it at your own risk. This post contains the opinion of the author.
Have a great weekend.

BTC BREAKOUT OR FAKEOUT?Is amazing to see BTC finally manage to enter the red zone, BTC has been in front of the doorstep three-time( 26/10/2019, 11/02/2020, and 01/06/2020) and unfortunately, BTC backed away.
And I just missed the chance to long BTC, and on a dilemma to take any trade on BTC.
I am still skeptical the BTC will passthrough this red zone and reach another high.
Why? Because:
1. The volume of BTC breaking the Triangle Pattern is so low ( it could be a potential Fakeout)
2. The MACD, although we have a crossover, look at how weak it is.
3. The RSI, if we are on the Overbought zone I would be glad because it indicating the trend is strong.
4. There is no best support to put on.
Thus, I would pass the current opportunity to take any entry, I would rather wait for it pass through this red zone taking entry around 11,4k. IF BTC goes close above the red zone we could put SL on 10k which is the optimal support for the current potential bull run.
We could short on the current price, right? Nah I pass too.
Is tempting but is really really risky, I don't see signs of exhaustion from the bull yet, the bull run is still legit, and taking short is just like standing in front of a rampage, waiting to be killed.
Shorter be patient, be careful of a rampage.

BTC/USD The Forgotten Triangular Pattern I am sure everyone knows BTC is about to make a huge move. From May till June even on the current moment BTC/USD is moving very slow and getting less and less volatile. BTC halving is already over is and is going to moon right? 24k here we come!!
Here is a warning!!
BTC is still within a strong triangle pattern, and still, in a strong downward pattern market, you can see in the chart I made the triangle pattern started to form at the end of 2017 and yet to be broken. I ain't optimistic about BTC/USD could break the triangle in short-team (now and in the near months).
Zoom in and looking at the 1D Chart:
BTC has attempted to break 10k area and hasn't succeeded yet, the 10k area remains as the strong resistance before BTC Moon. And I am really pessimistic about BTC's ability to break it now.
Here my reason; From the RSI the bear in on a steady pace controlling the market, as the RSI keeps on decreasing the bear get stronger, which only makes BTC weaker to break the 10k resistance. Also, capital seems to get out from BTC, less $$$ in more $$$ out, in other word market are not interested in buying BTC anymore, and selling it. Just take a look at the BTC Dominance Chart.
Hence I suggest keeping an eye out for the Altcoins market, Altcoins season seems to be nearing, and start to build short setup for BTC.
The last question from me, Are we now on a consolidation phase for an upward trend or we had reached the exhaustion point of the upward trend?
Share your answer with me on the comment section below, and like the post for more upcoming analysis for BTC or Altcoins.

Simple Way to Trade Bull FLag Pattern Very Simple process to trade Bull Flag pattern as i mentioned that how we can capitalized.
Like and Share
ThankYou

GBP/CHF : Strong Buy Trade Forecastafter bullish engulfing candlestick pattern can Buy on Confirmation.
ThankYoU

EURUSD possible shorting opportunity Disclaimer don't listen to me, i am a demo trader that has no useful knowledge to spread:
This situation seems to be a clear reversal signal given by the market maker in order to induce the typical retail traders in the wrong direction. As you can see on EUR/USD, the movement has been mainly in the bullish (upwards) direction, we have reached a new high and this means many types of retail traders have entered the market (such as break out traders, the trend is your friend traders, support resistance trader and moving average traders < these are the people we call the 95%). At position 1 (which i have annotated) the majority of these traders will have entered a long position for their respective reasons, the market maker/ banks benefit by making the majority lose money therefore they will move the chart away in the direction of the large pool of stop losses at position 2 (which i have annotated). Not only does the market maker stop out the traders going long, they also activate any pending short orders (sell stops) at position 2; this gives the market maker the liquidity to move back in the long/ bullish direction up to position 3 (remember every time someone is buying there has to be someone selling). This second spike into the long position gives more traders an incentive to go long. Once enough people go long (this means the bank is going short) and liquidity is built up, the market maker can then reverse the chart into the opposite direction to the majority of traders. This is what we call an 'M' formation.
Don't listen to me, this post is for my own purpose.

GOLD, From 1150 to 1750 !! What happened?OANDA:XAUUSD
To see more clearly the explosion of the price of gold it is necessary to look at the Andrews's Pitchfork.
Indeed you just have to wait for confirmation of a rebound or a break to enter either SELL or BUY as shown on the graph! A principle that is simple but very effective as you can see!
The fork is a tool to integrate to better analyze!
If
For those who do not know how to use it please click here www.waldata.fr
If you agree with this idea please leave me a like and don't forget to subscribe!

HOW I TRADE - ZONE TO ZONE - TRENDLINES Hi Guys! Today I take you through a quick look at how I trade and use zone to zone trading accommodated with trendlines to get my extra edge on the market. Please if you found this video useful can you please comment and like below and please include what you'd like to see in the future.
Hope this helped! Happy Trading!

USDCHF: Ending Diagonal - Signal for ReversalEnding diagonals are motive wave patterns yet not impulses, as they have two corrective characteristics (wave 4 must always enter the price territory of wave 2). ED's usually take the shape of a wedge and in all cases, they are found at the reversal points of the larger patterns, showing exhaustion of the larger movement. I usually confirm that I have an ending diagonal if I see divergence on the RSI. In many cases, an ending diagonal is usually followed by a strong impulsive move in the opposite direction of the trend.

FOMO Is Real In $REKROne of the biggest problems newbie traders face is FOMO - the fear of missing out.
Case in point is $REKR.
Now, we get in at $1.20 and rode it all the way to $5.50 a share. We saw the resistance at $5.50 and new that was where to exit.
On Stocktwits, a lot of traders are chasing $REKR looking for the next move. In all honesty, the move has already happened.
We got a 358% run in 2 months. For traders to look for more is just pure greed.
What $REKR does here at $4.20 is anyone's guess. We will say the $5.50 resistance is very strong and in going long, where does one put a stop? Below the 20, 50 or 200 day moving averages?
This is too much risk in our opinion and not enough reward.
Traders need to avoid FOMO and look for better trade setups.
That's what we do.
Good luck to all!

Multiple Setups in XAU / XAG - Flags, Support and Resistance- The setups shown in this video are all in Hindsight. I did not take all the setups detailed in the video.
- Learn to train yourself to see these examples by going through Price Action from the past and you will be able to see these form in real time and react accordingly.
Common names people give to thses setups: Supply and Demand, Support and Resistance, Pivot
*All those refer to the same thing. They are all areas where Price is MOST LIKELY TO REACT from since it has react from the area PREVIOUSLY.
Since Price previously has react from an area before, That area will become our area of interest where we look to do business. Upon a retest, we expect Price to react in a similar fashion as the last time.

How to trade Bitcoin with RSI in a bear marketHere's a few helpful tips I have learned trading RSI in a bear market.
Watch for trends and act accordingly. Open shorts at good entry points with a stop loss right above it. If your stop is hit, do not panic. Just admit you were wrong and go long/buy into the trend if the buying volume and price action is strong enough.
For shorting, watch for the RSI bounces. A first bounce below 30 RSI is your trigger point. The second bounce will usually result in a lower low and you can sell there to take profits.
Wait for your buy signal at 60 RSI again (or wherever your pattern fits) and repeat.
For the chart:
Blue boxes = short open boxes.
Red lines = set stop losses above each blue box.
Green boxes at first drop through 30 RSI = trigger boxes to get ready to sell.
Yellow boxes at 2nd bounce after 30 RSI boxes = short close.
Go long if stop is hit and if buying volume/price action is strong.

EDUCATIONAL GUIDE TO HELP IMPROVE YOU TRADING.. You're welcome xThis simple guide was designed to help aspiring traders understand the structure of the markets. Structure is apparent on all Timeframes so it is imperative that you familiarise yourself with it.
If u have any questions on this topic feel free to msg me x

Couple setups for CNDCouple ideas I see here for CND.
A, you could aim for the low of the range, so around 250 SAT and place your stop loss below the last swing low and look for a target at the top of the range, at around 465 SAT.
B, If you expect it won't tap the low of the range anymore and its prime to break out of the resistance at 465 SAT. You could aim for an entry around 350SAT, Basically the EQ of the green box and look for a target where you expect it will hit first resistance when it breaks out. Because you expect that the green box will hold, you can place your stop loss below that green box, your intended set up would be invalidated when it goes below that area.
C + D, You wait for a break out of the low tranding range and will buy the retest when it retrace back to this level, So around 465 SAT. You don't want to be stopped out right away, so you place your stop loss a bit below the rend line that than turned into support. As target you could aim for 850 SAT and 1190 SAT.

Dont be a D#@K.... its DUCK.. honestly ;p Here we have some really strong support and resistance levels drawn on the chart ( green lines ) They are classed as strong because price touched them and then bounce a number of times ( I will let you figure these out for yourselves... I'm not spoon feeding you ) ;p
You can also see a lovely trend line TL that has been touched more than once, so this is also classed as strong.
Now because these levels an TL are strong a break of any of these could see a big move, again you can see all this on the charts.
When price is these key levels in NO MANS LAND we tend not to take a trade, we will wait for price to retest these levels and wait for a break or a bounce before jumping in a trade. I keep saying it and I will keep saying it until you get p#@sed off with me...... but patients is key!!!!!!!
Get the larger timeframe charts up ( we like to use 1 day and 4H charts ) and zoom all the way out... this will make spotting these levels so much easier.
So don't be a D@#k and practise this... it will make you a more profitable trader.
I hope this has helped you.

Dont be a D#@k... its DUCK honestly ;p Here we have some really strong support and resistance levels drawn on the chart ( green lines ) They are classed as strong because price touched them and then bounce a number of times ( I will let you figure these out for yourselves... I'm not spoon feeding you ) ;p
You can also see a lovely trend line TL that has been touched more than once, so this is also classed as strong.
Now because these levels an TL are strong a break of any of these could see a big move, again you can see all this on the charts.
When price is these key levels in NO MANS LAND we tend not to take a trade, we will wait for price to retest these levels and wait for a break or a bounce before jumping in a trade. I keep saying it and I will keep saying it until you get p#@sed off with me...... but patients is key!!!!!!!
Get the larger timeframe charts up ( we like to use 1 day and 4H charts ) and zoom all the way out... this will make spotting these levels so much easier.
So don't be a D@#k and practise this... it will make you a more profitable trader.
I hope this has helped you.
'

MUCKY FILM TIME...Old strong resistance turned new support and TL been used as good support also, price is currently sat at both of these so we can only see price movement to the upside.
A double setup where 2 things confirm it is a good trade to take cant be ignored, look at it like this.... You are looking for a film to watch ( not a mucky adult 1 ) ;p you come across a film but you cant decide weather you think it will be any good so you ask Tom and he says its good, but you still are not sure so you ask Jess... she also says its good so because 2 people backed it up ( support and trend line ) you decide to watch it... the film ends and.... you hated it and wasted 2 hours of your life you cant get back so you loose 2 friends haha, only joking. You watched the film and love it :) but it was only because of your 2 friends backing it up ( support line and trend line ) you saw it.
So when you see a double setup that fits in you trade setups don't ignore it.

BROKERS ARE BAST@RDSblue arrow marks a 360 pip manipulation spike, these are used by brokers to wipe out peoples trades who have set orders or have SL set around key support or resistance areas, its easy money for the brokers!
You can see how much of a key area this price was from our orange arrows pointing out where price entered the box and bounced using it as support, now the sneaky, slimy little brokers would have seen this lovely key level formed and knew that loads of people would be setting orders or SL around this area and they would be rubbing there grotty hands together because they were getting ready to manipulate the market and wipe everyone's trades out.
You can spot manipulation spikes easy because all they are is a unusually long shadow of a candle that form in the opposite way to the trend of the market, after this spike the price will come back to the market and carry going with the trend.
To sum it up brokers are BAST@RDS.

BUYING A HOUSE?We are waiting to see if todays candle closes above or below this key resistance level, you can see how strong this level is by where price has previously touched this level and then bounced, But we think price will bounce and make further movement to the downside.
You could look at this the same way as buying a house, would you jump in and buy the house straight away, or would you get the house checked out and check the foundations are ok by professionals to make sure nothing is up with it?
Same applies to support and resistance levels, you must wait to see if price breaks or bounces off them so you can assure the foundations of the trade are stable! After all you don't want to buy a dodgy house that will end up costing you money... and you don't want to go placing a dodgy trade that will also cost you money.
So do your research before doing anything!

Walk the plank.......( circled ) here you are in no mas land half way in-between strong support and strong resistance, would you open a trade here? if you said YES then you really are gambling and should go to a casino, just ask yourself why would you throw money away on a trade that could go either way? you may as well put your money on RED or BLACK.
You have to be patient and wait for a retest of either support or resistance or set some orders around these levels so you can catch a good trade, you really need good self control in trading or it will f#@k you up.
Just remember you don't always need to have a trade open on your account, We have gone weeks without trading before either due to in correct market conditions, all our criteria's for taking a trade not been met or just down to personal circumstances, if you are not in the correct mind-set you will not make good trades, so step away from the markets until your head is straight.
I hope you take this on board... if not you will go over board hahaha you will walk the markets pirate plank... How can a plank walk the plank you ask yourself ;p
