EGLD Breaks Key Downtrend – Is This the Beginning?📊 Detailed Technical Analysis (Daily Timeframe):
🔍 1. Market Structure & Chart Pattern
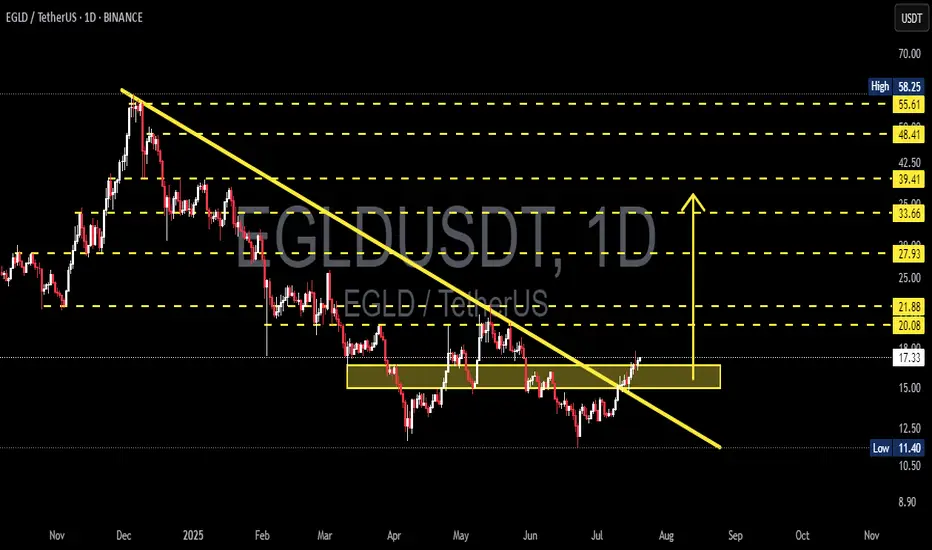
Major Downtrend Line Breakout – Reversal Signal:
After being stuck under a persistent downtrend for nearly 9 months, EGLD has officially broken out of the descending trendline, signaling a potential shift from distribution to expansion phase. This breakout is significant and could mark the beginning of a new bullish trend.
Double Bottom + Accumulation Range:
Price action shows a clear double bottom formation within the $13.00–$16.50 range, which acted as a strong accumulation zone. This horizontal structure suggests buyers have been silently accumulating before triggering this breakout.
Resistance Turned Support (RBS):
The breakout is now being retested around the $17 level. If EGLD holds this area, it would confirm a support flip, which is a classic bullish signal. Holding above this zone would give bulls full control over the next moves.
🟢 2. Bullish Scenario (Base Case):
If the breakout sustains with increasing momentum:
✅ Short-Term Targets:
$20.08 and $21.88 – minor historical resistance levels.
✅ Mid-Term Targets:
$27.93 and $33.66 – key levels aligning with measured move targets and Fibonacci retracements.
✅ Long-Term Targets:
$39.41, $48.41, up to $55.61–$58.25 – previous key highs and psychological zones.
💡 If EGLD successfully retests and holds above $17.00, it presents a strong opportunity for trend-following entries with favorable risk-reward.
🔴 3. Bearish Scenario (Alternative Case):
If this breakout fails (false breakout scenario):
⚠️ Price could fall back into the previous accumulation range between $13.00–$15.50.
A breakdown below that range could drag EGLD further down toward $11.40, or even $10.00 – a crucial long-term support zone.
Lack of volume or weak bullish confirmation would be early signs of a failed breakout.
🧠 4. Sentiment & Broader Context:
🌐 This breakout comes at a time when altcoin capital rotation is starting to emerge as BTC dominance cools off.
🚀 EGLD, as a smart contract platform, historically performs well during altseason waves and ecosystem narratives.
✅ Final Thoughts:
> EGLD has printed a significant breakout from long-term bearish control. With accumulation completed and momentum building, this may be the beginning of a bullish cycle. However, staying above the $17 level is the key validation to confirm this trend reversal.
#EGLD #EGLDUSDT #CryptoBreakout #AltcoinSeason #TrendReversal #CryptoAnalysis #TechnicalAnalysis #BullishSetup #DoubleBottom
Egldusd
EGLDMultiversX
Egld usdt Daily analysis
Risk rewards ratio >2.2 👈👌
Pattern = two bottoms
First target =21.3$

EGLDUSDT 1D AnalysisEGLD ~ 1D Analysis
#EGLD Buy back gradually from here if you still have confidence in this coin with a short term target of at least 15%+ from here.

EGLD - MultiversX - Possible Bullish WaveEGLD - Never traded this coin but looks like an entry point is available. Fallen barely outside the Ascending Parallel Price Channel. Estimate of 3 weeks for recovery back to the dotted white average line inside the channel near $21.61 for a 35% possible gain.
As you can see when Bearish SuperTrend is showing red it stays red for months but when it flips to Bullish Green it produces great gains.
Was Descending for about 4 months before forming this current Ascending channel which started beginning of April.

Bullish outlook for MultiversX (EGLD) | Eyes 40% to 100% surgeBullish outlook for MultiversX base token, egold (EGLD)
Since April 25, CRYPTOCAP:EGLD has been trading above a key trend indicator — closing 27 days above the S/R 1D50EMA, with a 6-day deviance below that line.
The 50-day exponential moving average has played a significant role for the token, indicating short- and mid-term trends and market sentiment for egold and the MultiversX chain.
This current behavior signals strength and a rising positive sentiment. I wouldn't be surprise with a sudden run to each of the previous touching points: $25.5 and $37, making 40% to 100% from the current $18.2.
Despite the targets, trading and closing all these days above the 1D50EMA marks a significant trend shift after nearly 5 months trading below this average (bearish), followed by a massive negative sentiment in the MvX ecosystem.
Things are changing in a great timing with the Andromeda upgrade activation — the biggest release for MultiversX since the mainnet launch around five years ago.

#EGLD/USDT#EGLD
The price is moving within a descending channel on the 1-hour frame, adhering well to it, and is heading for a strong breakout and retest.
We are seeing a rebound from the lower boundary of the descending channel, which is support at 16.80.
We have a downtrend on the RSI indicator that is about to be broken and retested, supporting the upward trend.
We are looking for stability above the 100 moving average.
Entry price: 17.32
First target: 17.65
Second target: 18.55
Third target: 19.45

#EGLD/USDT#EGLD
The price is moving within a descending channel on the 1-hour frame and is expected to continue upward.
We have a trend to stabilize above the 100 moving average once again.
We have a downtrend on the RSI indicator that supports the upward move with a breakout.
We have a support area at the lower boundary of the channel at 17.19.
Entry price: 17.82
First target: 18.26
Second target: 18.76
Third target: 19.40

EGLDUSDT 1D AnalysisEGLD ~ 1D Analysis
#EGLD Buy after successfully penetrating this resistant line with a short -term target of at least 10%+.

EGLD's situation+ Target PredictionThe EGLDUSDT is in a Bullish phase by a Falling Wedge Pattern.
-A falling wedge indicates the potential for price to reach to $23.
Note if the Wedge Pattern is broken downwards with the strength of Bearish candles , this analysis of ours will be failed.
Give me some energy !!
✨We spend hours finding potential opportunities and writing useful ideas, we would be happy if you support us.
Best regards CobraVanguard.💚
_ _ _ _ __ _ _ _ _ _ _ _ _ _ _ _ _ _ _ _ _ _ _ _ _ _ _ _ _ _ _ _
✅Thank you, and for more ideas, hit ❤️Like❤️ and 🌟Follow🌟!
⚠️Things can change...
The markets are always changing and even with all these signals, the market changes tend to be strong and fast!!

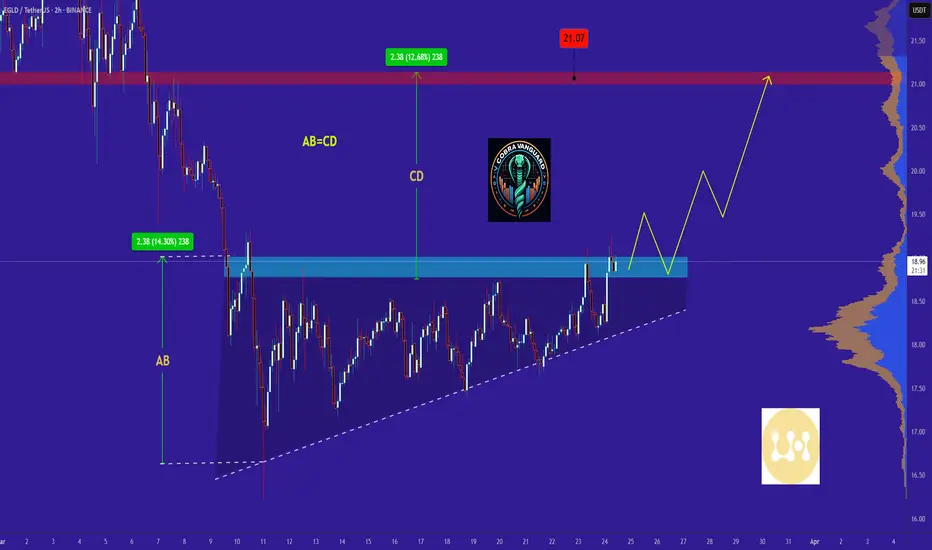
EGLD in coming days ...Currently, EGLD is forming an ascending triangle, indicating a potential price increase. It is anticipated that the price could rise, aligning with the projected price movement (AB=CD).
However, it is crucial to wait for the triangle to break before taking any action.
Give me some energy !!
✨We spend hours finding potential opportunities and writing useful ideas, we would be happy if you support us.
Best regards CobraVanguard.💚
_ _ _ _ __ _ _ _ _ _ _ _ _ _ _ _ _ _ _ _ _ _ _ _ _ _ _ _ _ _ _ _
✅Thank you, and for more ideas, hit ❤️Like❤️ and 🌟Follow🌟!
⚠️Things can change...
The markets are always changing and even with all these signals, the market changes tend to be strong and fast!!
EGLD Roadmap (3D)From the point where we placed the red arrow on the chart, it seems that the correction of EGLD has begun.
This correction appears to be a diamond-shaped diametric, and we are currently in wave G of this diametric, which is a bearish wave.
We expect wave G to complete within the green zone, leading to a trend reversal for several months in EGLD.
A daily candle closing below the invalidation level will invalidate this analysis.
For risk management, please don't forget stop loss and capital management
Comment if you have any questions
Thank You

EGLDUSDT 1WEGLD ~ 1W Analysis
#EGLD This is the lowest support for now. Buy from here if you still have a Conviction on this coin with a minimum target of 20%+

EGLD (MultiverseX) - AltSeason Cycle - Bull RunBINANCE:EGLDUSD (#MultiverseX) is ready to jump.
That's because the #AltSeason shall push #AltCoins to the limits.
Its Market Cap ( CRYPTOCAP:EGLD ) is very low now and about to grow significantly.
This will be the result of #Crypto #MarketCap ( CRYPTOCAP:TOTAL3 & CRYPTOCAP:OTHERS ) breaking through their #ATH.
With #BitcoinDominance ( CRYPTOCAP:BTC.D ) showing signs of #Correction, #eGold should prevail.
What Happened with BINANCE:EGLDUSDT ?
#EGLD managed to spike a bit in the end of '23, thus confirming the start of a larger #Bullish #Cycle.
#Correction is also complete (Q4 in '24), which leaves room for the Bull.
What's next for BINANCE:EGLDUSD ?
An Impressive Rise is expected for $EGLD.
The current levels are to be watched closely by #Traders going #Long.
#MultiverseX #TechnicalAnalysis
- #ElliottWave A-B-C Sequence: Confirmed
- Intermediate (A) & (B) (white): Complete
- #Bullish #Fractal: Commenced
- #Fibonacci Levels: Conditions Met
My BINANCE:EGLDUSDT #Long Levels
#HODL #Trade:
- Entry @ 31.00 USD (or below)
- TP @ 420.00 USD
#Futures #Trading:
- Entry @ 31.00 USD (or below)
- SL @ 10.00 USD
- TP @ 225.00 USD


EGLDUSDT 1WEGLD ~ 1W
#EGLD So far it still maintains this support Block. if you still have Conviction on this coin,. Buy in stages from here. minimum target 20%+

EGLD, Diamond pattern = ready for more upsisde?The price of EGLD has successfully broken out of its downward parallel channel, which lasted from April to November 2024. After reaching a high of around $55, the price retraced, giving back some of its earlier gains, but is now holding above the $30 support level.
Although the price faced significant selling pressure, it has remained above the previous range and the downward trendline (now acting as support).
From January 3 to January 6, the price attempted to break above the range but fell back to the lows of the range. Since then, a diamond pattern has emerged on the 1H and 4H timeframes, signaling a potential bullish reversal. If the price holds above $32, the diamond pattern remains valid, and a move to the upside is anticipated. This could lead to a retest of the range’s upper range around $40. A successful breakout may push the price towards higher resistance levels at $45–$55 and $75–$78.

#EGLD/USDT Ready to launch upwards#EGLD
The price is moving in a descending channel on the 1-hour frame and sticking to it well
We have a bounce from the lower limit of the descending channel, this support is at 33.25
We have a downtrend on the RSI indicator that is about to break, which supports the rise
We have a trend to stabilize above the moving average 100
Entry price 35.32
First target 37.00
Second target 38.50
Third target 40.13

EGLDUSDT - Real project with real targetlet's know about the EGLD project
EGLD (MultiversX) is a fast, scalable blockchain designed for dApps, DeFi, and metaverse projects.
It aims to power next-gen decentralized ecosystems while competing with platforms like Solana and Ethereum.
CHART , TA
weekly chart displays a breakout of falling wedge pattern without retest ... it's extremly bullish sign
clear the red rectangle is important to continue going up ... target is 280$
Best Regards Ceciliones

EgldMultivers X
Egld usdt Daily analysis
Time frame 4 hours
Risk rewards ratio >2
Target 41$
We have a very very strong resistance area in 40-44$
(Brown boxes in chart )
If Egld can break this resistance, it will move up to 50$

#EGLD/USDT#EGLD
Our price is moving in a bearish channel on the 12-hour frame and has just crossed it to the upside perfectly.
We have a bounce from the lower border of the channel from the green support area at 27.00
We have a tendency to stabilize above the Moving Average 100
Entry price is 27.00
First goal 34.24
The second goal is 40.00
Third goal 46.27

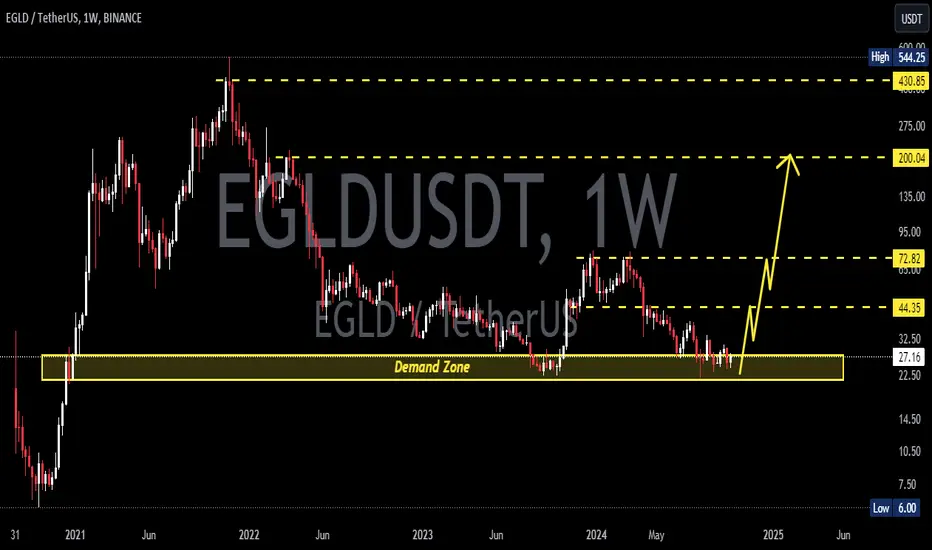
EGLDUSDTEGLD ~ 1W
#EGLD so far maintaining this demand zone.
Make purchases in stages with a short term target of at least 20%+ from here.

EGLDUSDTEGLD ~ 1W
#EGLD so far maintaining this demand zone.
Make purchases in stages with a short term target of at least 20%+ from here.

EGLDUSDTEGLD ~ 1W
#EGLD so far maintaining this demand zone.
Make purchases in stages with a short term target of at least 20%+ from here.