Recap Egypt has bullish indicatorsDaily chart,
I expect the price EGX:REAC will continue to form a triangle chart pattern.
Technical indicators RSI and MACD are positive, and showing a bullish movement - i.e. A soon breakout
However, I think after a rally of 7 consecutive green candlesticks, a minor correction should happen to test the support line S.
Then, a rebound to test the upper resistance line R. The breakout can be around 8.50 - 5.45
After crossing R (and stabilizing for 2 days with high volume), the target will be 10.90 passing through a resistance level at 9.35
Stop loss below 8.40 should be considered.
2nd Scenario : Direct crossing up, no correction, and the target will be 11.25
Raise the stop loss / profit protection level as the price goes up.
Egx

KRDI Egypt is expected to target 0.750 after crossing 0.608Daily chart,
The stock EGX:KRDI is rebounding to enter the rising channel. Once above the rising trend line (around 0.607), the target will be 0.750 to 0.760 passing through resistance level at 0.658
Technical indicators:
RSI: positive
MACD: About to cross up the signal line
Entry (buy) can be made now at 0.590 - 0.597, and consider a stop loss below 0.580
Safer to enter above 0.608 after the breakout (crossing up) confirmation.

Misr Cement Qena should target 29.5 then 36.0 and 38.0Daily chart,
the stock EGX:MCQE has formed a triangle chart pattern, and the target is 36.0 then 38.0
29.5 and 32.9 are resistance levels.
Technical indicator MACD is positive and crossed its signal line.
RSI is showing a probability to have a minor correction before resuming the bullish movement.
Closing below 26.5 - 26.0 for 2 days should be a stop loss level on the daily time frame.
Note : New buy entry after 28.8 (2 days close) or around the support zone 26.5 - 26.0

TAQA Arabia Egypt - To target 13.2 after crossing ResistanceDaily chart,
the stock EGX:TAQA is trading in a rising channel, the price reached the support and is supposed to rebound upwards to target the Resistance line R at around 13.25
Consider the new entry Buy above 12.25 (2 days close) for more safety, or buy in parts down to 12.0
Stop loss below 12.00 (for 2 days) should be considered.
Note:
Closing above the Resistance line R for 2 days, the next target will be 14.3 passing through resistance level at 13.5

Dice Egypt to be monitored for a new entry - Good opportunity!Daily chart, the stock EGX:DSCW broke the lower trend-line of the rising wedge pattern. So, technically this bearish movement should test the pattern target 2.15
However, there are near relatively strong support cushion at 2.45 - 2.42, then a support level at 2.24
A new entry (buy) can be made after 2 days close above 2.51 with high volume, to target 2.75 to 2.80 (then 3.05)
Stop loss below 2.40 should be considered.

Arab Moltaka Egypt can be an investment to 4.90Weekly chart, EGX:AMIA
The price crossed up a major resistance line R, and is testing it.
In case of trading above 3.06 with high volume for 2 weeks, the target will be 4.90 passing through strong resistance 3.57 (last highest High), then a psychological barrier 4.00
Stop loss below 2.65
Technical indicators:
RSI is on a bullish trend, at 62
MACD is positive

KRDI Egypt is expected to target 0.65 then 0.75Daily chart,
the stock EGX:KRDI has been trading above a rising trend line since Oct 2024. I see the price will rebounce from the current level 0.600 to test the resistance line R1.
After crossing R1 line at around 0.650 - 0.658, the next target will be R2 (around 0.750 - 0.760).
Technical indicators: RSI and MACD still need confirmation for a new entry (buy)
Note: A Resistance level at 0.670
Consider Stop Loss below 0.600 (closing)

NEDA Egypt should target 3.65 then 4.25Daily chart,
the stock EGX:NEDA formed a pennant chart pattern and is forming another smaller pattern.
I am expecting some minor correction and consolidation around 3.10
Then, a bullish movement towards the resistance line R, at around 3.64 - 3.67
Stabilizing for 2 days above 3.70, will push the price to the next target 4.25
Note the resistance levels at 3.27, 3.44 , 3.56
(Closing below 3.10 for 2 days should be considered a near stop loss level)

EMFD Egypt should be targeting 9.001-hour chart
The stock, fell from 9.50 to 7.62, and rebounded to 8.60, then it is under minor correction in the bullish direction.
A new entry Buy will be after closing above 8.40 for 2 hours, the target will be 8.70 then 9.00
Also, buying in parts from 8.30 to 8.24 is OK with a higher risk and higher profit.
Consider a stop loss level below 8.23

COMI Egypt can exceed 104 in 6 monthsWeekly chart,
The stock EGX:COMI has formed a symmetrical triangle chart pattern, and crossed the Resistance line R.
One more week above R, to confirm, the target will be 104.3 - passing through several resistance levels as shown on the chart.
A new entry (buy) can be made immediately before confirmation with higher risk, and consider a stop loss below 76.0
Technical indicators RSI and MACD are positive.
NOTE: Keep a near Profit Protection/ Stop Loss level.

RAYA Egypt may go bullish towards 5.30 !Weekly chart,
I see a pre-formation of a widening rising wedge pattern, and the stock EGX:RAYA is preparing to go on a bullish movement towards the upper line R
There is a very strong resistance level at 3.00, then resistance levels at 3.60 and 3.74
(At each resistance level, be careful with your profits!)
The technical confirmation is closing 2 weeks above 2.45 for a new entry (buy)
Long Term Targets 4.00, 4.30, 4.50, 5.00, 5.30
Note: Stop Loss should be considered below 2.30 - 2.27

ICID Egypt - A bullish long-term patternWeekly chart,
The stock EGX:ICID is trading inside a symmetrical triangle pattern between Support and Resistance lines (S and R)
The technical indicator RSI can be seen as drawing the same pattern (waiting for crossing up the R RSI line as a confirmation).
MACD is crossing up its signal line.. However, it is still technically negative.
So, I can expect a new bullish movement towards the Resistance line (at around 4.45)
Crossing up the R line and trading above it for 3 weeks - with high volume, the long term target will be 7.45
NOTE: Consider a near profit protection / stop loss level for this stock, as it is volatile and impulsive!

MM Group Egypt - Quick trading between S & R lines 1-hour chart,
the stock EGX:MTIE is trading in a rising wedge. While this is a bearish chart pattern, we can trade between the support and resistance lines (7.60 - 8.00) for the next few weeks - or until breaking either boundaries.
In case of:
closing 3 hours below line S, the target will be 7.10
closing 3 hours above line R, the target will be 8.66
A near stop loss level should be considered.

Arabian Cement has a potential to 24 then 25.61-hour chart,
the stock EGX:ARCC is trading in a channel, between support level at 22.4 and resistance level at 24.0
The technical indicators RSI, Stochastic are signalling a positive direction towards the upper line R.
Closing above 24.0 for 3 hours with high volume, the next target (TP - Take Profit) will be 25.6
(Fibonacci extension to 26.6)
Consider a stop loss below 22.2

Go Green Egypt: To be Monitored for Rebound!1-hour chart
The stock EGX:GGRN was recently rolled out in the EGX stock market, and fell sharply since then.
It should be monitored for the rebound confirmation signals; to grab the new bullish wave.
Above 1.25 will be a good entry.
However, for higher profit/risk, buy in parts down to 1.15,
then the first sell target will be 1.35
Closing above 1.35 for 3 bars with high volume, the next target will be 1.60
Consider a near profit protection / stop loss level, as this stock is volatile.

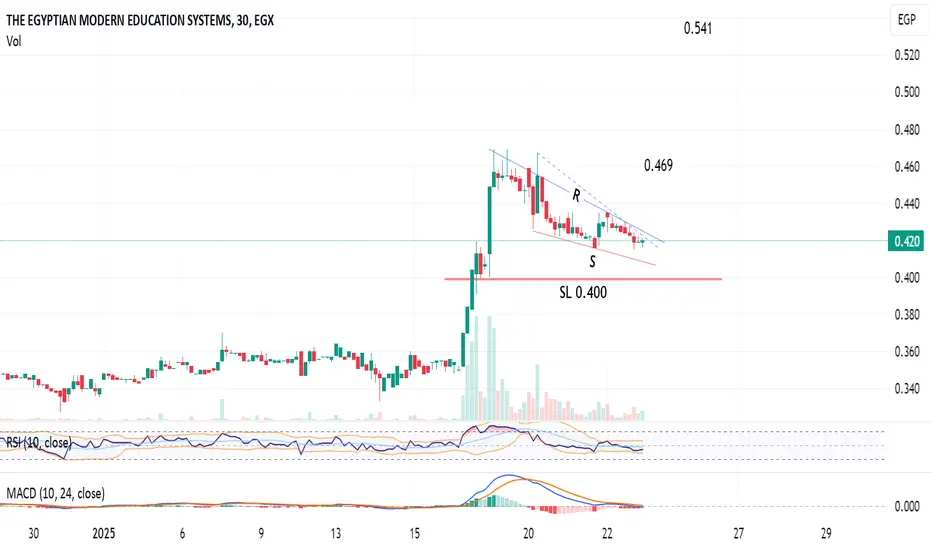
MOED Egypt has a potential for a breakout 0.469 / 0.520 / 0.54130-min chart
The stock EGX:MOED is trading in a falling wedge between R and S lines, and may form a bigger pennant pattern.
We need a confirmation, after closing 3 candles above 0.425, then the target will be 0.469
Above 0.470 for 3 candles, the next target will be 0.520 - extended to 0.541
Consider a near stop loss - and note the important support line at 0.400
RAYA is preparing for a breakout! 30-min chart
The stock EGX:RAYA is preparing to breakout. The next target will be 3.01 then 3.19
The MACD indicator is almost crossing positively.
Current stop loss level is 2.70
Above 3.01 for 3 bars, the next target will be 3.19 then 3.25

Sidi Kerir Egypt has an investment potential to 35 and 52Weekly chart, the stock EGX:SKPC is forming of a descending triangle.
Above the R line - around 19.8, the target will be 33 extending to 35
However, for a more safety, the new entry should be above the 21 level.
On the long term, stabilizing above 38 for 2 weeks, the target will be 50 extending to 52 (as a chart Flag pattern can be considered)
Note: Place and raise a profit protection / stop loss level as the price goes up.

ASPIRE Egypt has a positive uptrendWeekly chart,
The stock EGX:ASPI is trading in an ascending broadening channel.
The target is the upper resisitance line R, at around 0.395, expected in 4 months.
Technical indicators RSI and MACD are supporting this positive view.
Consider a near stop loss / profit protection level - as the stock is volatile.

Emaar Egypt is positively bullishDaily chart,
The stock EGX:EMFD has been consolidating between 7.3 and 8.7 in sideways movement. The current technical indicators RSI and MACD are signalling a positive bullish direction.
After a resistance breakout and stabilizing above 8.7 for 2 days, the target will be 10.11
Consider keeping a near profit protection / stop loss level.

AIH to target 0.92Weekly chart, the stock has crossed the resistance line of the triangle pattern.
Target is 0.92 passing through the shown resistance levels.
Stop loss should be considered.
Technical indicators RSI and MACD are supporting this view.

Faisal Islamic Bank is preparing to breakout !Daily chart, the stock EGX:FAITA is trading in a falling channel, inside a descending triangle.
By closing above Resistance line R (around 0.992) for 2 days, the target will be 1.025
The next weekly target will be 1.06 then 1.15
The next monthly targets will be 1.22, 1.26 extended to 1.55 (long term)
Note: Consider a near stop loss and raise it as the stock price goes up.

Mansourah Poultry, should target 1.30 (then 1.60)Daiy chart, the stock formed chart patterns (Cup & handle - Rising Triangle) and the target will be 1.30 passing through 1.13 and 1.21 resistance levels.
Stabilizing above 1.14 the target 1.60 will be activated.
Technical indicator MACD is positive, while RSI is in over-bought zone; some minor correction may happen before resuming uptrend and crossing next resistance level..
