Waiting a new entry after crossing Resistance line R..Daily chart, I am expecting some zigzag trading inside this triangle pattern between R and S lines.
Positively, the price is still inside the last green candlestick.
After crossing R, the target will be 6.25 then 7.35
Below S, stop loss
Egx

GADWA is preparing to cross the Resistance1-hour chart, I am expecting the stock will beat the Resistance line soon.
After clear crossing of R, the target will be 6.23 passing through a strong resistance at 5.55
Closing 3 hours below support line S, stop loss

Waiting for AMIA to beat Resistance and Target 3.4630-min chart, the stock is trading in the upper side of the falling channel, which indicates higher chance to beat Resistance soon.
Closing above 2.90 for 2 candlesticks, will activate the targets 3.09, 3.25 then 3.46
Stop loss below 2.70

Beltone BTFH in a rising Channel; Awaiting breakout confirmation30-min chart, the stock is trading in a rising channel, testing the lower line, and may do a false break down to the SL level.
After rebounding, the target will be 4.38
Stop loss below SL line.

ATLAS (AIFI) should target 0.875 after stabilizing above 0.545Weekly chart, the stock is trading in the rising channel, and should cross the Pennant pattern Resistance at around 0.543
Stabilizing above 0.545 for one week with high volume, will push the price to target 0.875
Stop loss (SL) line should be considered for the rising stop loss level.

ACAP is preparing to cross the Resistance line RDaily chart, the stock is trying to beat the Resistance line R.
Some correction may happen between 0.618 - 0.600 and rebound afterwards to test the Resistance line R.
Above Resistance line R (crossing at around 0.670), the target will be 0.770 then 0.920
Stop loss below 0.600 should be considered.

ATQA is preparing to beat Resistance1-hour chart, the stock has a high probability to cross the Resistance upwards, forming a triangle pattern, and to target 5.97
The next target will be 7.35 (pennant pattern)
Below Support, targets S2, and stop loss below 4.25

EIUD should target 0.425 after beating Resistance (R)Weekly chart, trading in a falling expanding wedge, high probability to target the Resistance line (R), then cross upwards.
Above Resistance (around 0.308), the target will be 0.425
Above R2 targets R3 (around 0.520)
Raise the profit protection level as the price goes up.. Below 0.230 stop loss
** Be careful with this stock - as it has up and down sudden sprints!

AIFI should target 0.585 after crossing Resistance30-min chart, the stock is trading in a falling wedge.
After crossing up, the target is hitting the resistance line (R) upwards.
After crossing at around 0.520, the target will be 0.585 passing through some resistance levels as shown.
Below 0.503 (support line S) stop loss

ISPH is on critical price zone !Daily chart, the stock may test support S1 then rebound to R1 (a triangle pattern).
MACD is signalling some correction (downwards direction)
After crossing the resistance line R (around 3.67), the target will be 5.25 - Rising Channel pattern
Below S1, the stop loss.

AMIA should target 2.99 then 3.52Daily chart, the stock made a nice breakout to the rising channel, the target is 2.99, then 3.52
However, as the technical indicator RSI is in the over-bought zone, there may be a correction before continuing upwards.
Profit protection level should be dynamically considered as the stock price goes up.

Faisal Islamic Bank (FAITA) should target 1.26Weekly chart, the stock is trading in a rising expanding wedge (semi channel). It should rebound from the Support line (red) towards the Resistance line (blue) to around 1.26 passing through some resistance levels as shown.
Stop loss below Support line.

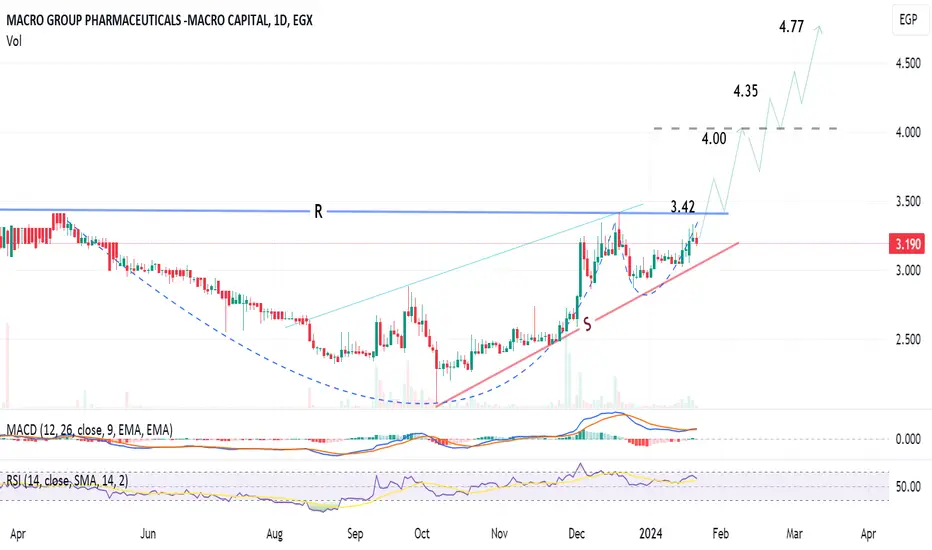
MACRO should target 4.35 then 4.77 after crossing resistanceDaily chart, I am expecting the stock for form the chart pattern Cup & handle.
After crossing the R esistance line, and closing 2 days above 3.45, the target will be 4.77 passing through resistance levels 4.00 and 4.35.
Beltone (BTFH) should target 5.5 after confirming breakoutDaily chart, the pattern triangle was formed. Closing above 4.05 will confirm the target 5.50
Technical indicator MACD is positive. RSI is getting near over-bought; pushing for correction!
So, be careful and ready with a dynamic (quick) stop loss

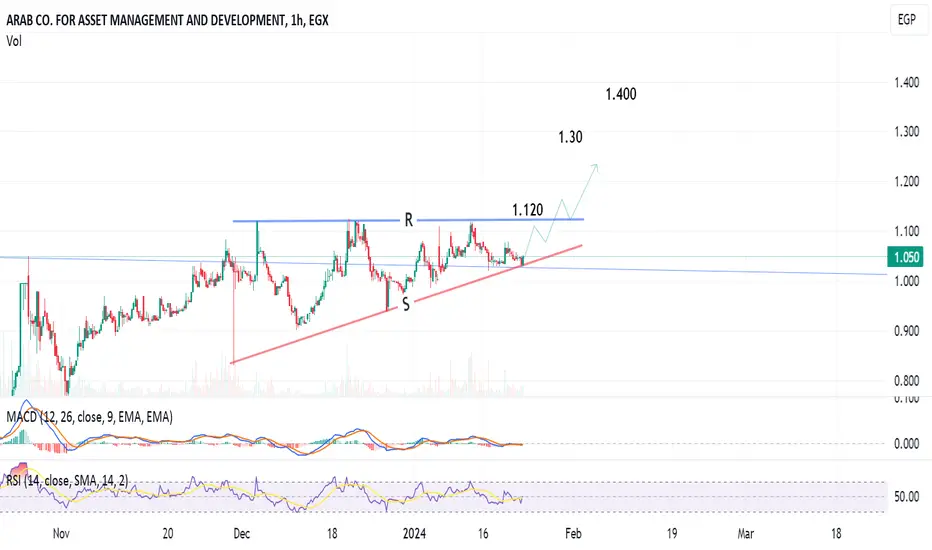
ACAMD to target 1.12 then 1.40 after crossing Resistance1-hour chart, the stock is trading in a rising triangle pattern, going to hit the Resistance line (blue) at around 1.118 - 1.120.
After crossing up, the target will be 1.30 then 1.40
Stop loss below the support line.
ElSwedy Electric (SWDY) should target 38 then 50 and 55Daily chart, the stock is trading in a rising widening wedge, and has a tendency to cross the long term Resistance line (RL) at around 32.7, then the target will be 38.
Above the resistance line R1, the target will be 50 - (then 55 on the weekly time-frame)

EGAL, Egypt, should go to 103Daily chart, the stock formed a descending triangle, and pennant chart patterns, and the target is 103
Technical indicators RSI and MACD are positive, confirming this uptrend view.

ACAMD has a potential to reach 1.82 after crossing 1.38Weekly chart, the stock is trading near a resistance zone, and is trying to cross 1.12-1.13
Above this level, the targets will be 1.28 and 1.38, then 1.68 extending to 1.82

AMOC to target 14.4 after crossing resistanceDaily chart, AMOC is trading in a descending channel, and it seems a chart pattern will be formed - a flag / inside a triangle.
After crossing the resistance (at 10.35 - 10.4), the target will be 12 and 12.6 , then some correction may happen at 12.6 before reaching the target 14.4
Stop loss below 9.6 to be considered.

EHDR should target 0.450, then 0.625Weekly chart, the stock is trading in a falling expanding triangle, with a tendency to cross the resistance line.
After crossing at around 0.430, the target will be 0.530, then zigzag upwards up to 0.903 passing through the shown resistance levels.
Technical indicators RSI and MACD are positive.

Cairo Oils & Soap, Egypt, should target 0.549, then 0.579Weekly chart, the stock (COSG) is trading in a rising channel, and is inclined to cross the resistance.
Above resistance line, the target will be 0.549, extending to 0.579 then 0.621
Technical indicators MACD and RSI are supporting this view.

MM Group is about to cross the resistance; then 11.4Daily chart, the stock has formed an expanding triangle chart pattern, and is preparing to cross the Resistance line (blue).
After crossing, the target will be 11.4
Stop loss should be considered below 6.85

FAWRY, Egypt, is on a critical price level !Daily chart, the stock is trading in a rising channel, and is inclined to test the support line (Red), then rebound to the resistance line (blue)
Below support, the target is 4.62.
Above the support, the target is 7.76 (Crossing at around 6.66 - 6.70)
