EICHERMOT (NSE) – Bullish Setup on 15min & 1H🔑 Trade Plan:
📥 Buy Above: ₹5485 (above current resistance & candle body highs)
🎯 Targets:
T1: ₹5527 (Pivot R1)
T2: ₹5555
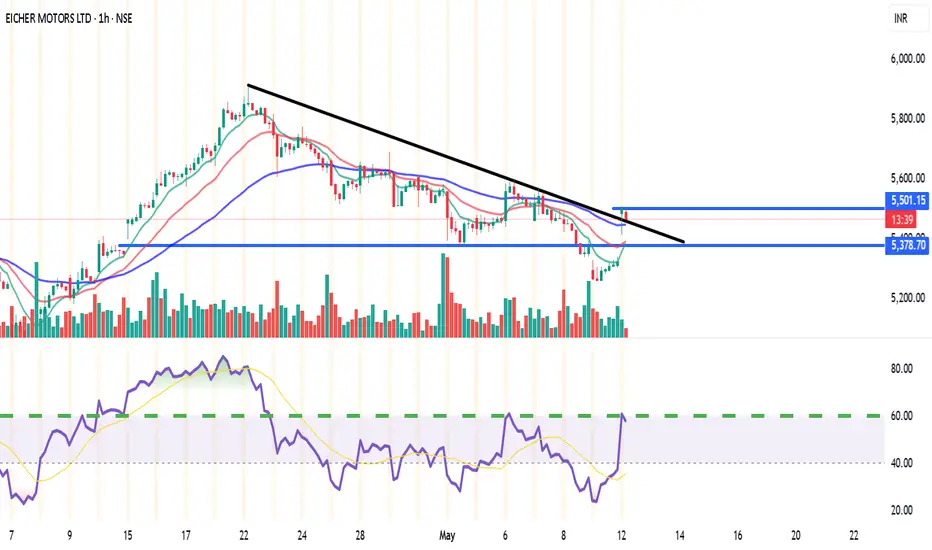
🛡️ Stop Loss: ₹5380 (below 13 EMA & Supertrend support)
📊 Technical Signals:
RSI: 58.08 – Bullish momentum, still room to run
%B (BB): 0.77 – Close to breakout from upper band
EMA Crossover: 9 EMA > 13 EMA – Short-term bullish crossover confirmed
Supertrend: Support at ₹5322, aligning with bullish reversal
Volume: Spike during recent green candles signals strong buying interest
⚙️ Strategy Notes:
Use 15min chart for entry timing post breakout
Tighten SL to cost after T1 hits
Ideal for short-term intraday/swing traders
For Education Purposes Only
EICHERMOT
Breakout in Eicher MotorStock has been in accumulation phase from 6 months.
Today is a good breakout with huge volume and some news for overall sector.
Shares of Royal Enfield-maker Eicher Motors rose over 6% on January 2 as the company reported 25% jump in motorcycle sales in December.
In a stock exchange filing, the company said its total motorcycle sales in December rose 25% to 79,466 units as against 63,387 units in the year-ago period.
The company's international business outperformed by rising 90% to 11,575 units.
Above paragraph is borrowed from news portal.
Strategy would be to wait for PULLBACK and let price retrace back to 5150 and then buy, now since price have moved away reward to risk ratio is not favorable.

EICHERMOT Bullish Buy A Bullish Flag is a technical analysis pattern that suggests a potential continuation of a bullish trend. Here's a description of the Bullish Flag pattern in Eicher Motors:
Pattern Description:
Flagpole: The stock price of Eicher Motors has been in a strong uptrend, forming a flagpole (a sharp, almost vertical rise in price).
Consolidation: After the flagpole, the stock price has consolidated within a narrow range, forming a flag (a rectangular or triangular shape).
Upper and Lower Boundaries: The flag has upper and lower boundaries, which are roughly parallel to each other.
Breakout: The stock price is expected to break out above the upper boundary of the flag, continuing the bullish trend.

Higher Highs Higher Lows - EICHERMOT📊 Script: EICHERMOT
📊 Sector: Automobile
📊 Industry: Automobiles - Motorcycles / Mopeds
Key highlights: 💡⚡
📈 Script is trading in Upward moving channel and forming Higher Highs Higher Lows on daily chart.
📈 One can go for Swing Trade.
⏱️ C.M.P 📑💰- 4941
🟢 Target 🎯🏆 - 5073
⚠️ Stoploss ☠️🚫 - 4808
⚠️ Important: Always maintain your Risk & Reward Ratio.
✅Like and follow to never miss a new idea!✅
Disclaimer: I am not SEBI Registered Advisor. My posts are purely for training and educational purposes.
Eat🍜 Sleep😴 TradingView📈 Repeat 🔁
Happy learning with trading. Cheers!🥂

eichermotor longeichermot looks good to buy as per my view.
this is my personal view for education purpose.
do your own research
thank you

Eicher Motors looking bullishEicher Motors has recently completed Cup & Handle pattern and is all set to reach all the way to INR 4500 in a 9-12 months time horizon from current levels.

Time to take profit in Eicher motors and wait for break outRight at the resistance- It is always good to book some profits at resistance. I would like to wait for confirmation if breaking out. though I kind of lean towards break down. If it goes as per my plan I would like to accumulate at the specified accumulation range.

I would like to long if it comes to the arrow I have markedTwo possible scenarios from my angle lets see how it reacts. Already two times it broke my stop loss and stopped my trade. One last try :)

EICHERMOT Analysis----->>this stock is continuously moving upwards...
---->>now this stock is facing the resistance from 4200 level, a fall back is noticed.
on bottom side we find a support zone identified at 3700 and also the trendline is pushing the price upside.
------->>keep in long side as long as price is above the trendline and support zone.
If price breaks the trendline then look for short side below the support levels, after a rejection from support level at 3700.

My view on EICHERMOT EICHERMOT may give symmetrical triangle breakout.
Looking good above 3370-75
For tgt 3450-3470-3500 in very short term.
Also we are keeping on radar EICHERMOT 3400 CE next exp. Contract.

EICHER MOTOR SELL SETUPAs per my analysis, I am expecting more down side on $NSE:EICHERMOT. Best level to take sell entry will be 3208 with stop loss of 3270 (+62 points risk). My expected downside would be 3096 which is strong support and buying area.
Note: This is my personal analysis, only to learn stock market behavior. Thanks.

EICHERMOT : Near major zoneEICHERMOT is trading near Major zone as of now. 4 times it reversed from this level and it is acting as a Major supply zone.
So what can be strategy for me... I will see 1 hours & 15 chart and if its creating HH< HL then i will go with positive.....if it break level then it will be massing selling here and can good to with trend.
Follow prices action in 1 hour chart before entering in trade.
Like, Share, Comment for regular updates.
Disclaimer
I am not sebi registered analyst
My studies are Educational purpose only
Please consult with your Financial advisor before trading or investing
I may be 100% wrong as its my personal trade.
First Learn and then remove "L"

EICHERMOT Low Risk High Reward IdeaAs per analysis, best level to take entry on NSE:EICHERMOT is 3340 with stop loss of 3275. My expected up side targets will be 3410 & 3495.
This could be low risk and high reward idea.
Note: This is my personal analysis, only for learning. Thanks.

EICHER MOTORS - at short term supportThere's a formation of Bullish Bat Pattern on the hourly chart of the Eicher Motors,
Bat pattern is a five-legged harmonic pattern that provides us with potential reversal zones, from where stock usually witnesses sharp recovery or fall as the case may be.
Here 3407-3434 is the PRZ that the pattern provided as we did see the sharp recovery back from there.
The pattern PRZ is also coinciding with the daily chart support levels around 3400.
Now sustaining prz , we may see stock testing 3500- 3570 in the coming trading sessions.
Trade type: Reversal Long Trade
Pattern: Bullish Bat Pattern
Support: 3400-3434
Target: 3500-3570
CMP: 3464
How to Buy: Time your trade from lower timeframes, to manage your risk better.

EICHER MOTOR LIMITED. A Hidden Bull In The Auto Sector. This Is The Detail Analysis Of The Eicher Motors Limited Which As Given The Breakout At Monthly TimeFrame.
PATTERNS:
1. HEAD AND SHOULDER.
2. FLAG AND POLE.
THE STOCK IS LOOKING STRONG AT MONTLY TIME FRAME, IT AS GIVEN BREAKOUT IN THE MONTH OF JULY AND NOW IT IS TRYING TO SUSTAIN ABOVE THE BREAKOUT LEVEL WHICH IS THE GOOD SIGN OF A CLEAR AND LEGIT BREAKOUT.

NIFTY ( OM )Over all market bullish ..but this time market little down for 50 to 100 points ..this my opinion and ..buy sell signal Draw in chart .
Thank you

EicherMotors Bear trapEducational Idea:
Most of the Novice conventional traders use support and resistance levels. If the support breaks, they tend to short-sell the scrip & try to profit out of it. And, if the resistance breaks, they go long. But the majority of the time, they become a victim.
Let me get this straight.
Let's take an example, in this case, Eicher Motors. When Eicher Motors is close to the support pivot, let's say, everyone(Traders and Investors) will take a long position. Since everyone is buying the stock, there will be a lack of sellers & the price will shoot up suddenly in search of the sellers, and the investors will have no choice but to buy for a higher price since there is a huge demand.
But the thing is, the investors are much smarter than that. When everyone is long at the pivot (or Support Point), they will just short the stock, using all the buy orders provided by the traders and drive the price down, breaking the pivot (Support). This will create a panic for the traders as the support is broken. In a panic, they will square off their position for a loss, and to cover their loss (creating sell orders), they will just short the stock. (Again Creating new sell orders, at a lower price)
Now, the investors got what they wanted, i.e, fresh sell orders at a lower cost. They will just unload their short positions to the traders who are taking fresh short positions and will start accumulating the quantities they want for their portfolio at a much better & lower cost.
And then, the stock price goes up, giving investors their returns and traders, well, their losses.
Please Note, This is just an Educational Idea. Trading involves risking capital. Always protect your capital by keeping a strict stop-loss.
Happy Trading & Investing.

EICHER MOTORS - at short term supportThe structure of the chart becomes weak after a massive fall in today's session.
Though currently, it is trading at short-term support, if held we may see a temporary bounce back in the stock.
Immediate Resistance at 2800
Type of Trade: contra - risky.
Freefall may be seen in the stock below 2700 levels, hence be careful.
Disclaimer: Not a recommendation to trade

Eicher Looks GoodEicher Motor looks good good on current level for 3350 with the stop loss of 2740...!!

EICHERMOT - Bounce or BOEICHERMOT :
Did we miss the fall? No We expected correction/fall from 2775-2780 range and it happened.
Currently on trend line, below 50/100/200 EMA lines. Breaking this and sustains - next level will be 2410, below 2325.
Add to watchlist -
Please spend time on own research before investing.


