EIGEN/USDT TestingDemand Zone – Rebound or Breakdown Ahead?🧠 Technical Analysis:
🔸 Market Structure:
The price is currently sitting around 1.15 USDT, right above a key demand zone (highlighted in yellow) that has been tested multiple times since March 2025.
This area between 1.00 – 1.20 USDT acts as a major support zone.
🔸 Key Resistance Levels:
1.430 USDT → short-term resistance
1.604 USDT → significant resistance (previous support turned resistance)
Higher resistance targets: 1.980, 2.341, 2.982, 4.018, and 5.480 USDT
🔸 Key Support Levels:
1.154 USDT → current price level
Main demand zone: 1.00 – 1.20 USDT
If broken, the next major support lies around 0.80 USDT
---
📈 Bullish Scenario:
If the 1.00 – 1.20 USDT demand zone holds and the price prints a higher low, a bullish reversal is possible.
Short-term target: 1.43 and 1.60 USDT
If 1.60 is broken with strong momentum, the next targets are: 1.98 – 2.34 USDT
Bullish confirmation will be stronger if the price breaks and closes above 1.60 USDT on the daily chart
✅ Bullish Confirmation:
Bullish engulfing candle near support
Rising volume on upward moves
Breaking above previous lower highs
---
📉 Bearish Scenario:
If the price breaks down below the 1.00 – 1.15 USDT support zone, downside targets shift toward 0.80 – 0.66 USDT
A descending triangle pattern may be forming if the price continues making lower highs while testing the same support
⚠️ Bearish Confirmation:
Strong bearish candle closing below support
High sell volume
New lower low after a failed bounce
---
🔺 Pattern Analysis:
The price has been forming a range-bound pattern between 1.00 – 1.60 USDT
A potential double bottom could form if this support holds and price bounces up again
Otherwise, it may evolve into a descending triangle, signaling bearish pressure
---
🔖 Conclusion:
EIGEN is at a critical support zone that could define its next major move. A strong reaction here could signal a bullish reversal, while a breakdown could open the door to deeper declines. This is a key level to watch.
#EIGEN #EIGENUSDT #CryptoAnalysis #Altcoin #TechnicalAnalysis #SupportResistance #BullishScenario #BearishScenario #CryptoTrading #ChartAnalysis
EIGENUSDT

EIGEN/USDT Breakout Countdown: Descending Triangle Retest
EIGEN/USDT is currently at a critical technical juncture. After months of downward pressure, the pair is now showing signs of a major bullish breakout from a descending triangle pattern, which is often a strong reversal signal. Are we about to witness an explosive upside move? Let’s dive into the setup.
🧠 Key Technical Structure
📌 Pattern: Descending Triangle (Bullish Reversal Potential)
Formed since December 2024
Strong horizontal support between $1.05–$1.28 (yellow box), tested multiple times
Series of lower highs forming a descending trendline, now being challenged by price action
This structure hints at heavy accumulation beneath resistance
📌 Volume: Gradually increasing near breakout zone — a sign of accumulation by smart money
📌 Breakout Confirmation: A daily close above $1.30 with strong volume will validate the breakout, potentially triggering a powerful move.
🟢 Bullish Scenario (Confirmed Breakout)
If EIGEN breaks and successfully retests the descending trendline, a major rally could follow, with these targets in sight:
🎯 Upside Price Targets:
1. $1.60 – Minor resistance and previous support flip
2. $1.98 – Previous distribution zone
3. $2.34 – Horizontal resistance from past structure
4. $2.98 – Mid-Fibonacci extension target
5. $4.01 – Full height target from triangle breakout
6. $5.48–$5.65 – Long-term target from historical resistance
✅ This structure aligns with a classic impulsive wave pattern following a major technical breakout.
🔴 Bearish Scenario (Failed Breakout / Fakeout)
Not all breakouts are successful. Here's what to watch out for:
🔻 If price fails to hold above $1.28, and breaks below $1.05, the structure turns bearish:
Opens the door for a trend continuation downward
Next supports lie at $0.90–$0.80, and possibly $0.65–$0.60
Indicates that sellers are still in control and accumulation has failed
🚫 This would invalidate the bullish setup and signal caution for long positions.
📌 Suggested Trading Plan
Entry Strategy:
Conservative: Wait for a confirmed breakout and successful retest above $1.30
Aggressive: Enter on intraday breakout with strong volume above trendline
Stop Loss: Below triangle support (~$1.02–$1.05)
Take Profits (TP): Scale out at $1.60 / $1.98 / $2.34 / $2.98 / $4.01 / $5.48
💬 Conclusion
EIGEN is on the verge of a major technical move. A clean breakout from the descending triangle could mark the transition from bearish consolidation to bullish expansion — a structure often seen before explosive rallies in altcoins.
Always manage risk wisely, stay alert for retests, and never chase entries without confirmation. This is a setup worth watching closely in the coming days!
#EIGEN #EIGENUSDT #CryptoBreakout #DescendingTriangle #AltcoinSeason #BullishSetup #ChartPattern #BreakoutAlert #SmartMoneyMoves #CryptoTechnicalAnalysis

EIGEN/USDT — Ready to Explode from Accumulation?🔍 Detailed Technical Analysis (1D Timeframe):
After months of bearish pressure, $EIGEN is now showing early signs of a trend reversal. The chart is painting a compelling picture of a breakout setup backed by a strong accumulation base and a long-term descending trendline.
🟨 Solid Accumulation Zone:
Price has been consolidating tightly within the $0.90 – $1.10 range, forming a clear accumulation zone. This zone has acted as a reliable support area multiple times, rejecting bearish attempts and indicating smart money accumulation.
This type of sideways base is often the foundation for explosive upside moves.
📉 Descending Trendline Breakout Setup:
A clear descending resistance line has been holding since the highs in December 2024.
Price is now approaching a critical breakout point. A confirmed breakout above this trendline could mark the beginning of a new bullish trend.
📈 Bullish Scenario (Momentum Breakout):
If price breaks out above the descending trendline and clears the key resistance at $1.227, the path toward higher targets opens up quickly:
Bullish Target Levels Description
🎯 $1.603 Minor psychological resistance
🎯 $1.980 Structural resistance
🎯 $2.341 Fibonacci confluence & supply zone
🎯 $2.982 Medium-term target
🎯 $3.993 Breakout continuation level
🎯 $5.480 – $5.659 Previous all-time high (ATH) region
📌 Note: For a valid breakout, look for a strong daily candle close above $1.227, ideally with high volume to confirm momentum.
🔻 Bearish Scenario (Rejection Play):
If price gets rejected at the trendline and fails to break $1.227:
A pullback to the $1.00 – $0.90 accumulation zone is likely.
If that support fails, price may drop toward:
🔻 $0.85
🔻 $0.78
🔻 $0.68 (key psychological & historical volume zone)
📊 Conclusion: Make or Break Moment Ahead
EIGEN is at a critical decision point. A successful breakout could kick off a major bullish phase, while a failure may extend the sideways or bearish action.
With a strong base formed and pressure building near the trendline, this setup deserves a spot on every trader’s radar.
#EIGENUSDT #CryptoBreakout #AltcoinSetup #TechnicalAnalysis #BullishScenario #BearishScenario #AccumulationZone #PriceAction #CryptoTrading #CryptoAnalysis

EIGEN/USDT – Falling Wedge Breakout Setup | 4H ChartEIGEN is currently showing a bullish falling wedge pattern near a strong horizontal demand zone, indicating a potential reversal move.
Technical Breakdown:
Entry Zone: $1.17 – $1.18 (current market price)
Stop-Loss: Below $1.14 (last wick low/invalidation of wedge)
Target Price: $1.74, $2.51 (+118%) from CMP
Resistance 1 (Minor): $1.33
Resistance 2 (Major Target): $1.74
Support Levels:
• $1.17 (Immediate support)
• $0.749 (Major demand zone if breakdown)
Target & Risk-Reward
Target Price: $1.74, $2.51 (+118%) from CMP
Stop-Loss: $1.14
Risk per token: ~$0.03
Potential Profit per token: ~$0.56
Risk:Reward Ratio: ~1:6.5
Potential Gain: +118% from entry
Indicators:
Falling wedge breakout looks imminent
RSI (14) at 39.5 — recovering from oversold zone
Demand zone previously triggered rallies — the probability of a bounce is high
Strategy:
Wait for a 4H candle close above the wedge trendline + volume confirmation to validate the breakout. Scaling in near support with a tight stop-loss can offer a strong risk-reward play.
Not Financial Advice – This is a technical view for educational purposes. Always DYOR & manage risk accordingly.
Like & follow if you found this useful!
#EIGEN #Altcoins #Breakout

Eigenlayer EIGEN price analysisLooking at the OKX:EIGENUSDT chart, we can see that the growth amplitude is “choking” and trading volumes are decreasing.
Therefore, at the current price, we would not risk buying #EIGEN
But at $0.90, it's safer! Or at $1.80-1.90, but only after the price breaks through and consolidates above the trend line.
#Eigenlayer is based on the #Ethereum ecosystem and has “come alive” following the price of CRYPTOCAP:ETH
_____________________
Did you like our analysis? Leave a comment, like, and follow to get more

$EIGEN/USDT Trade SetupPrice broke above key resistance and is now retesting the zone.
- Entry: CMP
- Stop Loss: $1.5972
- Targets: $2.0211 / $2.2899
Holding the trendline demand flip strong bullish bias.
Breakout traders, keep it on your radar.
DYRO, NFA

EigenLayer Easy Targets, Broken Downtrend —500%Now we are looking at EigenLayer, a new project.
Notice the very strong downtrend that started in mid-December 2024. It is hard to believe that it has been already more than five months.
Notice this huge downtrend and how EIGENUSDT broke out without breaking bullish. This is ok if you are looking for good options to buy and trade.
This pair trades at a low price, early, and has huge potential for growth in weeks, months and days.
I will give you some targets, the bottom is in. But a full blown bullish confirmation happens when the action moves above 'main resistance'. The action is happening now within a strong buy-zone.
This zone is the last chance and opportunity to buy when prices are low. It will start growing next and this growth will go for months.
The first target can hit short-term while the second is set for the mid-term. Long-term, you can expect even more.
A perfect strategy for spot traders is simply to buy and hold. When prices are high, say 200%-300%, collect profits and move on to the next trade.
Repeat this process over and over, again and again, and watch your portfolio grow faster than the bull market.
Buy ten pairs and each time one matures, sell and find one trading near support and repeat the process. This is a simple strategy but it pays.
If you miss the selling point, wait.
Never buy when prices are high.
Never sell when prices are low.
Do it the other way around... Buy now, sell later when the masses start to buy at the top. When they are buying, you are selling.
Now that everybody is selling, you have to buy, buy everything up.
Namaste.

EIGENUSDT 1D AnalysisEIGEN ~ 1D Analysis
#EIGEN Buy after successfully penetrating this resistant line with a short -term target of at least 10%+.

EIGENUSDT 1DEIGEN ~ 1D Analysis
#EIGEN If you expect this coin to be bullish again, You have to wait until this resistant line is successfully penetrated.
Bullish will not return before this resistance succeeds in broken.

#EIGEN/USDT#EIGEN
The price is moving in a descending channel on the 1-hour frame and is adhering to it well and is heading to break it strongly upwards and retest it
We have a bounce from the lower limit of the descending channel, this support is at a price of 1.56
We have a downtrend on the RSI indicator that is about to break and retest, which supports the rise
We have a trend to stabilize above the moving average 100
Entry price 1.71
First target 1.83
Second target 1.90
Third target 1.98

EIGEN / USDT : Retesting the Trendline after breakout EIGEN/USDT: Retesting the Trendline After Breakout
EIGEN/USDT is showing promising signs 📈 as it retests the trendline after a breakout 📊. This retest is crucial as it could confirm the trendline as a new support zone, setting the stage for a strong bullish continuation 💥. If the support holds, we could see a significant upward move 🚀. Keep a close watch 👀 on this pair and wait for confirmation before taking action.
Key insights:
1. Trendline retest: EIGEN/USDT is retesting the trendline it recently broke above. Successfully flipping this resistance into support could confirm the breakout and trigger a bullish rally.
2. Volume validation: Monitor trading volume closely. A surge in volume during the retest would confirm strong buyer interest 🔥.
3. Bullish signals: Momentum indicators such as RSI and MACD are showing positive trends ⚡, supporting the likelihood of a bullish continuation.
Steps to confirm the trendline support:
Look for a clear 4H or daily candle closing above the retested trendline 📍.
A noticeable increase in volume during the retest can signal strong buying activity 📊.
If the trendline holds as support, it adds credibility to the bullish continuation ✅.
Be cautious of false signals, such as sharp pullbacks or wicks below the trendline ⚠️.
Risk management strategies:
Use stop-loss orders to manage your risk effectively 🔒.
Ensure position sizing aligns with your overall trading strategy 🎯.
This analysis is for educational purposes only and not financial advice. Always conduct your own research (DYOR) 🔍 before making investment decisions.

EIGENUSDT 1WEIGEN ~ 1W Analysis
#EIGEN Selling pressure seems to have begun to weaken from here. Buy from here if you still have a Conviction on this coin with a minimum target of 20%+.

$EIGEN - I am seeing some huge potential here.BINANCE:EIGENUSDT - I am seeing some huge potential here, despite the negative bias in the market. I see some minor retracement pending before a huge run up. I'd get ready to pull my socks up for this guy.

Eigen Layer zones of interest2 main zones of interest on BINANCE:EIGENUSDT
People will claim airdrop and sooner or later drop the price to zones of interest
2 zones marked by IAP model (how to work with model find in Ideas)
positive and negative scenario will end in same zones so its matter of time
Invalidation of idea mentioned on a chart
Hope you enjoyed the content I created, You can support with your likes and comments this idea so more people can watch!
✅Disclaimer: Please be aware of the risks involved in trading. This idea was made for educational purposes only not for financial Investment Purposes.
---
• Look at my ideas about interesting altcoins in the related section down below ↓
• For more ideas please hit "Like" and "Follow"!

EIGEN target $6.14h time frame
-
Entry: $3
TP: $6.1
SL: $2.45
RR: 5.7
-
(1) EIGEN is building a descending wedge which is a standard correction from previous pump
(2) Notice $3.3~$3.48 is R/S zone
(3) Fibonacci provides first target at $6.11 and final target at $9.17
(4) Stop loss once going below $2.45

EIGENUSDT 1DEIGEN ~ 1D
#EIGEN Break of $3.2 support, Will bring the price back to test this support block. buy in stages, with a minimum target of 20%+

EIGEN - Box is brokenBINANCE:EIGENUSDT (1h CHART) Technical Analysis Update
EIGEN is currently trading at $3.578 and showing overall bullish sentiment sentiment
Price was trading inside the box for couple days and expecting to breakout from the box soon. There is a good potential for long trade here.
Entry level: Candle close above $3.68
Stop Loss Level: $ Below 3.204
TakeProfit 1: $3.875
TakeProfit 2: $ 4.180
TakeProfit 3: $ 4.592
TakeProfit 4: $ 5.035
TakeProfit 5: $ 5.612
Max Leverage: 5x
Position Size: 1% of capital
Remember to set your stop loss.
Follow our TradingView account for more technical analysis updates. | Like, share, and comment your thoughts.
Cheers
GreenCrypto

EIGENUSDT Elliott Waves AnalysisHello friends.
Please support my work by clicking the LIKE button👍(If you liked).
Everything on the chart.
Entry zone: market and lower
Targets: 6 - 10 - 14
after first target reached move ur stop to breakeven
Stop: under 2.3 (depending of ur risk).
RR: 1 to 10
ALWAYS follow ur RM
risk is justified
It's not financial advice.
DYOR!

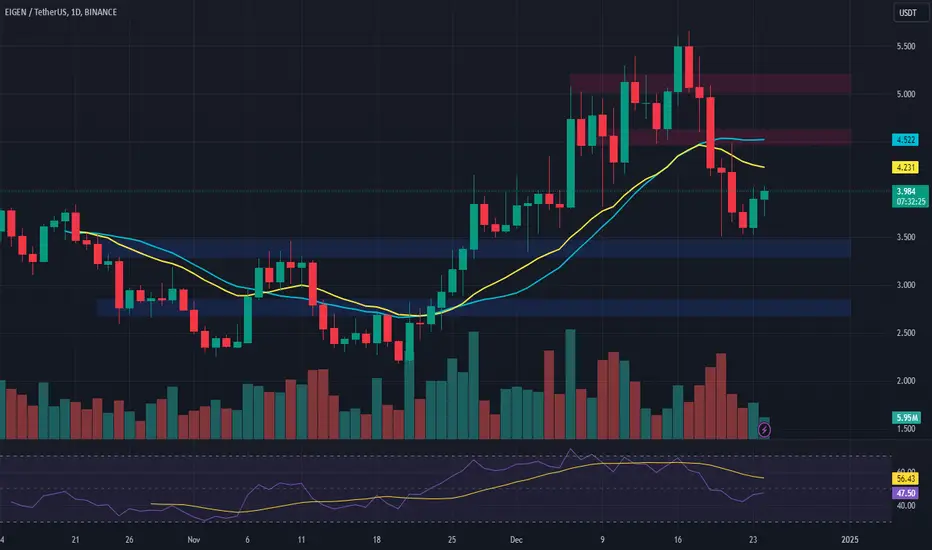
EIGEN Price Analysis – Key Levels and OutlookRecent Performance:
Retracement: EIGEN has retraced to the midpoint of its November-December rally, testing a critical support zone as it approaches a period of heightened supply due to a token unlock event.
Higher-Timeframe Support: Begins at $3.3792, corresponding to the high of the November 25th bullish gap.
Support Levels:
Primary Support Inside Gap:
$3.3000: November 11th's weekly high, offering initial support within the gap.
$3.1911: November 4th's rejection level, representing stronger secondary support.
Deeper Support: If the gap fails, the next significant zone lies at:
$2.8932: November 24th's bullish gap.
Aligns with November 11th's weekly accumulation midpoint, providing robust support for potential reversal.
Upside Targets:
Short-Term Resistance:
$4.4820: December 21st swing high, where bears’ stops could cluster.
$4.6355: December 14th rejection, likely to act as a significant resistance level.
Long-Term Targets:
$5.0213: December 16th's distribution zone, beyond which resistance appears minimal, allowing for potential price discovery.
Key Considerations:
Token Unlock Impact: Bulls may wait to absorb the newly unlocked supply before initiating significant buying activity.
Breakout Conditions: A decisive move above $4.4820 with volume could trigger a cascade of short covering, driving momentum toward $4.6355 and beyond.
Failure Scenario: A breakdown below $2.8932 would invalidate the bullish structure, signaling deeper retracement and potential accumulation at lower levels.
EIGEN TREND CORRCTION CHANNEL (UPDATE)so in the analysis i made few days ago (or yesterday idk) on BINANCE:EIGENUSDT we we had a channel that wad broken from below and you could"ve opened your position from the channel brakeout or the grenn line i specified though to be honest channel brakeout candle was too big only time frame you could have opened postion was 15 and in my opinion it was too risky with current status of the market but with the green line it was a lot safer to open your position and even better and smaller SL if you managed to open a position on BINANCE:EIGENUSDT i would suggest to close it fully or saving your profits yeah that"s IT i would really be thankful of any of you that supports me if the support is enough i would be more productive thanks to all of you 😘

EIGEN TREND DIRECTIOONAL CORRCTION CHANNEL as we can see in the chart eigen is in a trend directional BINANCE:EIGENUSDT is in a uprising channel if the current btc uptrend we can expect eigen to be the one of stronger assets i think everything is obvious enough in the chart i"ll be really thankful if you share your idea about this analysis and what you think about the current trend of the market

EIGENUSDT 12HEIGEN ~ 12H
#EIGEN If you still have Conviction on this coin,. Buy gradually within this buy zone. With a minimum target of 20%++

