EIGEN/USDT — Symmetrical Triangle: Breakout Imminent?Summary
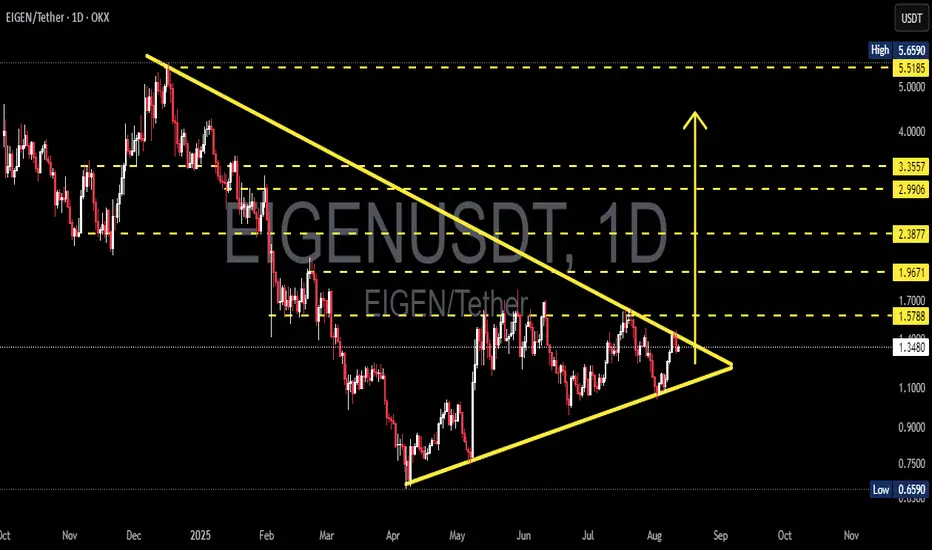
The daily chart shows a symmetrical triangle pattern (descending resistance from Dec–Aug and ascending support from April). Price is currently around 1.36 USDT, squeezing into the narrow apex zone — this suggests high volatility is likely once a breakout occurs. Statistically, this pattern is neutral, but the formation of higher lows since April gives a slight bullish bias. However, given the prior strong downtrend, we must not ignore the potential for a continuation to the downside.
---
Technical Pattern Details
Pattern: Symmetrical triangle / contracting triangle — two converging trendlines: lower highs vs higher lows.
Meaning: Consolidation between buyers & sellers, representing accumulation/distribution before a sharp move.
Probability: Neutral — the breakout direction defines the medium-term bias. With the prior downtrend, continuation is possible, but persistent higher lows suggest ongoing demand.
Timing: Apex likely reached in Sept; breakouts often occur before or at the apex.
---
Key Levels (from chart)
Current price: 1.3604 USDT
Resistance levels: 1.5788, 1.9671, 2.3877, 2.9906, 3.3557, and major high at 5.52–5.66 USDT.
Key support: ascending trendline & historical low at 0.6590 USDT.
---
Bullish Scenario (Confirmation & Targets)
Confirmation:
1. Daily candle closes above the triangle resistance (~1.58–1.65 USDT, depending on precision).
2. Breakout volume is higher than average.
3. Retest holds as support after breakout.
Targets after bullish breakout:
TP1: 1.5788
TP2: 1.9671
TP3: 2.3877 → 2.9906 → 3.3557 (if strong momentum)
Example aggressive setup:
Entry: 1.62 USDT
Stop-loss: 1.30 USDT
Risk per unit = 0.32 USDT
TP1 (1.97) → ~1.09R
TP2 (2.38) → ~2.37R
---
Bearish Scenario (Confirmation & Targets)
Confirmation:
1. Strong rejection at triangle resistance, followed by daily close below ascending support.
2. Increased volume on breakdown.
3. Failed retest of broken support.
Targets after bearish breakdown:
TP1: Local support zones (~1.10–0.90).
TP2: Historical low 0.6590 USDT.
Example short setup:
Entry: 1.30 USDT
Stop-loss: 1.60 USDT
Target: 0.659 USDT → ~2.14R
---
Trading & Risk Management Notes
1. Wait for confirmation — avoid early intraday breakouts.
2. Retest entries for conservative trades.
3. Stop-loss placement beyond structural levels.
4. Risk per trade: 1–3% of total capital.
5. Partial scale-in if breakout shows strong momentum.
6. Beware of fakeouts — common in tightening triangles.
---
Confirmation Checklist
Daily close outside trendline.
Breakout volume above accumulation average.
RSI/Stoch supports breakout direction.
Multi-timeframe alignment (e.g., 4H, 12H).
Liquidity/spread checks on exchange.
---
Risk Notes
Triangles after a downtrend can be continuation patterns — don’t pre-bias without confirmation.
Use horizontal resistance levels for realistic profit-taking instead of overly optimistic measured moves.
Watch for correlated market moves (BTC/ETH).
---
EIGEN/USDT (1D) forming a symmetrical triangle — volatility spike likely as breakout nears. Wait for daily close + volume above 1.58–1.65 for bullish targets (1.97 → 2.38 → 2.99), or breakdown below ascending support for bearish targets (down to 0.659). Manage risk and watch for retests.
#EIGEN #EIGENUSDT #CryptoTA #SymmetricalTriangle #BreakoutSetup #SupportResistance #TechnicalAnalysis #CryptoTrading #AltcoinAnalysis #RiskManagement
Eigenusdtperp
EIGEN/USDT TestingDemand Zone – Rebound or Breakdown Ahead?🧠 Technical Analysis:
🔸 Market Structure:
The price is currently sitting around 1.15 USDT, right above a key demand zone (highlighted in yellow) that has been tested multiple times since March 2025.
This area between 1.00 – 1.20 USDT acts as a major support zone.
🔸 Key Resistance Levels:
1.430 USDT → short-term resistance
1.604 USDT → significant resistance (previous support turned resistance)
Higher resistance targets: 1.980, 2.341, 2.982, 4.018, and 5.480 USDT
🔸 Key Support Levels:
1.154 USDT → current price level
Main demand zone: 1.00 – 1.20 USDT
If broken, the next major support lies around 0.80 USDT
---
📈 Bullish Scenario:
If the 1.00 – 1.20 USDT demand zone holds and the price prints a higher low, a bullish reversal is possible.
Short-term target: 1.43 and 1.60 USDT
If 1.60 is broken with strong momentum, the next targets are: 1.98 – 2.34 USDT
Bullish confirmation will be stronger if the price breaks and closes above 1.60 USDT on the daily chart
✅ Bullish Confirmation:
Bullish engulfing candle near support
Rising volume on upward moves
Breaking above previous lower highs
---
📉 Bearish Scenario:
If the price breaks down below the 1.00 – 1.15 USDT support zone, downside targets shift toward 0.80 – 0.66 USDT
A descending triangle pattern may be forming if the price continues making lower highs while testing the same support
⚠️ Bearish Confirmation:
Strong bearish candle closing below support
High sell volume
New lower low after a failed bounce
---
🔺 Pattern Analysis:
The price has been forming a range-bound pattern between 1.00 – 1.60 USDT
A potential double bottom could form if this support holds and price bounces up again
Otherwise, it may evolve into a descending triangle, signaling bearish pressure
---
🔖 Conclusion:
EIGEN is at a critical support zone that could define its next major move. A strong reaction here could signal a bullish reversal, while a breakdown could open the door to deeper declines. This is a key level to watch.
#EIGEN #EIGENUSDT #CryptoAnalysis #Altcoin #TechnicalAnalysis #SupportResistance #BullishScenario #BearishScenario #CryptoTrading #ChartAnalysis

EIGEN/USDT Breakout Countdown: Descending Triangle Retest
EIGEN/USDT is currently at a critical technical juncture. After months of downward pressure, the pair is now showing signs of a major bullish breakout from a descending triangle pattern, which is often a strong reversal signal. Are we about to witness an explosive upside move? Let’s dive into the setup.
🧠 Key Technical Structure
📌 Pattern: Descending Triangle (Bullish Reversal Potential)
Formed since December 2024
Strong horizontal support between $1.05–$1.28 (yellow box), tested multiple times
Series of lower highs forming a descending trendline, now being challenged by price action
This structure hints at heavy accumulation beneath resistance
📌 Volume: Gradually increasing near breakout zone — a sign of accumulation by smart money
📌 Breakout Confirmation: A daily close above $1.30 with strong volume will validate the breakout, potentially triggering a powerful move.
🟢 Bullish Scenario (Confirmed Breakout)
If EIGEN breaks and successfully retests the descending trendline, a major rally could follow, with these targets in sight:
🎯 Upside Price Targets:
1. $1.60 – Minor resistance and previous support flip
2. $1.98 – Previous distribution zone
3. $2.34 – Horizontal resistance from past structure
4. $2.98 – Mid-Fibonacci extension target
5. $4.01 – Full height target from triangle breakout
6. $5.48–$5.65 – Long-term target from historical resistance
✅ This structure aligns with a classic impulsive wave pattern following a major technical breakout.
🔴 Bearish Scenario (Failed Breakout / Fakeout)
Not all breakouts are successful. Here's what to watch out for:
🔻 If price fails to hold above $1.28, and breaks below $1.05, the structure turns bearish:
Opens the door for a trend continuation downward
Next supports lie at $0.90–$0.80, and possibly $0.65–$0.60
Indicates that sellers are still in control and accumulation has failed
🚫 This would invalidate the bullish setup and signal caution for long positions.
📌 Suggested Trading Plan
Entry Strategy:
Conservative: Wait for a confirmed breakout and successful retest above $1.30
Aggressive: Enter on intraday breakout with strong volume above trendline
Stop Loss: Below triangle support (~$1.02–$1.05)
Take Profits (TP): Scale out at $1.60 / $1.98 / $2.34 / $2.98 / $4.01 / $5.48
💬 Conclusion
EIGEN is on the verge of a major technical move. A clean breakout from the descending triangle could mark the transition from bearish consolidation to bullish expansion — a structure often seen before explosive rallies in altcoins.
Always manage risk wisely, stay alert for retests, and never chase entries without confirmation. This is a setup worth watching closely in the coming days!
#EIGEN #EIGENUSDT #CryptoBreakout #DescendingTriangle #AltcoinSeason #BullishSetup #ChartPattern #BreakoutAlert #SmartMoneyMoves #CryptoTechnicalAnalysis

EIGEN/USDT — Ready to Explode from Accumulation?🔍 Detailed Technical Analysis (1D Timeframe):
After months of bearish pressure, $EIGEN is now showing early signs of a trend reversal. The chart is painting a compelling picture of a breakout setup backed by a strong accumulation base and a long-term descending trendline.
🟨 Solid Accumulation Zone:
Price has been consolidating tightly within the $0.90 – $1.10 range, forming a clear accumulation zone. This zone has acted as a reliable support area multiple times, rejecting bearish attempts and indicating smart money accumulation.
This type of sideways base is often the foundation for explosive upside moves.
📉 Descending Trendline Breakout Setup:
A clear descending resistance line has been holding since the highs in December 2024.
Price is now approaching a critical breakout point. A confirmed breakout above this trendline could mark the beginning of a new bullish trend.
📈 Bullish Scenario (Momentum Breakout):
If price breaks out above the descending trendline and clears the key resistance at $1.227, the path toward higher targets opens up quickly:
Bullish Target Levels Description
🎯 $1.603 Minor psychological resistance
🎯 $1.980 Structural resistance
🎯 $2.341 Fibonacci confluence & supply zone
🎯 $2.982 Medium-term target
🎯 $3.993 Breakout continuation level
🎯 $5.480 – $5.659 Previous all-time high (ATH) region
📌 Note: For a valid breakout, look for a strong daily candle close above $1.227, ideally with high volume to confirm momentum.
🔻 Bearish Scenario (Rejection Play):
If price gets rejected at the trendline and fails to break $1.227:
A pullback to the $1.00 – $0.90 accumulation zone is likely.
If that support fails, price may drop toward:
🔻 $0.85
🔻 $0.78
🔻 $0.68 (key psychological & historical volume zone)
📊 Conclusion: Make or Break Moment Ahead
EIGEN is at a critical decision point. A successful breakout could kick off a major bullish phase, while a failure may extend the sideways or bearish action.
With a strong base formed and pressure building near the trendline, this setup deserves a spot on every trader’s radar.
#EIGENUSDT #CryptoBreakout #AltcoinSetup #TechnicalAnalysis #BullishScenario #BearishScenario #AccumulationZone #PriceAction #CryptoTrading #CryptoAnalysis

EIGENUSDT 1D AnalysisEIGEN ~ 1D Analysis
#EIGEN Buy after successfully penetrating this resistant line with a short -term target of at least 10%+.

EIGENUSDT 1DEIGEN ~ 1D Analysis
#EIGEN If you expect this coin to be bullish again, You have to wait until this resistant line is successfully penetrated.
Bullish will not return before this resistance succeeds in broken.

#EIGEN/USDT#EIGEN
The price is moving in a descending channel on the 1-hour frame and is adhering to it well and is heading to break it strongly upwards and retest it
We have a bounce from the lower limit of the descending channel, this support is at a price of 1.56
We have a downtrend on the RSI indicator that is about to break and retest, which supports the rise
We have a trend to stabilize above the moving average 100
Entry price 1.71
First target 1.83
Second target 1.90
Third target 1.98

EIGEN / USDT : Retesting the Trendline after breakout EIGEN/USDT: Retesting the Trendline After Breakout
EIGEN/USDT is showing promising signs 📈 as it retests the trendline after a breakout 📊. This retest is crucial as it could confirm the trendline as a new support zone, setting the stage for a strong bullish continuation 💥. If the support holds, we could see a significant upward move 🚀. Keep a close watch 👀 on this pair and wait for confirmation before taking action.
Key insights:
1. Trendline retest: EIGEN/USDT is retesting the trendline it recently broke above. Successfully flipping this resistance into support could confirm the breakout and trigger a bullish rally.
2. Volume validation: Monitor trading volume closely. A surge in volume during the retest would confirm strong buyer interest 🔥.
3. Bullish signals: Momentum indicators such as RSI and MACD are showing positive trends ⚡, supporting the likelihood of a bullish continuation.
Steps to confirm the trendline support:
Look for a clear 4H or daily candle closing above the retested trendline 📍.
A noticeable increase in volume during the retest can signal strong buying activity 📊.
If the trendline holds as support, it adds credibility to the bullish continuation ✅.
Be cautious of false signals, such as sharp pullbacks or wicks below the trendline ⚠️.
Risk management strategies:
Use stop-loss orders to manage your risk effectively 🔒.
Ensure position sizing aligns with your overall trading strategy 🎯.
This analysis is for educational purposes only and not financial advice. Always conduct your own research (DYOR) 🔍 before making investment decisions.

EIGENUSDT 1WEIGEN ~ 1W Analysis
#EIGEN Selling pressure seems to have begun to weaken from here. Buy from here if you still have a Conviction on this coin with a minimum target of 20%+.

EIGEN target $6.14h time frame
-
Entry: $3
TP: $6.1
SL: $2.45
RR: 5.7
-
(1) EIGEN is building a descending wedge which is a standard correction from previous pump
(2) Notice $3.3~$3.48 is R/S zone
(3) Fibonacci provides first target at $6.11 and final target at $9.17
(4) Stop loss once going below $2.45

EIGENUSDT 1DEIGEN ~ 1D
#EIGEN Break of $3.2 support, Will bring the price back to test this support block. buy in stages, with a minimum target of 20%+

EIGENUSDT 12HEIGEN ~ 12H
#EIGEN If you still have Conviction on this coin,. Buy gradually within this buy zone. With a minimum target of 20%++

EIGENUSDT New ATH!EIGENUSDT Technical Analysis Update
EGENUSDT price has broken a significant resistance zone after a 65-day downtrend. EIGEN is the second-largest Ethereum staking token by TVL (Total Value Locked), with a current market cap of approximately $1 billion. In the short to mid-term, its market cap could potentially reach $2 billion, and by the end of the bull run, it might grow to $5–10 billion. The price is currently making a new all-time high (ATH).

EIGENUSDT Resistance breakoutEIGENUSDT Technical analysis update
The EIGEN/USDT price has broken the neckline resistance on the 4H chart and is now heading toward the next resistance at $4.20. The price is trading above the 100 and 200 EMA, and a break above the $4.20 level could signal a strong bullish move.
Target : 50%-100%
Regards
Hexa
