Tesla Inc. (TSLA) bullish scenario:The technical figure Channel Down can be found in the daily chart in the US company Tesla Inc. (TSLA). Tesla, Inc. is an American multinational automotive and clean energy company. Tesla designs and manufactures electric vehicles (electric cars and trucks), battery energy storage from home to grid-scale, solar panels and solar roof tiles, and related products and services. Tesla is one of the world's most valuable companies and is, as of 2022, the world's most valuable automaker. The Channel Down broke through the resistance line on 24/01/2023. If the price holds above this level, you can have a possible bullish price movement with a forecast for the next 18 days towards 168.10 USD. Your stop-loss order, according to experts, should be placed at 108.76 USD if you decide to enter this position.
Tesla Inc. said Tuesday it plans to spend $3.6 billion to expand its Sparks, Nev., gigafactory where it currently makes batteries and electric-vehicle parts.
The announcement came a day before the EV maker reports crucial quarterly earnings, and after CEO Elon Musk completed his third day of testimony in a trial over shareholder losses following tweets he made in 2018 about taking Tesla private.
Tesla said the battery facility would have capacity to produce “enough batteries for 2 million light duty vehicles annually.” In early January, Tesla said it delivered about 1.31 million vehicles in 2022. Analysts expect Tesla to increase deliveries to about 1.92 million in 2023.
Risk Disclosure: Trading Foreign Exchange (Forex) and Contracts of Difference (CFD's) carries a high level of risk. By registering and signing up, any client affirms their understanding of their own personal accountability for all transactions performed within their account and recognizes the risks associated with trading on such markets and on such sites. Furthermore, one understands that the company carries zero influence over transactions, markets, and trading signals, therefore, cannot be held liable nor guarantee any profits or losses.
Electricvehicles

NIO CARSif you don't like Tesla, Here Nio, the chinese version.
- Like Tesla, Nio makes luxury electric vehicles. Unlike Tesla, Nio does not make its own EVs, instead partnering with a state-owned auto manufacturer. Nio, Xpeng (XPEV) and Li Auto (LI) are startup rivals to Tesla in China, the world's fastest-growing EV market.
- Nio's great advantage is that its owners have the luxury of using both battery-swap and charging, reducing battery and range anxiety some might have with electric vehicles. In 2021, the founder, Li Bin, announced that Nio plans to expand to 25 different countries and regions by 2025.
Trading Parts :
- Notice the GAP in October 2022, around 10$. Then NIO started his first bullrun to 66$+.
- Right now the Gap has already been taken back in October 2022.
---------------------------------------------------------------
Buy Zones :
---------------------------------------------------------------
- Buy breakout around 13$
or
- Buy Retracement around 10$
TP : 26$ ish. ( at GAP zone )
SL : 5.8$
---------------------------------------------------------------
- Trading is Trading but i consider NIO as good long term investment, but it's just my humble opinion.
Happy Tr4Ding !

PSNY: MACRO ANALYSIS / INTERSECTING CHANNELS / SQUEEZE? (UPDATE)DESCRIPTION: In the chart above I have included an in depth MACRO ANALYSIS of PSNY.
IMPORTANT:
- With late Novembers PRICE ACTION rejection at around 8 POINTS this led me to consider that despite our current uptrend the CEILING of the PREVIOUS DOWNTREND CHANNEL IS STILL VERY MUCH IN PLAY.
- RESISTANCE THAT WAS SEEN AT 8 POINTS WAS EXACTLY WHERE THE INTERSECTION LIES FOR BOTH THE CEILING OF PREVIOUS DOWNTREND CHANNEL AND CURRENT UPTREND CHANNEL.
POINTS:
1. DEVIATION OF 1 POINT PER SUPPLY & DEMAND POCKET. (Gaps between Supply & Demand Pockets is due to lack of STABLE CONSOLIDATION)
2. FUTURE POINTS OF CONTACT were estimated by taking MEAN AVERAGES from PREVIOUS POINTS OF CONTACT.
3. PREDICTED 10 DOLLAR price target by FEBRUARY 14TH was estimated by taking into consideration how much previous rally made price action increase after serious consolidation.
4. IT IS CRUCIAL MACD BEGINS TO STAY CLOSE TO MEDIAN AS IT CAN BE A GREAT PREDICTOR FOR A POTENTIALLY BIG MOVE.
SCENARIO #1: In a bullish scenario price action follows given path or makes more points of contact eventually breaking to the upside from DOWNTREND CHANNEL CEILING.
SCENARIO #2: In a bearish scenario it is important price action does not fall below 5 points this would in fact invalidate entire setup.
FULL CHART LINK: www.tradingview.com
NASDAQ:PSNY
NASDAQ:PSNYW

when is the time to be long for $tsla?
$tsla is the one of the most popular company nowadays and every one has started to talk about getting in regardless what the analysts are saying. It dropped almost 75% from the top and there is still no any sign for uptrend. there are weekly supports may help to keep the price up. However, It seems that It will not bounce back until it touches the lower channel. I will definitely get in if I see uptrend on daily basis.

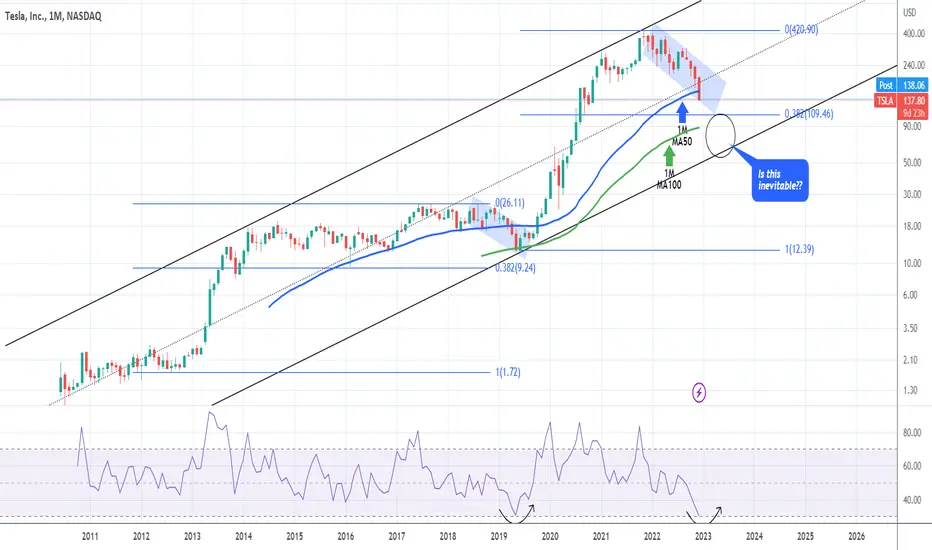
TESLA Is this low price inevitable?Tesla Inc (TSLA) is having one of the worst months in history, breaking below the 1M MA50 (blue trend-line) for the first time since October 2019. The 1W RSI hit the oversold level (30.000) similar to May 2019 but that alone may not be enough to give the stock the much needed Support.
Even though on the May 2019 low the price rebounded just above the 0.382 Fibonacci level, it was most likely the 1M MA100 (green trend-line) that saved the day and provided Support. That is currently considerably lower at 87.50.
What's even worse is the fact that the bottom of historic Channel Up on the log scale that Tesla has been trading in since its IPO, is much lower. Is this test inevitable for the stock? If the current macroeconomic conditions don't shift back to those of low borrowing costs that empowered Tesla's rally the previous years, then the situation can get considerably worse.
What do you think? Is this inevitable?
-------------------------------------------------------------------------------
** Please LIKE 👍, SUBSCRIBE ✅, SHARE 🙌 and COMMENT ✍ if you enjoy this idea! Also share your ideas and charts in the comments section below! This is best way to keep it relevant, support me, keep the content here free and allow the idea to reach as many people as possible. **
-------------------------------------------------------------------------------
You may also TELL ME 🙋♀️🙋♂️ in the comments section which symbol you want me to analyze next and on which time-frame. The one with the most posts will be published tomorrow! 👏🎁
-------------------------------------------------------------------------------
💸💸💸💸💸💸
👇 👇 👇 👇 👇 👇
NIO: Waiting on the Bottom for EVsThis is not actually a bottom starting yet. NIO needs to show some up and down sideways action that holds above the low of 8.40. But it is at strong support level from its IPO sideways pattern from 2018. This is a weekly chart so you can see that long-term support, which is both fundamental and technical.
For ALL Electric Vehicle manufacturers, 2023 may possibly be that big growth year. It is important to keep an eye on all new technologies because when the Post-pandemic Renaissance really takes off, the speed at which EV dominates will probably surprise most people.
The top 3 EV companies, Top 3 Semi-conductor companies for EV, the Top 3 companies for major components like solid state batteries, the Top component manufacturers for sensors, etc. are all up for grabs. Nobody has the lead right now.
It is all about who can convert to robots and robotics faster and who incorporates solid state batteries and other component integration to meet demand. Don't worry about charging stations. Those are already being built and incorporated into gas stations everywhere, corporate offices and public transportation.

MULN | E.V. Contender Oversold | LONGMullen Automotive, Inc., an electric vehicle company, manufactures and distributes electric vehicles. It also operates CarHub, a digital platform that leverages AI to offer an interactive solution for buying, selling, and owning a car; and provides battery technology and emergency point-of-care solutions. The company was founded in 2014 and is based in Brea, California.

LCID Short or GET OUT OF ITNASDAQ:LCID
Major Bearish Trend, Nothing bright in the future, Not in the technical view or fundamental.
The company is losing money, doesn't produce any products, just lies to investors, and wastes their time.
Short it if you get a nice short Fee, leave it if you are long.
Good luck
(*Shorted it so many times)
Price goal - 2$ until bankruptcy


$FSR $5.00 OR $50.00 -----Not a Single Car sighted in LA The first Fisker Ocean rolled off the assembly line at Magna on Nov. 17, in line with expectations. Being on time is a rare feat for EV start-ups.
Fisker expects to build and ship 42,000 Ocean SUVs in 2022. That's the next test for the company and the stock.

Will AI help us in building better batteries?We have written a series of blogs on how artificial intelligence (AI) is advancing other megatrends:
AI Continues to Build the Foundation for a Remarkable Future in Biology
Can AI Replace People? The Truck-Driving Case Study
The World Needs More Metals. Maybe AI can Find Them.
By exploring these connections between themes, we can view AI less as a black box of algorithmic complexity and more as something that is focused on solving concrete problems in the world.
A brief primer on electrochemical batteries1
What we know today as ‘lithium-ion’ batteries fall into the class of ‘electrochemical batteries’. For the battery to generate power the chemical process has to generate electrons, and for the battery to be ‘re-charged’ it has to store electrons.
The structure of the battery involves the anode (negative side), electrolyte and cathode (positive side). The current that the battery can generate relates to the number of electrons flowing across from negative to positive, and the voltage relates to the force with which the electrons are traveling.
Using the battery, that is, using your smartphone or driving your electric car, means that the electrons are flowing from the anode, through the electrolyte and to the cathode. Charging your devices means that you are forcing the process to occur in reverse, where the electrons are leaving the cathode, going back across the electrolyte and ending up in the anode.
Why do we have to know all of that?
Some of you might be like me and think—my last chemistry class was more than 20 years ago. The reason we set that foundation, however, is that it now allows us to think in terms of the following:
The different parts of the battery can be fashioned out of different elements.
Changing the mix of metals in the cathode, for example, may impact the energy density, speed of charging, heat dispersion or other battery characteristics.
Researchers can experiment with all sorts of different anodes, cathodes and electrolytes as they seek to optimise the characteristics of a given battery to its use case.
Now we can better understand the ways in which an artificial intelligence process can be utilised to seek to improve different characteristics of the batteries that we use.
Who wants electric vehicles to charge faster?
One of the many obstacles to the wider usage of electric vehicles is the time it takes to charge a battery vs. filling a tank with petrol. Since filling the tank is much faster, they opt for the internal combustion engine over the battery electric vehicle.
There is huge marketability for automobile manufacturers and battery-makers for every unit of time they can shave off of charging times.
Researchers at Carnegie Mellon used a robotic system to run dozens of experiments designed to generate different electrolytes that could enable lithium-ion batteries to charge faster. The system is known as Clio, and it was able to both mix different solutions together as well as measure performance against critical battery benchmarks. These results were then fed into a machine-learning system, known as Dragonfly2.
Dragonfly is where the process starts to get exciting—the system is designed to propose possible combinations of chemicals to be used in the electrolytes that could potentially work even better. Using this process during this particular time period led to six different electrolyte solutions that outperformed a standard one when they were placed into typical battery test cells. The best option showed a 13% improvement relative to the top-performing battery baseline3.
In reality, electrolyte ingredients can be mixed and matched billions of different ways, but the benefit of using the system of Clio and Dragonfly working together is that one can get through a wider array of possibilities faster than humans alone. Dragonfly also isn’t equipped with information about chemistry or batteries, so it doesn’t bring the ‘bias of previous knowledge or experience’ to the process.
Using AI to help the progress of solid-state batteries
While the aforementioned path involves improving liquid electrolytes, it is not the only critical area of battery research today.
If the flammable, liquid electrolyte is replaced by a stable solid, it’s possible that there would be improvements in battery safety, lifetime and energy density. However, finding the appropriate materials to facilitate building solid-state batteries that fit all specifications and that can be produced at scale is not a simple matter.
Researchers at Stanford have noted a particular process where they compile data on 40 materials with both good and bad measured room temperature lithium conductivity values. This particular characteristic is thought to be the most restrictive of all the different constraints on candidate materials. The 40 examples are ‘shown’ to a logistic regression classifier, which can ‘learn’ to predict whether the material performed well or not based on the atomistic structure. After the training phase, the model can then evaluate more than 12,000 lithium-containing solids and find around 1,000 of them that have a better than 50% chance of exhibiting fast lithium conduction4.
Progressing solid state batteries along the development path is therefore another clear use-case for artificial intelligence.
Conclusion: energy storage is one of the most important considerations for the coming decades
Having better energy storage solutions will help global society in myriad different ways. The classic case—there are intermittent power generation sources like solar and wind that can use batteries to equilibrate the flows of energy across time. However, I think we’d all love smartphones that don’t need a charge for a week or electric vehicle batteries with long range that can charge in similar times to what it previously took at a gas station.
Sources
1 Source:Volts - A primer on lithium ion batteries
2 Source: Temple, James. “How robots and AI are helping develop better batteries.” MIT Technology Review. 27 September 2022.
3 Source: Temple, 27 September 2022.
4 Source: Reedgroup Stanford

Buy DCFC TritiumLovely looking monthly chart here on this recent electric charging ipo on the nasdaq. The three monthly candles of Jan, Feb and March show a very nice bullish pattern.
Biden ramped the hell out of this one, when the management met him and he talked about it in his press conference right up to $20 in one day before profit takers stepped in. Nice one to buy at 8.8, hold and forget about for a few years. Expect this one to grow a lot.

RIVN: Torque to 44?!RIVIAN AUTOMOTIVE
Intraday - We look to Buy at 31.23 (stop at 26.03)
The trend of higher lows is located at 28.60. This is positive for sentiment and the uptrend has potential to return. Prices expected to stall near trend line support. Dip buying offers good risk/reward.
Our profit targets will be 43.94 and 48.00
Resistance: 44.00 / 57.00 / 108.00
Support: 30.00 / 19.00 / 10.00
Please be advised that the information presented on TradingView is provided to Vantage (‘Vantage Global Limited’, ‘we’) by a third-party provider (‘Signal Centre’). Please be reminded that you are sole ly responsible for the trading decisions on your account. There is a very high degree of risk involved in trading. Any information and/or content is intended entirely for research, educational and informational purposes only and does not constitute investment or consultation advice or investment strategy. The information is not tailored to the investment needs of any specific person and therefore does not involve a consideration of any of the investment objectives, financial situation or needs of any viewer that may receive it. Kindly also note that past performance is not a reliable indicator of future results. Actual results may differ materially from those anticipated in forward-looking or past performance statements. We assume no liability as to the accuracy or completeness of any of the information and/or content provided herein and the Company cannot be held responsible for any omission, mistake nor for any loss or damage including without limitation to any loss of profit which may arise from reliance on any information supplied by Signal Centre.

Nio (NIO) | Attractive $10 vol.2Hi,
Technically speaking not the best criteria but not so bad either so I would like to share it as an idea. Combine fundamental analysis with technical, fundamental is your own thing but some technical viewpoints are:
1. The round number $10
2. Gap fill from 2020 June
3. Fibo Extension
4. Previously worked resistance level
Do your fundamentals, it should be a strong one because be ready to grab it from lower prices as well but to start building NIO positions it looks correct spot, at least technically speaking.
Good luck,
Vaido

IDEX | EV Penny Stock | OversoldIdeanomics, Inc., through its subsidiaries, develops zero emission mobility solutions for the off-highway and on-highway commercial vehicle markets in Asia and the United States. The company's Ideanomics Mobility business unit focuses on the commercial adoption of electric vehicles (EV) by commercial fleet operators. This business unit provides solutions for the procurement, financing, charging, and energy management needs for the fleet operators of commercial EVs; and zero emission mobility solutions, such as the provision of commercial electric vans, trucks, buses, electric tractors, and two-wheeled transportation, supporting by the provision of energy services and infrastructure for the EV market comprising charging systems, energy storage, and energy generation, including hydrogen and solar, and associated data and management applications. It also offers high-power inductive charging solutions for medium and heavy-duty EVs; manufactures and distributes electric powered tractors; manufactures and sells hydrogen fuel cells and power electronics for electric, hydrogen, and hybrid powered vehicles; manufactures and sells electric motorcycles and the FIM Enel MotoE World Cup; sells EV bikes, scooters, and batteries under the Treeletrik brand; and sells ride hailing vehicles, electric vans, trucks, buses, and EV batteries. The company's Ideanomics Capital business unit provides fintech services, which focuses on the enhancement of efficiency, transparency, and profitability for the financial services industry. This business unit offers solutions for the real estate transactions, including title and escrow, residential and commercial title insurance, and closing and settlement services, as well as specialized offerings for the mortgage process industry; and acts as the Financial Industry Regulatory Authority-registered broker dealer that operates a funding platform. Ideanomics, Inc. was incorporated in 2004 and is headquartered in New York, New York.

LiveWire LVW EV Motorcycle Company SPAC Blank Checkran across this in a Michael Burry article.
Transaction net proceeds of $545 million* will fund LiveWire's strategic plan to accelerate its go-to-market model, invest in new product development, and enhance global manufacturing & distribution capabilities
- LiveWire will benefit from industry-leading strategic partners - Harley-Davidson and KYMCO, a leading global powersports company headquartered in Taiwan - by leveraging their engineering expertise, manufacturing footprint, distribution, supply chain infrastructure and global logistics capabilities
- LiveWire pro forma enterprise value of approximately $1.77 billion
- Harley-Davidson and ABIC to Host a Joint Conference

Tesla - Recession poised to weigh on TSLA stock for longerThe next day after its earnings release for Q3 2022, shares of Tesla fell 6.65% by the closing bell. This move came despite record-breaking revenue being reported by the company, but one, which missed analysts' estimates. The company's report stated that the operating margin reached 17.2% and free cash flow exceeded 8.9 bn. U.S. dollars for the past 12 months.
In addition to that, the company said it would continue to focus on increasing production and development of its current projects. In the third quarter, Tesla produced over 365,000 vehicles and delivered over 343,000 of them, putting these figures substantially higher than those for previous quarters.
Overall, the earnings report was solid. But that does not change the fact a recession is underway, and the stock is down approximately 50% from its all-time-high value. While that looks like a bargain to the past, we do not think so. In our opinion, the increasing cost of electricity (or even its unavailability in some countries because of the energy crisis) will pose a short-term obstacle to selling more cars for Tesla in Europe.
Furthermore, with people's declining savings, we expect consumers' willingness to buy vehicles to fall dramatically in the next year. Indeed, we think this will pose another substantial challenge for the company in 2023. Because of that, we believe now is not the time to buy this stock; instead, we will stay on the sidelines and wait. Our views are based on a combination of fundamental and technical factors.
Illustration 1.01
The picture above shows the Tesla stock deep in the bear market territory, down approximately 50% from its all-time-high value.
Technical analysis - daily time frame
MACD is bearish but flattening. RSI and Stochastic are bearish. DM+ and DM- are bearish as well. Overall, the daily time frame is bearish.
Illustration 1.02
The image above displays the daily chart of Tesla stock. It also shows simple support/resistance levels. We will monitor the price and its ability to hold above/below the immediate support; if the price fails to hold above it, it will be bearish.
Technical analysis - weekly time frame
RSI, MACD, Stochastic, DM+, and DM- are all bearish. Overall, the weekly time frame is bearish.
Please feel free to express your ideas and thoughts in the comment section.
DISCLAIMER: This analysis is not intended to encourage any buying or selling of any particular securities. Furthermore, it should not be a basis for taking any trade action by an individual investor. Therefore, your own due diligence is highly advised before entering a trade.

10/16/22 TSLATesla, Inc. ( NASDAQ:TSLA )
Sector: Consumer Durables (Motor Vehicles)
Market Capitalization: $642.33B
Current Price: $204.99
Breakdown price: $207.50
Sell Zone (Top/Bottom Range): $211.25-$255.00
Price Target: $182.80-$186.00 (1st), $83.80-$78.40 (2nd)
Estimated Duration to Target: 14-17d (1st), 123-129d (2nd)
Contract of Interest: $TSLA 11/18/22 200p, 2/17/23 180p
Trade price as of publish date: $16.05/contract, $20.10/contract

Descending Broadening Wedge for TSLA?!?Bearish cross on the Williams Alligator.
Bullish Cross on the KST.
$25.00 by 2025 unless TSLA pulls another Solar City-type deal with SpaceX.
If the stock does a 360 it'll only be to $360USD.

TESLA - $TSLA - Head & Shoulder - Distribution almost OVER!!!!!When great trees fall, rocks on distant hills shudder, lions hunker down in tall grasses, and even elephants lumber after safety.
Soon Tesla will move from the head & shoulder -- down to its KNEES and that is when we will execute our entry for a long hold.
Sorry Elon, your Ponzi gig is up, you can't produce because you don't have materials and the ones that exist are over priced just like your vehicles.
Your stuck boo, your in a corner, stalemate, king cannot MOVE!
I presented this head & shoulder pattern on $TSLA back in July, before the Right Shoulder was complete and now we are on to the final stages.
I see a bounce occurring before heading lower.
On Monday - US holiday - we should expect lower volume and usually that means a sell off.
This view is on a weekly timeframe. I believe Tesla will wick below the neckline as it has in the past and then squeeze up and fill the GAP to $262.47 (1st target).
If the S&P500 shows strength mid October, prior to OPEX options expiry date, Tesla may keep trekking up the the second target which is in the $290 range before breaking the neckline.
Head and shoulder criteria:
1. Buying volume is diminishing and showed most strength on the left shoulder.
2. The head is much higher then the left shoulder.
3. The neckline fits the description of a proper head and shoulder pattern.
GOOODLUCK TRADERS!

TESLA Ahead of the first 1D Golden Cross since August 2021.Tesla (TSLA) confirmed the Bull Flag from our last analysis one month ago and broke out of it while holding twice the Higher Lows trend-line from the June 16 Low:
The last touch was three days ago and naturally that is giving the stock a short-term (at least) boost. The price completed the 1D MA50/ MA100 Bullish Cross last month but now is ahead of the critical Golden Cross formation (when the 1D MA50 (blue trend-line) crosses above the 1D MA200 (orange trend-line)). If completed, it will be the first occurrence since August 2021. Technically that should be a strong bullish signal but the Higher Lows trend-line plays an equally important role. If broken the uptrend may turn into the (green) Rectangle pattern that has kept the price from breaking above 315.00 three times.
This is approximately where the 0.618 Fibonacci retracement level is and if broken we can finally see the bullish rally completing a new Lower High at the top of the long-term Channel Down. A break below the Rectangle, can test the 0.236 Fibonacci as the next Support level. Keep an eye on the MACD (1W time-frame). It is still on a Bullish Cross but a new Bearish Cross could mean a new round of medium-term selling towards the bottom of the Channel Down, much like the Jan 05 and April 28 Bearish Crosses.
-------------------------------------------------------------------------------
** Please LIKE 👍, SUBSCRIBE ✅, SHARE 🙌 and COMMENT ✍ if you enjoy this idea! Also share your ideas and charts in the comments section below! This is best way to keep it relevant, support me, keep the content here free and allow the idea to reach as many people as possible. **
-------------------------------------------------------------------------------
You may also TELL ME 🙋♀️🙋♂️ in the comments section which symbol you want me to analyze next and on which time-frame. The one with the most posts will be published tomorrow! 👏🎁
-------------------------------------------------------------------------------
👇 👇 👇 👇 👇 👇
💸💸💸💸💸💸
👇 👇 👇 👇 👇 👇

Dark Pool Buy Zones and Sell Short Risk: LCIDDark Pool buy zones tend to provide strong support for stocks running down. If a stock violates the lows of such support, the rebound tends to come quickly, erasing any sell short profits.
This young EV auto manufacturing company is near its IPO price range, which is strong support. The retest of the lows of this bottoming action doesn't show much downside potential for a strong sell short.
There is risk that LCID may gap or run down but then reverse quickly and move back up. Whipsaw reversal candles near Dark Pool buy zones can cause big losses for short sellers at this level.

Rivian Could Be Forming a RangeElectric vehicles have been in focus since the Inflation Reduction Act boosted green-energy incentives. Let’s check out Rivian Automotive, the truck maker trying to stabilize after a big slide.
The main pattern on today’s chart is a parallel channel forming between roughly $30.80 and $40. RIVN initially bounced at the low in mid-June before proceeding to a four-month high. It pulled back to retest that low in late August before rebounding to $40. The stock ended last week back near the bottom of the range. Will investors look for the recent low to provide support?
Next, stochastics are nearing an oversold condition. RIVN’s bounce in early September followed a rebound from the oversold low. Traders may watch the oscillator for clues again.
Third, in addition to the channel, price is trying to bounce at the 100-day simple moving average (SMA). That could suggest its longer-term trend is getting more bullish.
TradeStation has, for decades, advanced the trading industry, providing access to stocks, options, futures and cryptocurrencies. See our Overview for more.
Important Information
TradeStation Securities, Inc., TradeStation Crypto, Inc., and TradeStation Technologies, Inc. are each wholly owned subsidiaries of TradeStation Group, Inc., all operating, and providing products and services, under the TradeStation brand and trademark. You Can Trade, Inc. is also a wholly owned subsidiary of TradeStation Group, Inc., operating under its own brand and trademarks. TradeStation Crypto, Inc. offers to self-directed investors and traders cryptocurrency brokerage services. It is neither licensed with the SEC or the CFTC nor is it a Member of NFA. When applying for, or purchasing, accounts, subscriptions, products, and services, it is important that you know which company you will be dealing with. Please click here for further important information explaining what this means.
This content is for informational and educational purposes only. This is not a recommendation regarding any investment or investment strategy. Any opinions expressed herein are those of the author and do not represent the views or opinions of TradeStation or any of its affiliates.
Investing involves risks. Past performance, whether actual or indicated by historical tests of strategies, is no guarantee of future performance or success. There is a possibility that you may sustain a loss equal to or greater than your entire investment regardless of which asset class you trade (equities, options, futures, or digital assets); therefore, you should not invest or risk money that you cannot afford to lose. Before trading any asset class, first read the relevant risk disclosure statements on the Important Documents page, found here: www.tradestation.com .
