XRP: Wave 4 Corrective Structures Signaling Final Push?🔹 Overview:
We’re currently witnessing a variety of corrective structures across the crypto market, with assets like XRP showing significant strength, while Cardano (ADA) and SUI appear to be forming classic ABC corrections and wave 4 setups. These patterns align with historical market cycles, particularly resembling price action from September 2017, before a final wave 5 rally.
🔹 Technical Breakdown:
-XRP has remained resilient, consolidating instead of breaking down—indicative of a strong underlying structure.
-Cardano (ADA) is following a textbook ABC correction, similar to past pre-wave 5 setups.
-SUI is showing signs of a wave 4 consolidation, which typically precedes a final wave 5 push.
These patterns corroborate each other, suggesting a synchronized market move is approaching.
🔹 Macro Market Alignment:
-2017 Parallel: When comparing current structures to past cycles, we see striking similarities. XRP’s correction phase now mirrors its 2017 structure, aligning with the moment before its parabolic move.
-Stock Market Correlation: Broader macro trends, including mega-cap stock movements, also support the prediction of one last rally before the cycle concludes.
🔹 Key Considerations:
✅ Wave 5 Blow-Off Top: If historical patterns hold, we could see a broad market rally leading to a final euphoric push.
✅ Retrace vs. New Highs: While some altcoins may set new all-time highs, many will likely only retrace previous losses rather than break out into price discovery.
✅ Timing Expectations: Based on previous cycle durations, a final move could fully play out by mid-2025. However, market sentiment and liquidity will ultimately dictate the speed.
🔹 Trade Plan & Risk Management:
⚠️ Final phase of the cycle – time to start considering exit strategies for long-term positions.
⚠️ Watch for confirmation signals – particularly evidence of expansion across the market.
⚠️ If the rally fails to materialize, and markets continue retracing, this could signal a deeper macroeconomic shift.
🔹 Final Words:
The market structure suggests we are in the late-stage corrective phase, setting up for a final impulsive wave. While exact timing remains uncertain, this aligns with previous cycle patterns. Keeping an eye on XRP, Cardano, and SUI as key indicators will be crucial in confirming this prediction.
🔻 What do you think? Are we about to enter a final wave, or is the market sentiment shifting into an extended downturn? Drop your thoughts in the comments!
📈 Like & Follow for more in-depth market analysis! 🚀
Ell

Long w5/w4 #BTC #Bitcoin #BTCUSD #Elliottwave 18Oct23This count is based on my assumptions so anything can happen not a trading or financial advice just for educational purposes only kindly do your own ta thanks trade with care good luck.

The Exact Path Of BTC For The Next 4 Years BINANCE:BTCUSDT.P
the analysis is transparent as Light
No need for explanation
stay hungry

GBPJPY Complex CorrectionHello Traders,
Here is an analysis of GBPJPY. It seems that this pair is already completing the WXY structure and thus will move to the downside. Alternation is a break above the trendline and can be a new movement to the upside. I might be wrong but the bias is more to bearish structure

TSLA SEP 2021, MAJOR MOVES FROM SEP 1ST - SEP 17THThe vertical column indicates timing of when a MAJOR MOVE in TSLA will occur.
Specifically, after closing hours on Sep 1st to Sep 17th...
I'm looking to enter, September 1st, maybe just before market close.

LONG ZNGA $9.5 BY SEP 7thI anticipate Zynga to have a strong bullish trend, even in a lockdown.
The first TP is $9.5 in September.
It's possible ZNGA can reach ATH of $14, so I'm planning to hold long-term and sell covered calls with it on the way up!

8/6 TSLA PUT from 721 to 655, 641, 633Looks like TSLA is following this setup, so likely a quick drop, before rebounding...
Looking to get in around 721, and out around 655.

AMAZON TARGET: $2965, BETWEEN 9/7-9/24, THEN SURGE UP2X GAP PRICE, + 3X TIME BUILD UP = $2965 DIP BY 9/7/-9/24, THEN SURGE UP
PRICE IS 2965, TIME IS 9/7 OR 9/24


guys add your sells now or tomorrow with the new candle guys see the pattern... there a confirmation here aswell check the monthly chart which i share with you guys to show you the diamond pattern. i hope the market wont be doing the same thing that it was doing from the last 2 days.. made profits but the sl hunting was shit. anyways check the other chart for gold to see what i was telling in the revious chart. thanks

EURAUD Sell opportunittyAfter forming a long range right below the monthly PRZ we can see how price created a nice support at the 1.6200 area that also lines up with the 38% and the 61% but this week we finally saw how it broke and clsoe right below it forming a new low so right now i mexpecting a drop to the 1.6070 area maybe the 1.6000 area

XRPUSD: Buy SetupFrom the Elliott wave point of view, the price has finished the ABC correction in the 4th wave of the bullish cycle on the H4 chart. When the price forms a buy fractal above the Alligator line and breaks it - it would be an optimal level to go long with targets at wave 5. Take profit level is identified on the chart using trend-based Fibo extension. Stop loss below the 4th wave.


Elliott wave analysis oil daily chartWave five is ending diagonal, it then followed by a sharp 5 sub-wave correction. The current market is in B wave which correct previous wave A, I don't recommend to enter B wave, we should watch carefully and anticipate c wave.

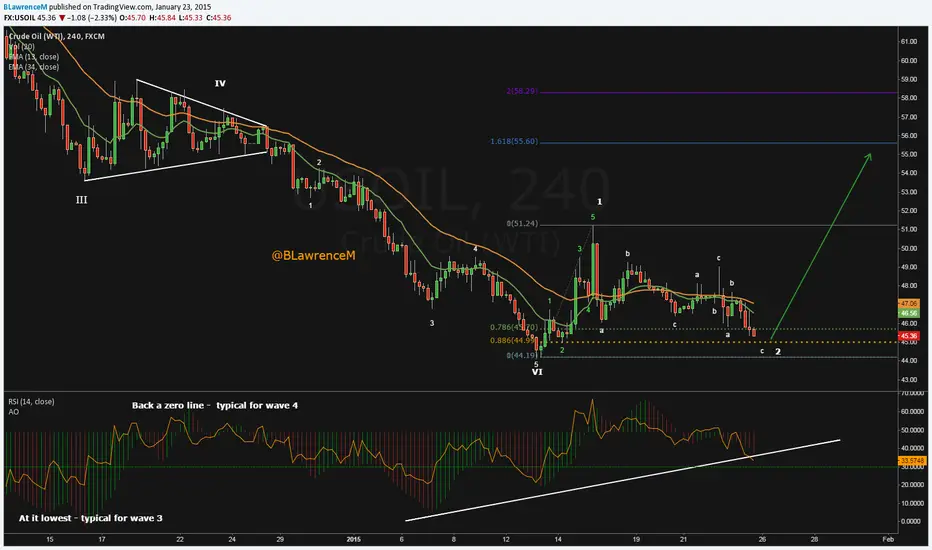
Dancing (Blood) in the streets - EW on USOIL I see a bottoming process here for crude.
For the first time since the june 2014 decline began the ma's are flattening and even the 50 ma is pointing up now (50ma not shown)
The bollinger band is narrowing in and todays price actually stopped at the lower daily bollinger band.
I'd say price has set in the low on the 13th of jan and has completed it's first wave up (in green) above the forme wave 4 in the 5th wave down at 49.58.
That is significant and mean the downtrend has stopped by setting in a higher high - 2 days later on the 15th of jan. at 51.24.
Fridays action completed wave 2 down. (We could monday see a little push down towards the 0.886 retrace for taking out stops).
At the same time there is positive divergens on the RSI and the Awesome Osc.
When the 13 ema making a golden cross of the 34 ema we have the conformation.
I expect the price to rally to the 50 dma which in a week or so - will come in a little above the middle bollinger band around the 1.618 extension.
If you cast a glance at my other chart on $USOIL l made with harmonic pattern tools - you'll see that the 1.618 extension of wave 1 comes in around the same handle as the 1.272 extension - the target for the D-leg.
So 2 techniques are showing the same.
Safe trading ladies and gents!
@BLawrenceM
Music at work:
www.youtube.com
open.spotify.com